The translation and localization industry grows rapidly. Global companies expand into new markets, user expectations increase every year, and project timelines move faster than ever. Because of this, translation teams need clear and accurate insights to manage performance, cost, quality, and delivery.
A Translation & Localization Dashboard in Power BI solves this need. It organizes business data in one place and provides real-time visuals that help teams work smarter. With this dashboard, leaders can track costs, analyze languages, compare industries, and study project trends with just a few clicks.
In this article, you will learn what this dashboard is, how each page works, why businesses use it, and how it helps improve translation operations. You will also explore advantages, best practices, and frequently asked questions—everything you need to understand this powerful reporting tool.
Click to Purchases Translation & Localization Dashboard in Power BI
What Is a Translation & Localization Dashboard in Power BI?
A Translation & Localization Dashboard in Power BI is a ready-to-use reporting system built to help translation companies, localization teams, and freelance agencies track their entire workflow in one visual platform.
It brings together data on languages, industries, project types, revenue, costs, and client satisfaction. Power BI then transforms this information into charts, KPIs, trends, and comparisons that help decision-makers understand performance instantly.
Because the dashboard works in Power BI, users get interactive slices, drill-downs, filters, and auto-refresh capabilities. Once the data updates, the visuals refresh automatically.
You can monitor:
-
Total revenue
-
Total cost
-
Profit margin %
-
Translation and proofreading costs
-
Cost per industry
-
Cost per source and target language
-
Trends across months
-
Client satisfaction
-
Payment method behavior
This gives teams a strong understanding of their operations without needing complex manual reports.
Why Do Companies Need a Translation & Localization Dashboard in Power BI?
Translation and localization projects involve many variables. Companies work with different industries, dozens of languages, multiple project types, and various cost models. As work increases, manual tracking becomes slow and confusing.
This dashboard offers clarity and speed. You can see where revenue grows, which languages cost more, which industries bring the highest profit, and how clients behave over time.
Teams make quick decisions because the dashboard:
-
Shows trends clearly
-
Highlights cost leakages
-
Identifies profitable industries
-
Tracks payment behavior
-
Improves project planning
-
Supports faster reporting
-
Reduces dependency on manual spreadsheets
This leads to better forecasting, stronger cost control, and improved client relationships.
Key Features of the Translation & Localization Dashboard in Power BI
This dashboard includes five powerful pages, each designed to answer specific business questions. Below is a detailed breakdown of each page with enhanced explanations.
1. Overview Page – What Insights Can You See Instantly?
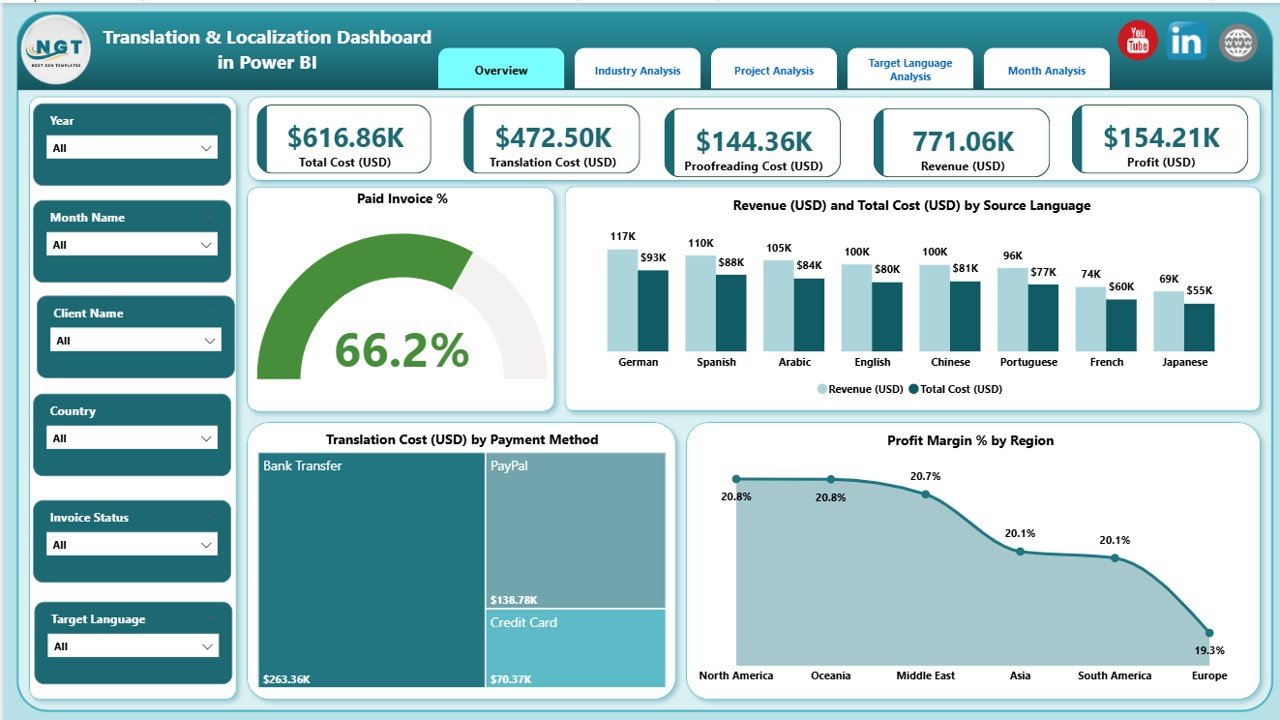
The Overview Page works like the control center of the dashboard. You can monitor all high-level KPIs, trends, and business performance in just a few seconds.
Main Highlights of the Overview Page
-
🌟 4 KPI Cards:
-
Paid Invoice %
-
Revenue (USD)
-
Total Cost (USD)
-
Profit Margin %
-
-
📊 4 Key Charts:
-
Revenue and Total Cost (USD) by Source Language
-
Translation Cost (USD) by Payment Method
-
Profit Margin % by Region
-
Paid Invoice % (summary pattern)
-
-
🎯 Silencers/Filters:
You can slice data by month, region, language, project type, or industry to drill down into specific areas.
Why This Page Matters
This page gives leaders a bird’s-eye view. Users understand quick patterns, such as:
-
Which language generates the highest revenue
-
How costs behave across different payment methods
-
Which region delivers better profit margins
-
How paid invoices move over time
This helps managers take faster action when performance drops or opportunities rise.
Click to Purchases Translation & Localization Dashboard in Power BI
2. Industry Analysis Page – Which Industries Drive the Most Value?
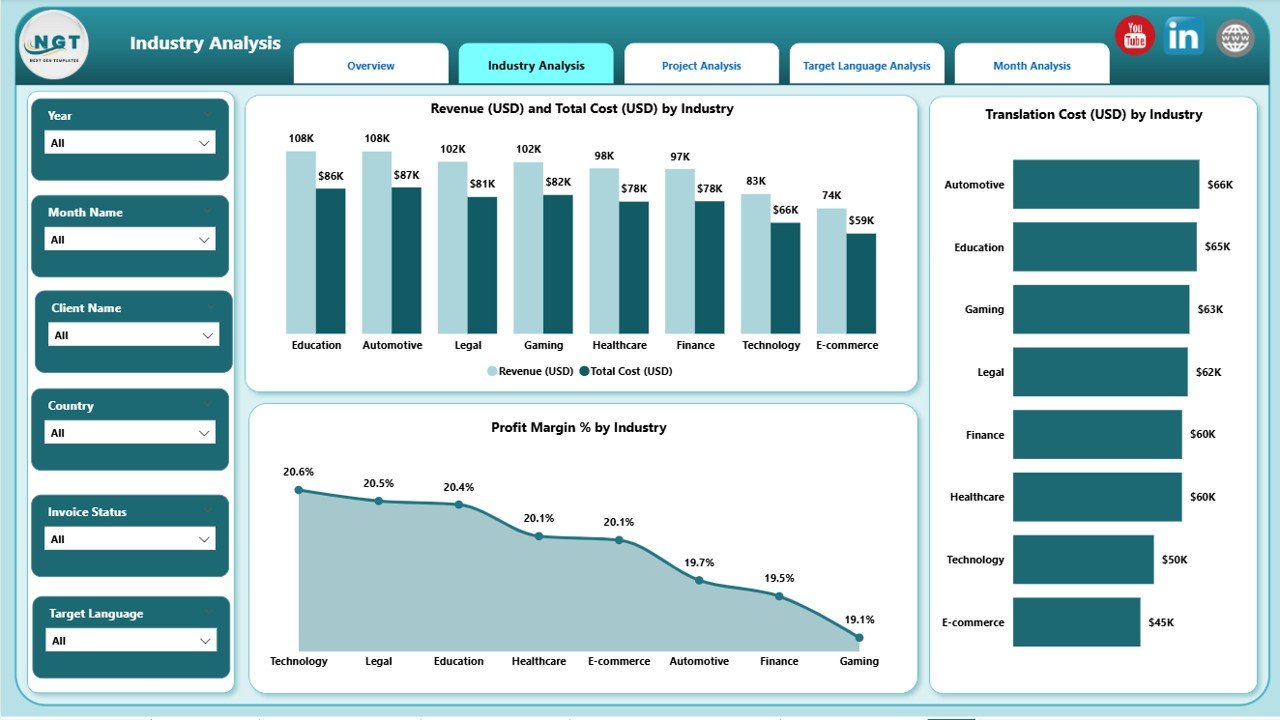
The second page focuses on industry-level insights. Since different industries have different translation needs, this view helps teams allocate resources wisely.
Charts Included
-
Revenue (USD) and Total Cost (USD) by Industry
-
Translation Cost (USD) by Industry
-
Profit Margin % by Industry
Why This Page Is Useful
Industries like Legal, Medical, Technical, Gaming, Marketing, and Finance behave differently. This page helps you understand:
-
Which industries generate higher revenue
-
Which industries bring high translation or proofreading costs
-
Where profit margins look strong
-
Which industries may require pricing adjustments
You can plan capacity, cost structures, and client strategies with confidence.
3. Project Analysis Page – How Do Different Project Types Perform?
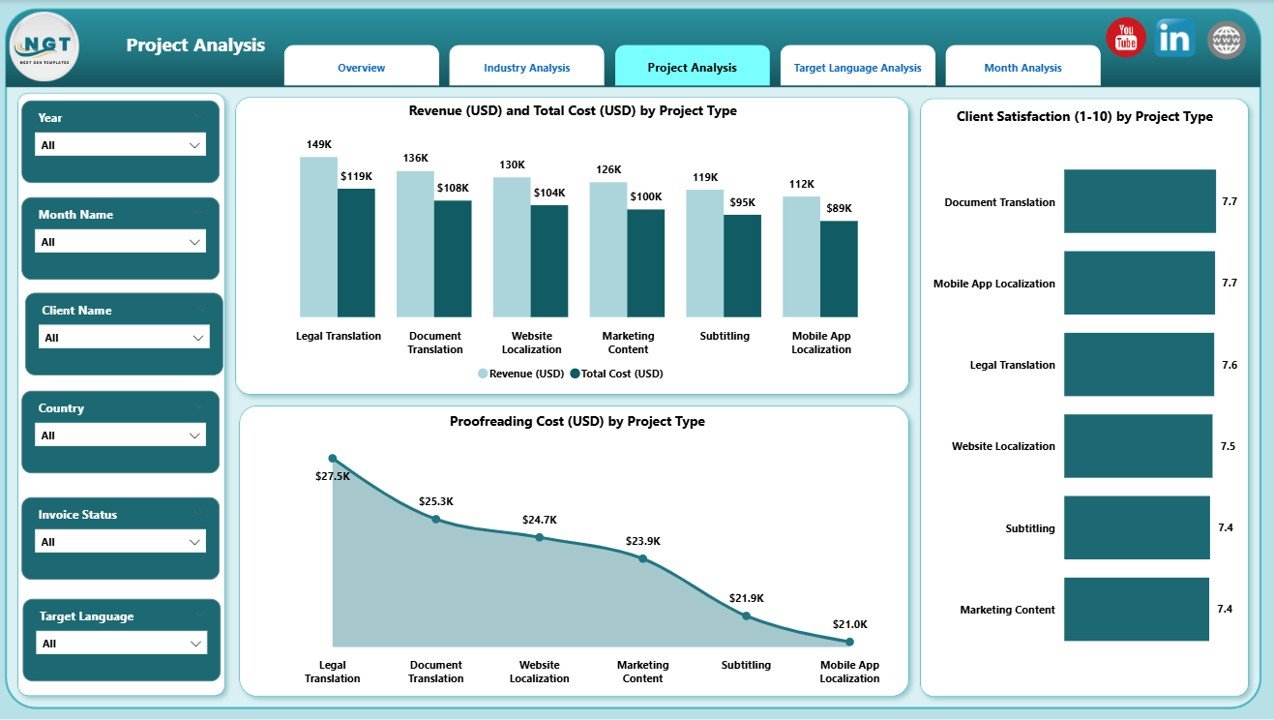
The Project Analysis page focuses on the performance of various project types such as:
-
Translation
-
Localization
-
Subtitling
-
Voice-over
-
SEO translation
-
App localization
-
Website translation
-
Proofreading-only assignments
Charts Included
-
Revenue and Total Cost (USD) by Project Type
-
Client Satisfaction by Project Type
-
Proofreading Cost (USD) by Project Type
What You Learn From This Page
You understand:
-
Which project types generate the most revenue
-
Which ones consume higher costs
-
How clients rate different project types
-
Where proofreading adds significant cost
This helps teams improve service quality, set better pricing, and match translators to suitable project categories.
4. Target Language Analysis – Which Target Languages Perform the Best?
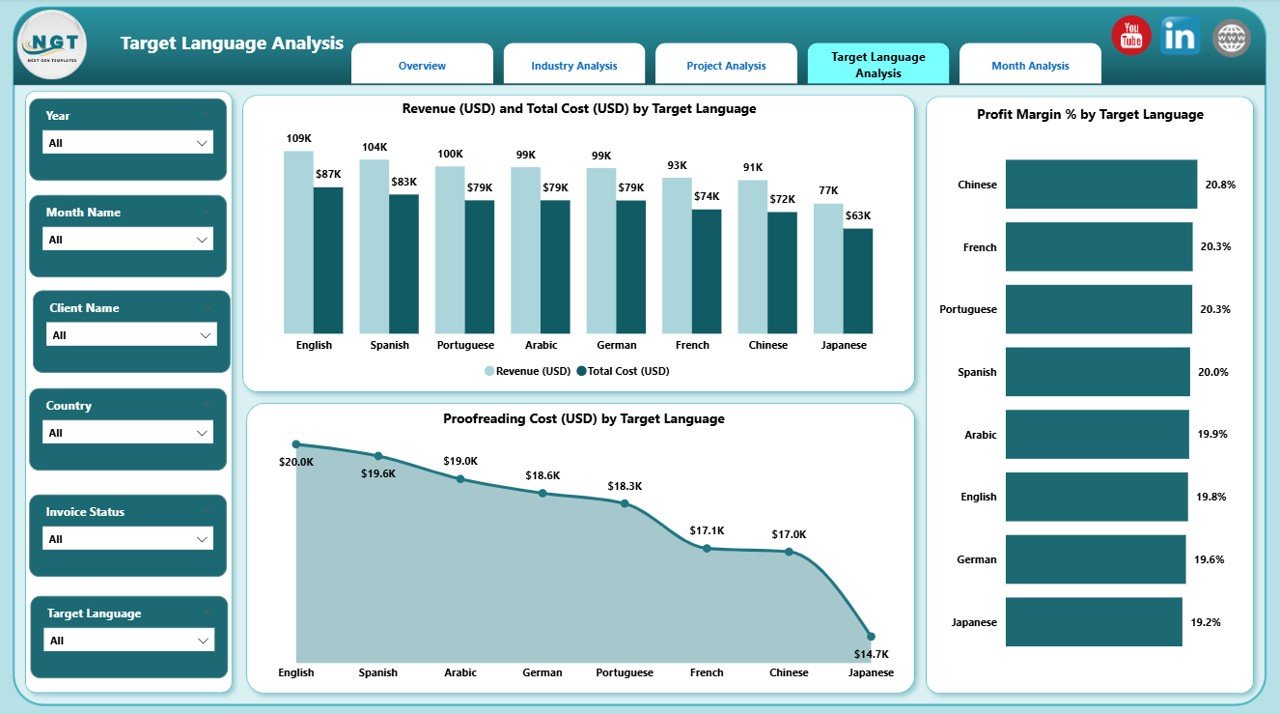
Translation always moves from a source language to a target language. This page focuses on the target output.
Charts Included
-
Revenue and Total Cost (USD) by Target Language
-
Profit Margin % by Target Language
-
Proofreading Cost (USD) by Target Language
Insights This Page Provides
You can compare languages such as:
-
English
-
French
-
German
-
Spanish
-
Chinese
-
Japanese
-
Arabic
-
Portuguese
This helps teams identify:
-
High-demand languages
-
Languages with higher translation or proofreading cost
-
Regions where margins stay strong
-
Languages that require additional resources
This is helpful for resource planning, rate card adjustments, and forecasting.
5. Monthly Trends Page – How Do Revenue and Costs Change Over Time?
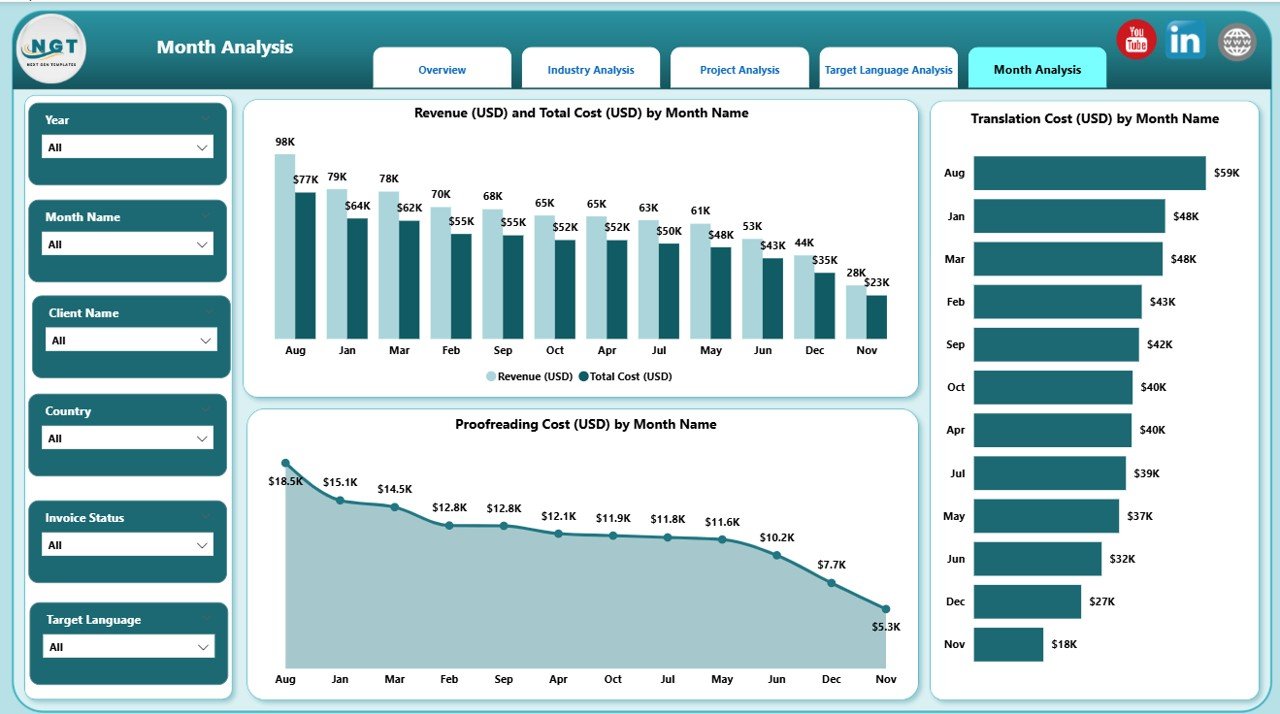
The Monthly Trends page tracks how your translation business grows month by month.
Charts Included
-
Revenue (USD) and Total Cost (USD) by Month
-
Translation Cost (USD) by Month
-
Proofreading Cost (USD) by Month
Click to Purchases Translation & Localization Dashboard in Power BI
Why This Page Is Important
This helps leaders track:
-
Seasonality patterns
-
Slow vs. busy months
-
Cost spikes
-
Profit trends
-
Yearly comparison opportunities
Teams can plan staffing, budgeting, and promotional strategies based on real performance data.
Advantages of a Translation & Localization Dashboard in Power BI
Below are the biggest advantages of using this dashboard:
⭐ 1. Real-Time Performance Insights
Teams see performance instantly. This helps leaders react quickly and stay ahead.
⭐ 2. Centralized and Clean Reporting
All industry, language, and project data stays in one place. This solves the problem of scattered spreadsheets.
⭐ 3. Better Financial Clarity
The dashboard shows revenue, cost, and profit margins clearly. You understand which activities impact the bottom line.
⭐ 4. Accurate Language-Level Tracking
Since each language behaves differently, the dashboard highlights both opportunities and risks.
⭐ 5. Improved Client Management
Client satisfaction trends help teams improve communication and service quality.
⭐ 6. Smart Forecasting
Monthly patterns help teams forecast workload and plan budgets accurately.
⭐ 7. Easy for Anyone to Use
Power BI makes the visuals interactive and simple to understand. You do not need technical knowledge to use the dashboard.
Best Practices for Using the Translation & Localization Dashboard in Power BI
To get maximum benefits from this dashboard, follow these best practices:
🔹 1. Update Data Regularly
Frequent updates ensure more accurate insights.
🔹 2. Review Monthly Trends Carefully
Check seasonality patterns to plan staffing and budgets.
🔹 3. Track High-Cost Languages
Some languages require premium translators. Use the dashboard to adjust pricing.
🔹 4. Study Industry Behavior
Different sectors behave differently. Adjust offers and service levels accordingly.
🔹 5. Monitor Client Satisfaction Often
Use satisfaction trends to improve your service delivery.
🔹 6. Compare Revenue vs. Cost Frequently
Keep your financial health strong by reviewing profit margins weekly or monthly.
🔹 7. Use Filters Before Making Decisions
Filters help you see patterns clearly and avoid wrong assumptions.
Conclusion
A Translation & Localization Dashboard in Power BI gives companies the power to analyze operations in a simple, visual, and accurate way. Since the dashboard tracks industries, languages, project types, costs, and trends, users get complete clarity on their performance. Teams make smarter decisions, reduce costs, improve profitability, and deliver better results to global clients.
If you want deeper insights, faster reporting, and reliable performance tracking, this dashboard becomes an essential tool for your translation and localization business.
Frequently Asked Questions (FAQs)
1. What is a Translation & Localization Dashboard in Power BI?
It is a reporting dashboard that tracks translation revenue, costs, languages, industries, project types, trends, and profit margins using Power BI visuals.
2. Who can use this dashboard?
Translation companies, localization agencies, freelance teams, project managers, and global marketing teams use it.
3. Why is this dashboard important?
It provides real-time insights, financial clarity, and operational transparency. This helps teams make better business decisions.
4. Can this dashboard track languages separately?
Yes, it shows both source and target language performance, including cost, revenue, and profit margins.
5. Does it help track project types?
Absolutely. It compares different project types like translation, localization, subtitling, voice-over, and more.
6. What pages are included in the dashboard?
Overview, Industry Analysis, Project Analysis, Target Language Analysis, and Monthly Trends.
7. Does it support cost tracking?
Yes, you can track translation costs, total costs, and proofreading costs across multiple views.
8. How often should data be updated?
You should update data weekly or monthly depending on your workload.
9. Is Power BI easy to use for non-technical users?
Yes, the visuals are interactive, clear, and simple to understand.
10. Can the dashboard be customized?
Yes, you can customize charts, add new KPIs, or modify data structure as per your business needs.
Visit our YouTube channel to learn step-by-step video tutorials