Managing transmission line construction projects requires accuracy, speed, coordination, and strict cost control. However, many project teams still depend on scattered spreadsheets, manual reports, and disconnected tracking systems. As a result, project managers struggle to monitor progress, control budgets, and meet deadlines.
Therefore, companies need a centralized, structured, and dynamic performance monitoring tool. The Transmission Line Construction KPI Dashboard in Excel solves this challenge effectively. It allows construction managers, engineers, and executives to track monthly progress, compare actual vs target values, analyze year-to-date trends, and evaluate previous year performance — all within one powerful Excel dashboard.
In this comprehensive guide, you will learn:
-
What a Transmission Line Construction KPI Dashboard in Excel is
-
Why transmission projects require structured KPI tracking
-
Detailed explanation of all 7 worksheets
-
Key benefits and real-world use cases
-
Advantages of Transmission Line Construction KPI Dashboard
-
Best Practices for Transmission Line Construction KPI Dashboard
-
Frequently Asked Questions
Let’s dive in.
Click to Purchases Transmission Line Construction KPI Dashboard in Excel
What Is a Transmission Line Construction KPI Dashboard in Excel?
A Transmission Line Construction KPI Dashboard in Excel is a ready-to-use performance monitoring system designed specifically for power transmission infrastructure projects.
Instead of reviewing multiple progress reports and raw data sheets, project leaders can:
-
Monitor monthly construction progress
-
Compare MTD (Month-To-Date) Actual vs Target
-
Analyze YTD (Year-To-Date) trends
-
Compare performance with previous year
-
Track safety, cost, productivity, and quality KPIs
-
Evaluate KPI definitions and formulas
Consequently, decision-makers gain real-time visibility and can take corrective actions quickly.
Why Do Transmission Line Construction Projects Need KPI Tracking?
Transmission line projects involve:
-
Long distances
-
Multiple contractors
-
High capital investment
-
Strict regulatory requirements
-
Tight project deadlines
Therefore, without structured monitoring, teams face:
-
Budget overruns
-
Delays in tower erection
-
Material shortages
-
Safety incidents
-
Poor productivity
However, when teams use a KPI dashboard, they:
-
Identify delays early
-
Control cost variances
-
Improve contractor performance
-
Reduce safety risks
-
Increase accountability
As a result, projects complete on time and within budget.
What Makes This Dashboard Powerful?
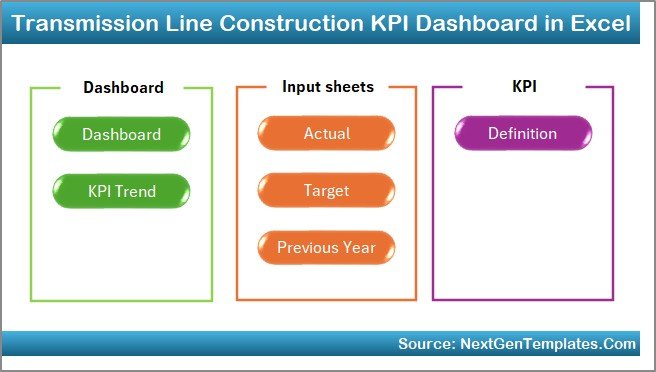
This Transmission Line Construction KPI Dashboard in Excel includes 7 fully structured worksheets designed for complete performance management.
Let’s explore each sheet in detail.
Click to Purchases Transmission Line Construction KPI Dashboard in Excel
1️⃣ Home Sheet – The Control Center
The Home sheet acts as the index page.
Here, you get:
-
6 navigation buttons
-
Direct access to all major sheets
-
Clean and organized layout
Therefore, users can move between sheets instantly without confusion.
This improves usability and saves time.
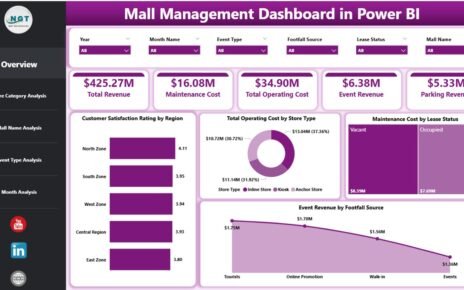
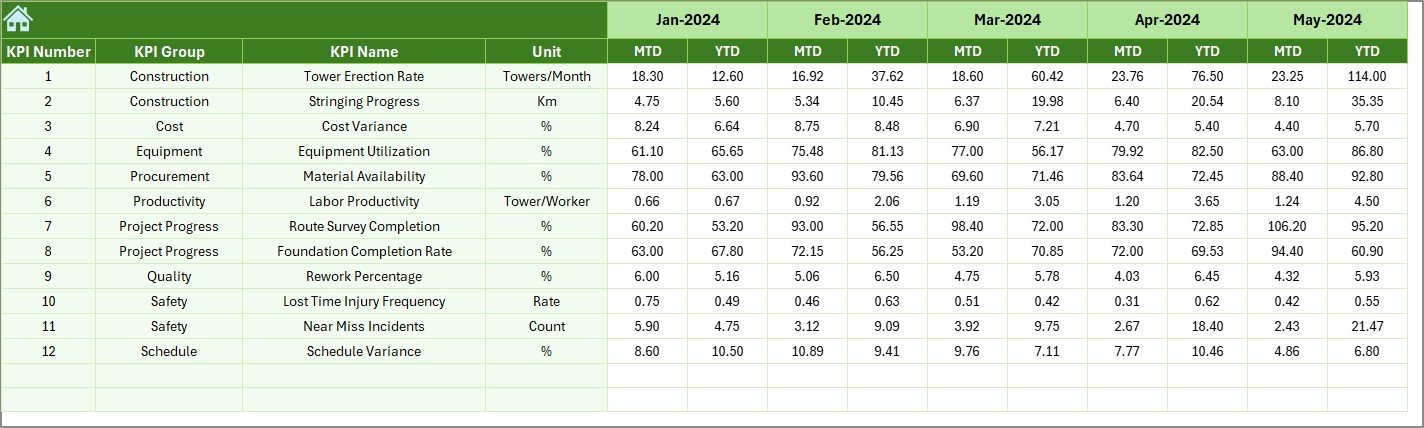
2️⃣ Dashboard Sheet – The Main Performance View
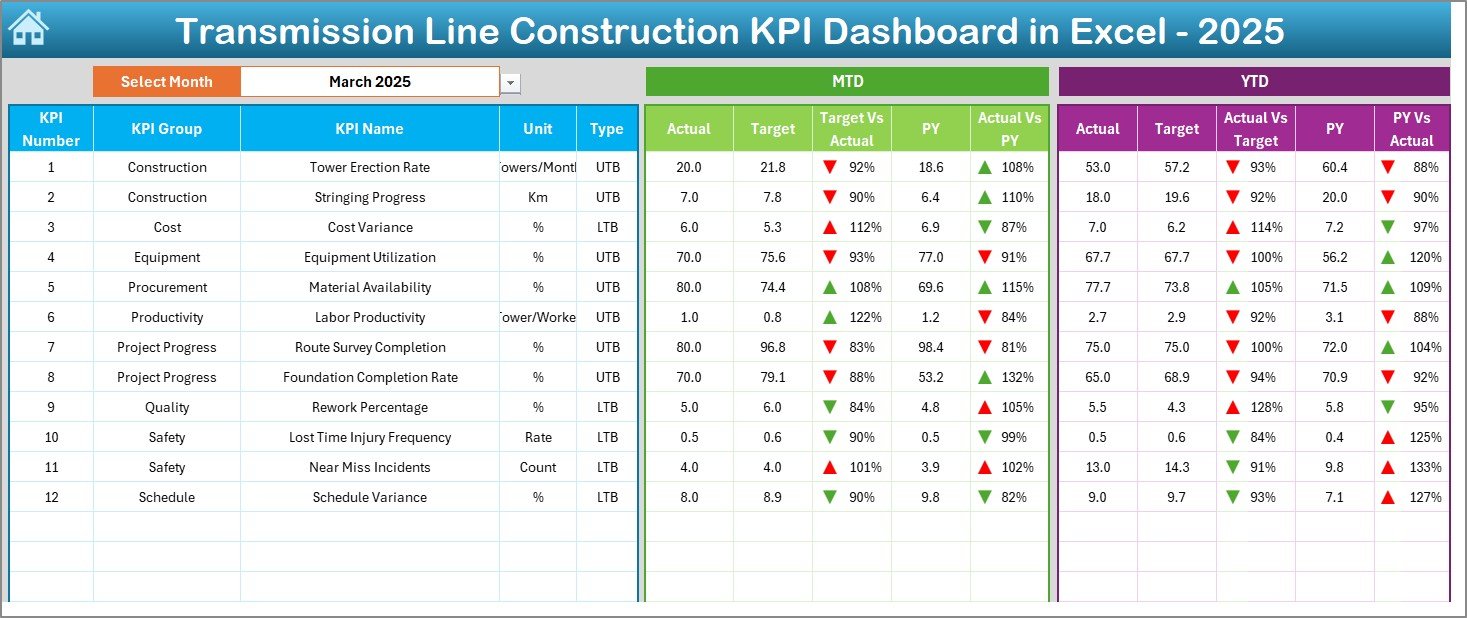
The Dashboard sheet serves as the core reporting page.
On cell D3, you can select the month from a drop-down menu. Once you select a month, the entire dashboard updates automatically.
What Does the Dashboard Display?
It shows:
📊 MTD Performance
-
MTD Actual
-
MTD Target
-
MTD Previous Year
-
Target vs Actual comparison
-
Previous Year vs Actual comparison
-
Conditional formatting arrows (Up / Down indicators)
📈 YTD Performance
-
YTD Actual
-
YTD Target
-
YTD Previous Year
-
Target vs Actual comparison
-
Previous Year vs Actual comparison
-
Conditional formatting indicators
Therefore, managers can instantly identify whether performance improves or declines.
Moreover, visual indicators make analysis faster and easier.
Click to Purchases Transmission Line Construction KPI Dashboard in Excel
3️⃣ KPI Trend Sheet – Deep-Dive Analysis
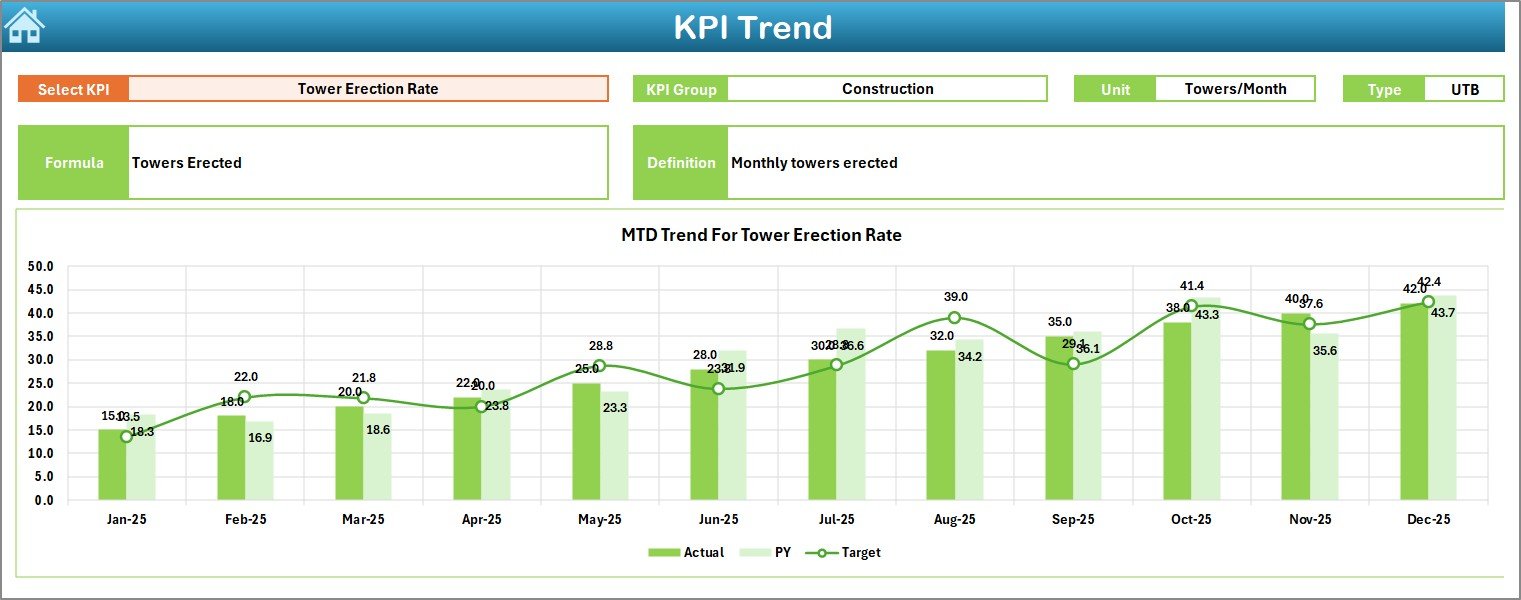
The KPI Trend sheet provides detailed trend analysis.
On cell C3, you can select any KPI from the drop-down list.
After selecting a KPI, the sheet displays:
-
KPI Group
-
Unit of KPI
-
Type (Lower the Better or Upper the Better)
-
Formula
-
KPI Definition
Additionally, it shows:
-
MTD trend chart (Actual, Target, Previous Year)
-
YTD trend chart (Actual, Target, Previous Year)
Therefore, you can analyze historical movement and detect performance patterns.
For example:
-
Tower erection progress
-
Stringing completion rate
-
Safety incident frequency
-
Cost per km
Consequently, managers gain clarity on long-term performance trends.
Click to Purchases Transmission Line Construction KPI Dashboard in Excel
4️⃣ Actual Numbers Input Sheet – Data Entry Section
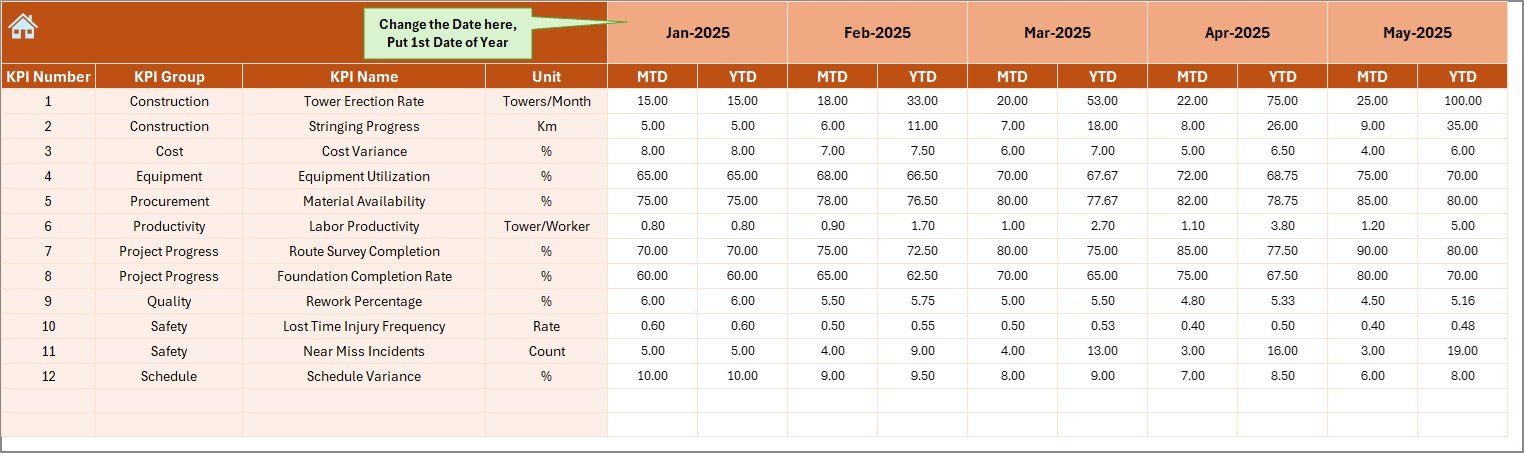
The Actual Numbers Input sheet allows users to enter current performance data.
On cell E1, you select the starting month of the year.
After that, you simply enter:
-
Monthly MTD values
-
Monthly YTD values
Because the dashboard links automatically to this sheet, numbers update instantly.
This structured data entry approach reduces errors and improves consistency.
5️⃣ Target Sheet – Planned Performance Data
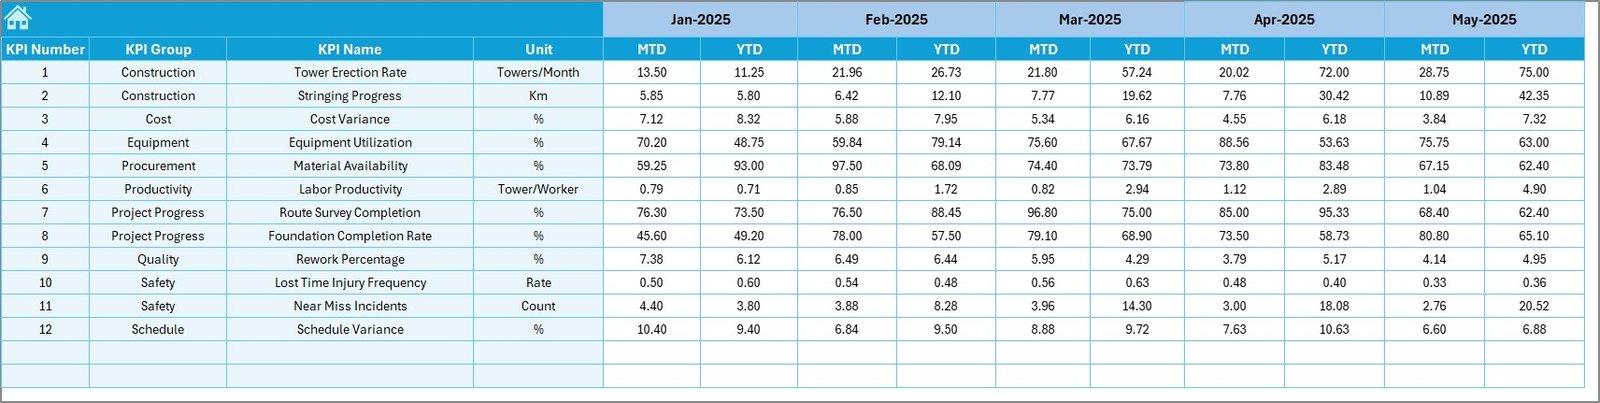
The Target sheet stores monthly target values.
Here, you enter:
-
Monthly MTD targets
-
Monthly YTD targets
Therefore, the dashboard compares actual performance against planned goals.
This allows project teams to measure deviations clearly.
Click to Purchases Transmission Line Construction KPI Dashboard in Excel
6️⃣ Previous Year Number Sheet – Historical Benchmarking
The Previous Year Number sheet stores last year’s performance data.
You enter data exactly as you entered current year numbers.
As a result, the dashboard provides:
-
Year-over-year comparison
-
Historical benchmarking
-
Performance improvement tracking
This helps leadership evaluate long-term growth.
7️⃣ KPI Definition Sheet – Performance Logic Documentation
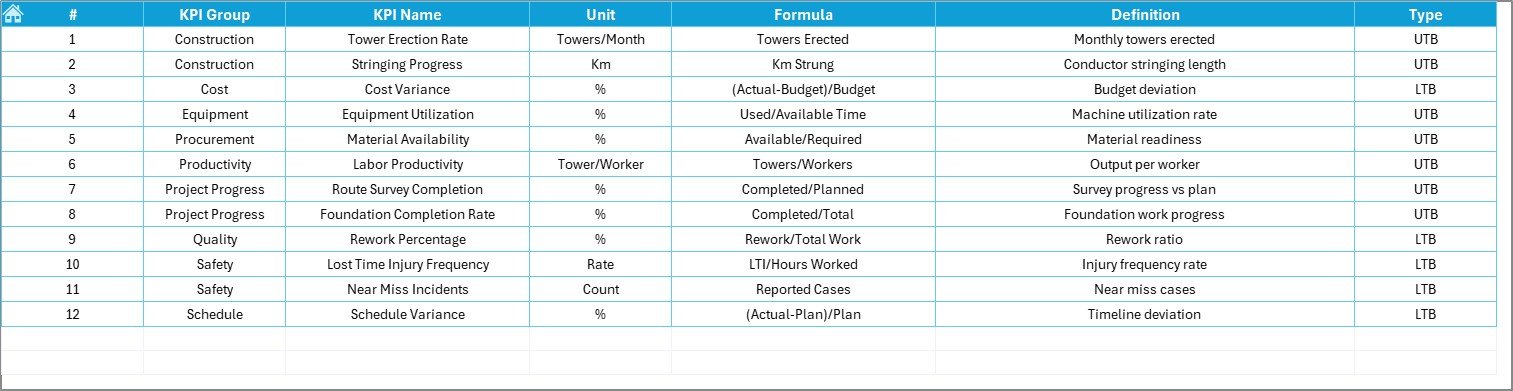
The KPI Definition sheet ensures clarity and transparency.
Here, you define:
-
KPI Name
-
KPI Group
-
Unit
-
Formula
-
KPI Definition
Therefore, everyone understands:
-
How each KPI works
-
What each KPI measures
-
Whether higher or lower values indicate better performance
This eliminates confusion and improves accountability.
Which KPIs Can You Track?
You can track various construction KPIs, such as:
🏗 Project Progress KPIs
-
Towers Installed
-
Foundation Completion Rate
-
Conductor Stringing Progress
-
Right-of-Way Clearance Rate
💰 Financial KPIs
-
Cost per Kilometer
-
Budget Variance %
-
Material Utilization Rate
⚡ Productivity KPIs
-
Crew Productivity Rate
-
Equipment Utilization %
-
Average Installation Time
🦺 Safety KPIs
-
Lost Time Injury Frequency Rate
-
Near Miss Reports
-
Safety Compliance %
Therefore, you gain complete control over operations.
Click to Purchases Transmission Line Construction KPI Dashboard in Excel
Advantages of Transmission Line Construction KPI Dashboard in Excel
Using this dashboard offers multiple benefits.
1️⃣ Improves Decision-Making
Because data updates dynamically, managers can act quickly.
They identify delays early and correct issues immediately.
2️⃣ Enhances Project Control
The dashboard shows target vs actual gaps clearly.
Therefore, project leaders control scope, time, and cost better.
3️⃣ Increases Transparency
Everyone sees the same numbers.
As a result, accountability improves across teams.
4️⃣ Reduces Reporting Time
Instead of preparing manual reports, teams simply update input sheets.
The dashboard handles calculations automatically.
5️⃣ Supports Strategic Planning
Historical comparisons help management plan future projects more effectively.
How Does This Dashboard Improve Transmission Line Projects?
Transmission line construction involves complex logistics.
However, when you implement structured KPI tracking:
-
You monitor milestone completion
-
You track contractor performance
-
You reduce idle equipment time
-
You control cost leakage
-
You improve safety compliance
Consequently, projects move faster and operate more efficiently.
Click to Purchases Transmission Line Construction KPI Dashboard in Excel
Best Practices for Transmission Line Construction KPI Dashboard in Excel
To maximize value, follow these best practices.
✔ Update Data Regularly
Enter actual numbers consistently every month.
Because consistent updates ensure accurate insights.
✔ Define Clear KPI Ownership
Assign responsibility for each KPI.
This increases accountability.
✔ Keep KPI Definitions Clear
Write simple formulas and definitions in the KPI Definition sheet.
Therefore, confusion does not occur.
✔ Review Trends Monthly
Analyze trend charts every month.
Do not wait until year-end.
✔ Focus on Actionable KPIs
Track KPIs that influence project success directly.
Avoid unnecessary metrics.
Who Can Use This Dashboard?
This dashboard benefits:
-
Transmission Project Managers
-
EPC Contractors
-
Utility Companies
-
Infrastructure Developers
-
Site Engineers
-
Construction Controllers
-
Senior Executives
Therefore, it works across all organizational levels.
Why Choose Excel for KPI Tracking?
Excel offers flexibility and accessibility.
Moreover:
-
Most teams already use Excel
-
It requires no complex software
-
It allows easy customization
-
It supports formulas and automation
Therefore, organizations can implement this dashboard quickly without heavy investment.
Click to Purchases Transmission Line Construction KPI Dashboard in Excel
How Does This Dashboard Help in Cost Control?
Cost overruns frequently occur in infrastructure projects.
However, this dashboard helps you:
-
Track budget variance
-
Monitor material consumption
-
Compare planned vs actual spending
-
Identify cost leakage
As a result, financial discipline improves significantly.
How Does It Improve Safety Performance?
Safety remains critical in transmission construction.
Using safety KPIs, you can:
-
Monitor incident rates
-
Track compliance percentages
-
Analyze near-miss trends
-
Improve preventive measures
Therefore, the project environment becomes safer.
How Does It Support Long-Term Growth?
When you compare year-over-year performance:
-
You evaluate productivity growth
-
You measure efficiency improvements
-
You analyze cost reduction strategies
Consequently, you build better strategies for future projects.
Conclusion
Transmission line construction projects demand precision, speed, coordination, and financial discipline. However, manual tracking systems create confusion and delays.
The Transmission Line Construction KPI Dashboard in Excel provides a structured, dynamic, and easy-to-use performance monitoring solution. It combines MTD and YTD tracking, target comparisons, historical benchmarking, and detailed trend analysis in one centralized system.
Because of its organized structure and automation, it saves time, improves accuracy, enhances transparency, and strengthens decision-making.
Therefore, if you want better control over your transmission line construction projects, this dashboard offers the perfect solution.
Click to Purchases Transmission Line Construction KPI Dashboard in Excel
Frequently Asked Questions (FAQs)
1. What is a Transmission Line Construction KPI Dashboard?
It is an Excel-based performance monitoring tool that tracks project KPIs such as progress, cost, productivity, and safety.
2. Can I customize the KPIs?
Yes, you can easily add, modify, or remove KPIs in the KPI Definition sheet.
3. Does the dashboard update automatically?
Yes. When you change the month in cell D3, the dashboard updates automatically.
4. Can I track both MTD and YTD data?
Yes. The dashboard shows both Month-To-Date and Year-To-Date performance comparisons.
5. Is Excel suitable for large transmission projects?
Yes. Excel provides flexibility and strong calculation capabilities for structured KPI tracking.
6. Can I use it for multiple projects?
Yes. You can duplicate the file and maintain separate dashboards for different projects.
7. Do I need advanced Excel skills?
No. Basic Excel knowledge is sufficient to use and update the dashboard.
Click to Purchases Transmission Line Construction KPI Dashboard in Excel
Visit our YouTube channel to learn step-by-step video tutorials