The transportation industry thrives on speed, efficiency, and reliability. However, managing fleets, deliveries, costs, and performance across multiple locations can be overwhelming without a centralized system. That’s where the Transportation Services KPI Dashboard in Power BI makes a difference.
This ready-to-use dashboard allows logistics managers, transport operators, and supply chain leaders to track key performance indicators (KPIs) in real time. With interactive visuals, detailed analytics, and data-driven insights, it helps you identify performance gaps and make smarter operational decisions.
Click to Purchases Transportation Services KPI Dashboard in Power BI
🎯 What Is a Transportation Services KPI Dashboard in Power BI?
A Transportation Services KPI Dashboard in Power BI is a dynamic, visual tool that consolidates transportation performance data into an easy-to-analyze format.
It connects to an Excel data source containing Actual, Target, and Previous Year numbers to provide meaningful visuals for MTD (Month-to-Date) and YTD (Year-to-Date) comparisons.
This dashboard enables businesses to measure performance against goals, spot efficiency gaps, and evaluate whether the fleet, delivery, or cost metrics are improving or declining.
🧩 Structure of the Dashboard
This Power BI file includes three powerful pages and integrates seamlessly with an Excel-based data source. Each page focuses on a unique aspect of transportation performance tracking.
1️⃣ Summary Page — The Control Center
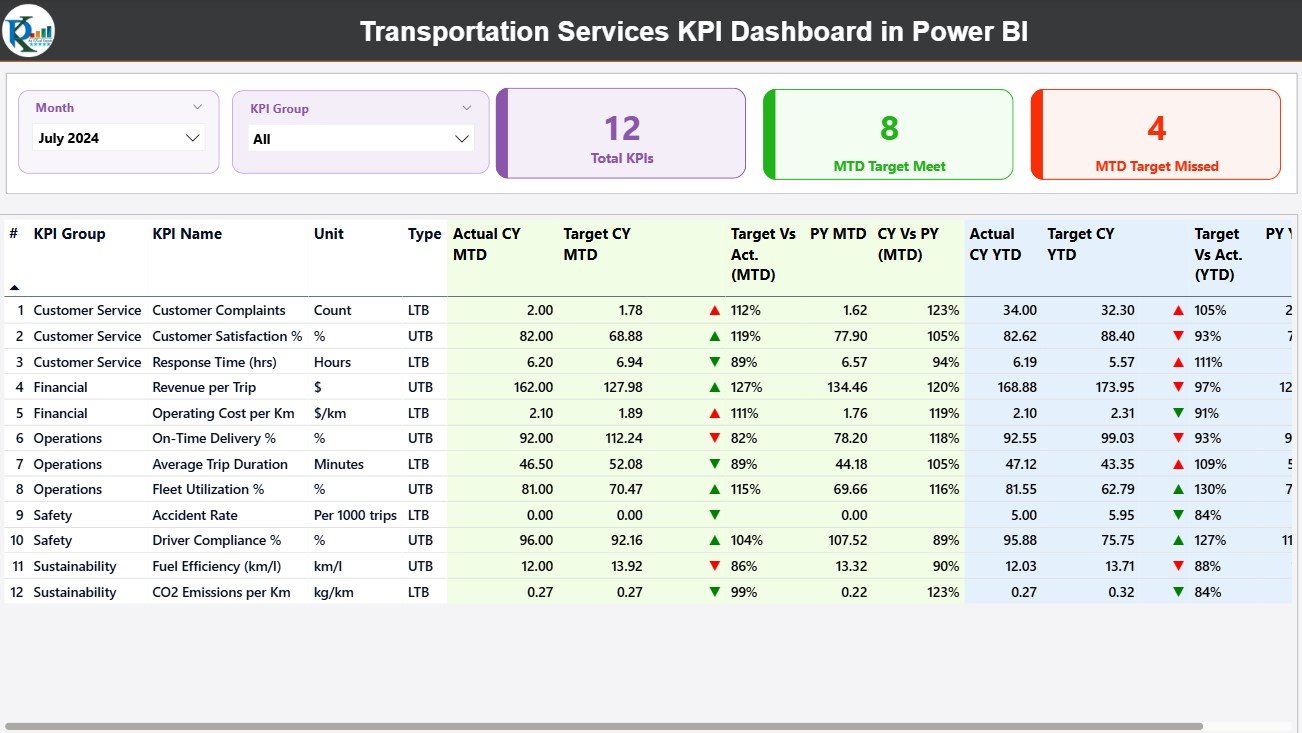
The Summary Page is the primary view of the dashboard. It provides high-level visibility into all KPIs with interactive slicers and real-time metrics.
Key Features:
-
🧭 Slicers for Month and KPI Group:
Filter results by month or KPI category to focus your analysis. -
🔢 KPI Cards:
View Total KPI Count, MTD Target Met, and MTD Target Missed instantly. -
📊 Detailed KPI Table:
A comprehensive table displaying:-
KPI Number — unique identifier.
-
KPI Group — department or functional area.
-
KPI Name — specific metric (e.g., On-time Delivery %, Fuel Efficiency).
-
Unit — measurement unit (e.g., %, liters, USD).
-
Type — LTB (Lower the Better) or UTB (Upper the Better).
-
Actual CY MTD / YTD — current year performance values.
-
Target CY MTD / YTD — benchmarks for current year.
-
MTD and YTD Icons — colored ▲▼ arrows showing status.
-
Target vs Actual (%) — quick view of performance ratio.
-
PY MTD / YTD — previous year’s comparison values.
-
CY vs PY (%) — growth or decline vs last year.
-
This layout gives a complete 360° overview of how transportation services are performing at any point in time.
2️⃣ KPI Trend Page — Visualize Trends Over Time
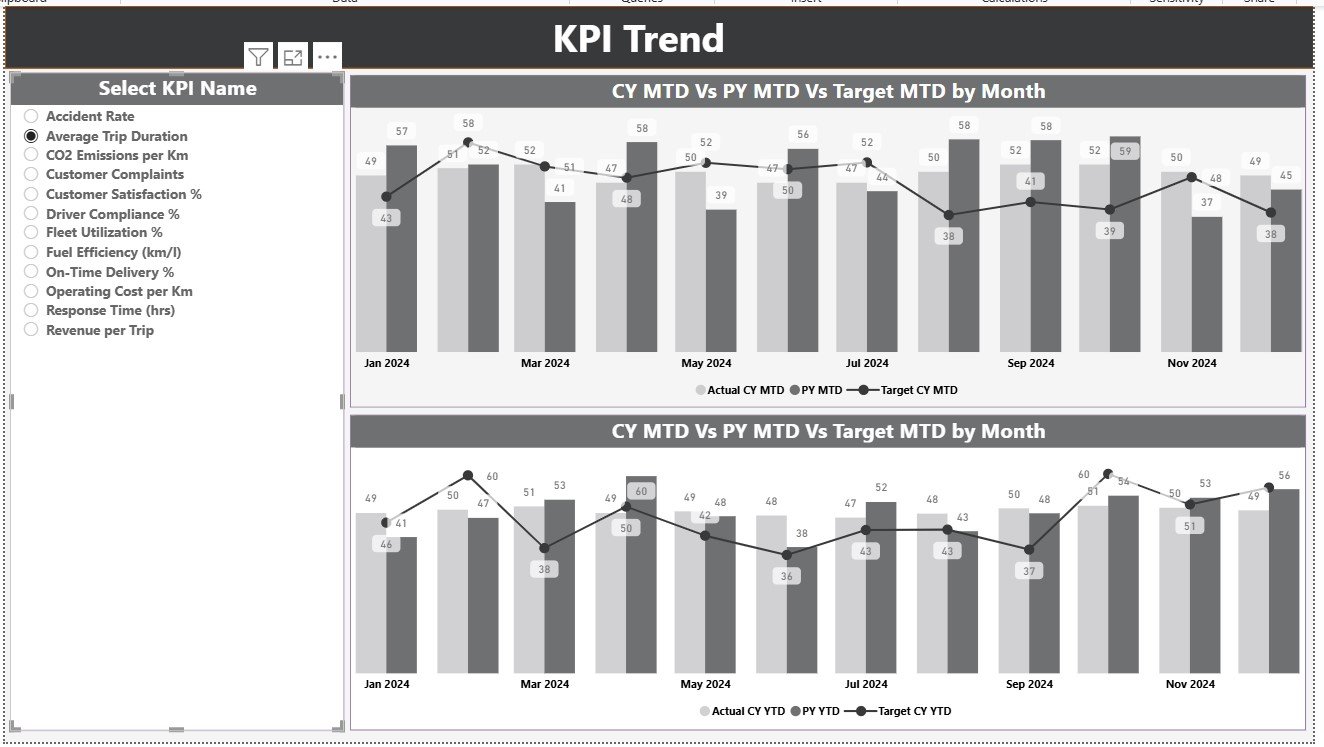
The KPI Trend Page provides visual storytelling through dual combo charts.
Key Features:
-
📈 MTD and YTD Combo Charts: Compare Actuals, Targets, and Previous Year data side by side.
-
🔍 Interactive KPI Selector: Choose a KPI from the left-side slicer to update charts dynamically.
-
🔄 Historical Comparison: Analyze seasonality or performance improvements over months.
This helps transport managers identify which areas (fuel, maintenance, delivery timing, etc.) are improving and which need intervention.
3️⃣ KPI Definition Page — Deep Dive Into Metrics
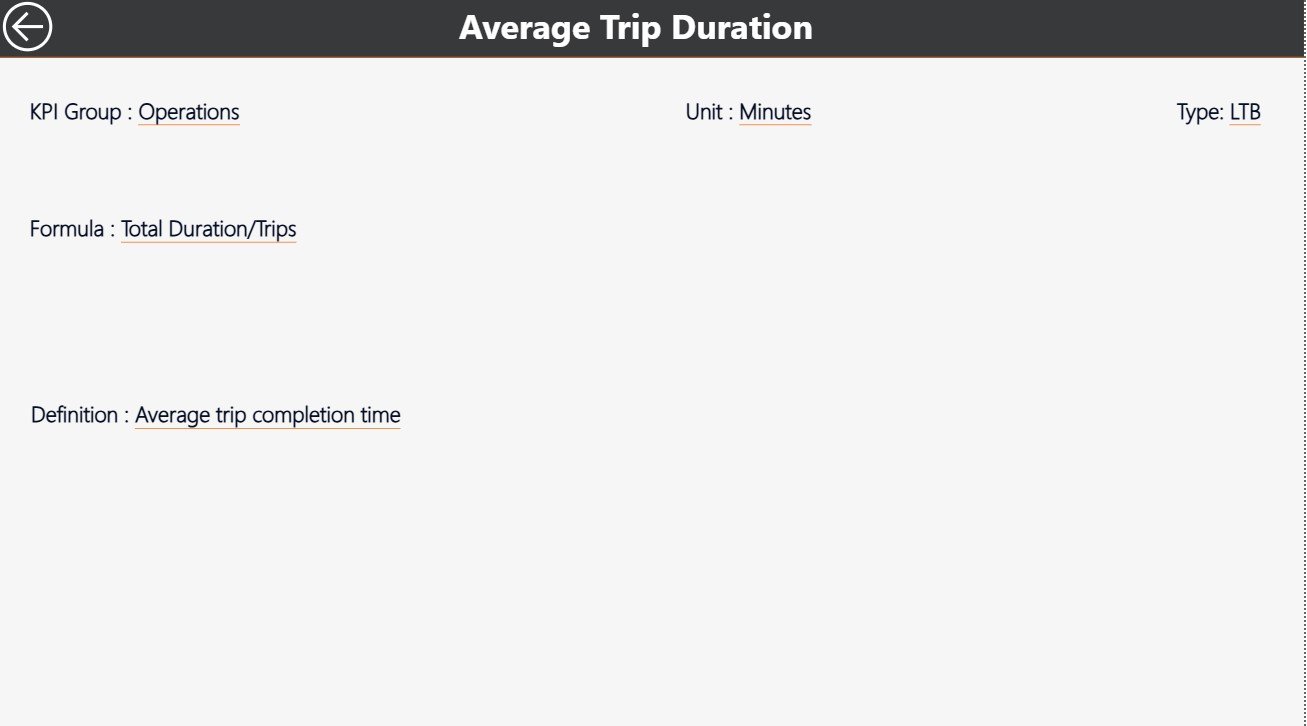
The KPI Definition Page (hidden by default) is a drill-through page accessible from the Summary Page.
Key Features:
-
Displays Formula and KPI Definition for the selected metric.
-
Provides clarity on how each KPI is calculated and why it matters.
-
A Back Button at the top left corner allows returning to the main page.
This ensures all team members interpret KPIs consistently and correctly.
📂 Excel Data Source Structure
The dashboard pulls data from an Excel workbook with three structured worksheets.
1️⃣ Input_Actual Sheet
-
Enter the Actual numbers for each KPI.
-
Include columns for KPI Name, Month (first date of the month), MTD, and YTD numbers.
2️⃣ Input_Target Sheet
-
Enter Target values using the same structure as the Actual sheet.
-
Ensure month and KPI names match exactly for accurate mapping.
3️⃣ KPI Definition Sheet
-
Fill in KPI Number, KPI Group, KPI Name, Unit, Formula, Definition, and Type (LTB/UTB).
This Excel structure provides the backbone of your Power BI dashboard. Once updated, the Power BI visuals refresh automatically.
Click to Purchases Transportation Services KPI Dashboard in Power BI
🚚 Why Transportation Businesses Need KPI Dashboards
Without proper visualization, transportation data stays buried in spreadsheets. A Power BI dashboard brings it to life.
Here’s why it matters:
-
📊 Consolidated Data View: Merge cost, route, and delivery data in one place.
-
⚡ Real-Time Insights: View MTD/YTD trends to take timely actions.
-
🎯 Goal Alignment: Monitor performance against set targets.
-
💡 Informed Decision-Making: Identify improvement areas faster.
-
💰 Cost Optimization: Detect inefficiencies and reduce expenses.
The result? Streamlined operations, reduced costs, and improved delivery performance.
⚙️ Advantages of Transportation Services KPI Dashboard in Power BI
-
✅ Interactive Interface: View and analyze data with dynamic filters.
-
🧮 Automatic Calculations: KPIs like Target vs Actual % and CY vs PY % update instantly.
-
🌍 Scalable Design: Works for local fleets or global logistics networks.
-
🧭 Drill-Through Capability: Dive deep into KPI definitions from summary data.
-
🧠 Data Accuracy: Linked Excel sheets eliminate manual errors.
-
💬 Visual Storytelling: Clear visuals make performance communication easier.
This dashboard saves time and enhances operational clarity, allowing managers to focus on improving results rather than preparing reports.
Click to Purchases Transportation Services KPI Dashboard in Power BI
💡 Best Practices for Using the Transportation KPI Dashboard
To get the most out of this Power BI dashboard, follow these best practices:
-
Keep Data Updated: Refresh Excel data regularly to maintain accuracy.
-
Define KPIs Clearly: Use the KPI Definition sheet as your standard reference.
-
Review MTD and YTD Trends Monthly: Identify seasonal or operational shifts.
-
Set Realistic Targets: Align targets with achievable goals to motivate teams.
-
Use Visual Indicators: Maintain consistency (green = met, red = missed).
-
Automate Refresh Schedule: Enable Power BI’s scheduled refresh feature.
-
Collaborate Across Teams: Allow logistics, finance, and operations departments to access insights.
-
Drill-Down Often: Use drill-through pages to understand why performance fluctuates.
Following these steps ensures your dashboard remains both accurate and insightful.
📊 Example: How It Helps in Real Scenarios
Imagine you’re managing a fleet of 200 trucks across multiple routes.
-
In February, the Fuel Efficiency KPI shows only 6.5 km/l compared to the Target of 7.5 km/l.
-
The dashboard displays a red ▼ icon under MTD Icon.
-
By drilling through, you identify high idling times on certain routes.
-
Adjusting schedules improves March performance to 7.4 km/l.
With just a few clicks, the dashboard helped you pinpoint a cost issue, analyze the cause, and implement a solution.
📈 Types of Analyses You Can Perform
This Power BI dashboard allows multiple analytical views:
-
Target vs Actual Analysis: Identify which KPIs are underperforming.
-
Year-Over-Year Comparison: Track growth or decline across fiscal years.
-
Trend Analysis: Visualize MTD and YTD performance curves.
-
Efficiency Analysis: Examine cost per delivery, vehicle uptime, or idle hours.
-
Predictive Insight: Use past trends to forecast future KPIs.
💬 Common Mistakes to Avoid
While using this dashboard, avoid these common errors:
❌ Forgetting to refresh the Excel data source.
❌ Mislabeling KPI names between Actual and Target sheets.
❌ Ignoring unit consistency (e.g., USD vs INR).
❌ Overloading visuals — simplicity communicates better.
❌ Skipping monthly reviews — missing early warning signs.
Avoiding these ensures that your dashboard remains efficient and insightful.
🚛 Who Can Benefit from This Dashboard?
This dashboard is ideal for:
-
Fleet Managers: Track vehicle usage and fuel performance.
-
Operations Heads: Monitor delivery timeliness and breakdowns.
-
Finance Teams: Evaluate transport costs and budget variances.
-
Logistics Coordinators: Ensure routes and schedules stay efficient.
-
Executives: Gain a summarized view of overall transportation performance.
Whether you manage a courier company, trucking business, or large distribution network — this Power BI dashboard adapts to your needs.
🧭 Implementation Steps
-
Prepare the Excel Data: Fill in Actual, Target, and KPI Definition sheets.
-
Load Data into Power BI: Connect and import your Excel workbook.
-
Refresh Data Model: Ensure data types and relationships are accurate.
-
Customize Dashboard Colors: Match visuals with your company branding.
-
Publish and Share: Upload to Power BI Service for team access.
-
Schedule Automatic Refresh: Keep reports updated daily or weekly.
🏁 Conclusion — Streamline Your Transport Operations with Power BI
The Transportation Services KPI Dashboard in Power BI transforms how transport and logistics companies track and manage performance.
It replaces static reports with interactive visuals, offering real-time insights into operations, costs, and efficiency.
With clear visuals, automated comparisons, and seamless Excel integration, it empowers managers to take timely, data-driven decisions — leading to cost savings, improved reliability, and satisfied clients.
If your business depends on smooth logistics, this dashboard is your roadmap to smarter transportation management.
Click to Purchases Transportation Services KPI Dashboard in Power BI
❓ Frequently Asked Questions (FAQs)
1️⃣ What is a Transportation Services KPI Dashboard in Power BI?
It’s an interactive Power BI dashboard designed to track KPIs like delivery efficiency, cost control, and fleet utilization.
2️⃣ What data source does it use?
It connects to an Excel file with three sheets — Actual, Target, and KPI Definition.
3️⃣ How many pages does the dashboard have?
There are three pages: Summary, KPI Trend, and KPI Definition.
4️⃣ What are MTD and YTD in this dashboard?
MTD (Month-to-Date) and YTD (Year-to-Date) show performance for the current month and the year so far.
5️⃣ Who can use this dashboard?
Fleet managers, logistics teams, operations heads, and executives can all benefit from it.
6️⃣ Can I customize the KPIs?
Yes, simply update the KPI Definition sheet and refresh Power BI to see changes.
7️⃣ Does the dashboard support drill-through?
Yes, you can click on any KPI in the Summary page to view detailed definitions.
8️⃣ Is it beginner-friendly?
Absolutely. Even users new to Power BI can easily navigate it.
Click to Purchases Transportation Services KPI Dashboard in Power BI
Visit our YouTube channel to learn step-by-step video tutorials


