Travel agencies operate in a dynamic and highly competitive market. They manage bookings, destinations, agents, commissions, customer satisfaction, and revenue targets every single day. However, when agencies rely on static Excel reports or manual summaries, performance visibility drops and decision-making slows down.
That is exactly why a Travel Agencies KPI Dashboard in Power BI becomes a game-changing analytics solution.
In this in-depth blog post, you will learn what a Travel Agencies KPI Dashboard in Power BI is, why travel agencies need it, how it works, its page-wise structure, Excel data setup, key features, advantages, best practices, and frequently asked questions. By the end of this article, you will clearly understand how this ready-to-use Power BI dashboard helps travel agencies monitor KPIs and improve business performance.
Click to Purchases Travel Agencies KPI Dashboard in Power BI
What Is a Travel Agencies KPI Dashboard in Power BI?
A Travel Agencies KPI Dashboard in Power BI is an interactive business intelligence solution designed to track, analyze, and visualize key performance indicators for travel agencies.
Instead of reviewing multiple reports, managers use one centralized Power BI dashboard to monitor:
-
Sales and booking performance
-
Target achievement
-
Year-over-year growth
-
KPI trends
-
Operational efficiency
Because Power BI supports slicers, drill-through, conditional formatting, and dynamic visuals, this dashboard delivers real-time insights with minimal manual effort.
As a result, travel agencies move from reactive reporting to proactive decision-making.
Why Do Travel Agencies Need a KPI Dashboard in Power BI?
Travel agencies deal with large volumes of data across months, KPIs, and business units. Therefore, manual analysis often hides critical insights.
A Travel Agencies KPI Dashboard in Power BI helps because it:
-
Centralizes KPI monitoring
-
Compares Actual vs Target instantly
-
Highlights performance gaps visually
-
Tracks MTD and YTD progress
-
Supports data-driven strategy
Moreover, Power BI offers scalability and automation, which makes it ideal for growing travel businesses.
How Does the Travel Agencies KPI Dashboard in Power BI Work?
The dashboard uses Excel as the data source and Power BI as the visualization layer.
Here is how the workflow works:
-
Enter KPI data in structured Excel sheets
-
Load Excel data into Power BI
-
Apply relationships and measures
-
Select Month and KPI Group using slicers
-
Review MTD and YTD performance
-
Analyze trends and drill-through details
Because Power BI refreshes data quickly, users always see updated performance.
Click to Purchases Travel Agencies KPI Dashboard in Power BI
What Are the Key Features of the Travel Agencies KPI Dashboard in Power BI?
This ready-to-use Power BI dashboard includes several powerful features designed for travel agency analytics.
Key Highlights
-
Interactive slicers
-
KPI summary cards
-
MTD and YTD performance tracking
-
Target vs Actual analysis
-
Previous Year comparison
-
Conditional formatting icons
-
Drill-through KPI details
Each feature works together to provide a complete performance monitoring experience.
What Pages Are Included in the Travel Agencies KPI Dashboard?
This Power BI dashboard includes three well-structured pages, each serving a specific analytical purpose.
Click to Purchases Travel Agencies KPI Dashboard in Power BI
1. What Is the Summary Page and Why Is It Important?
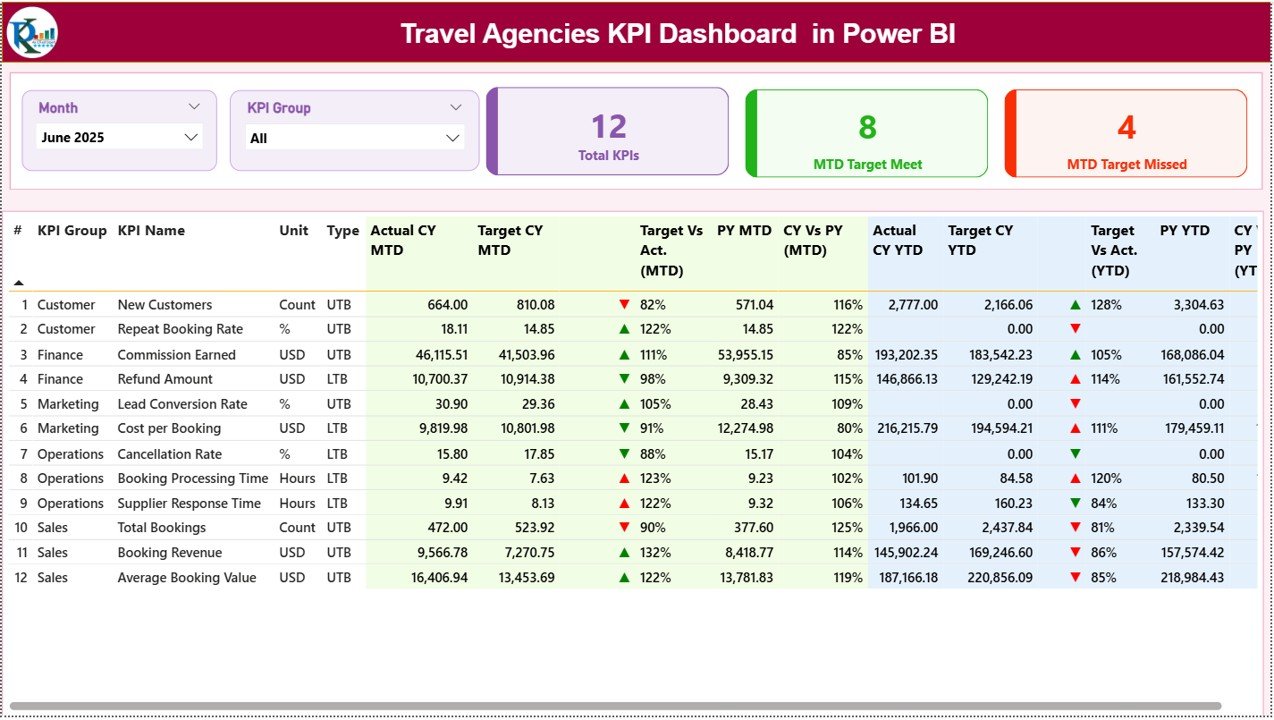
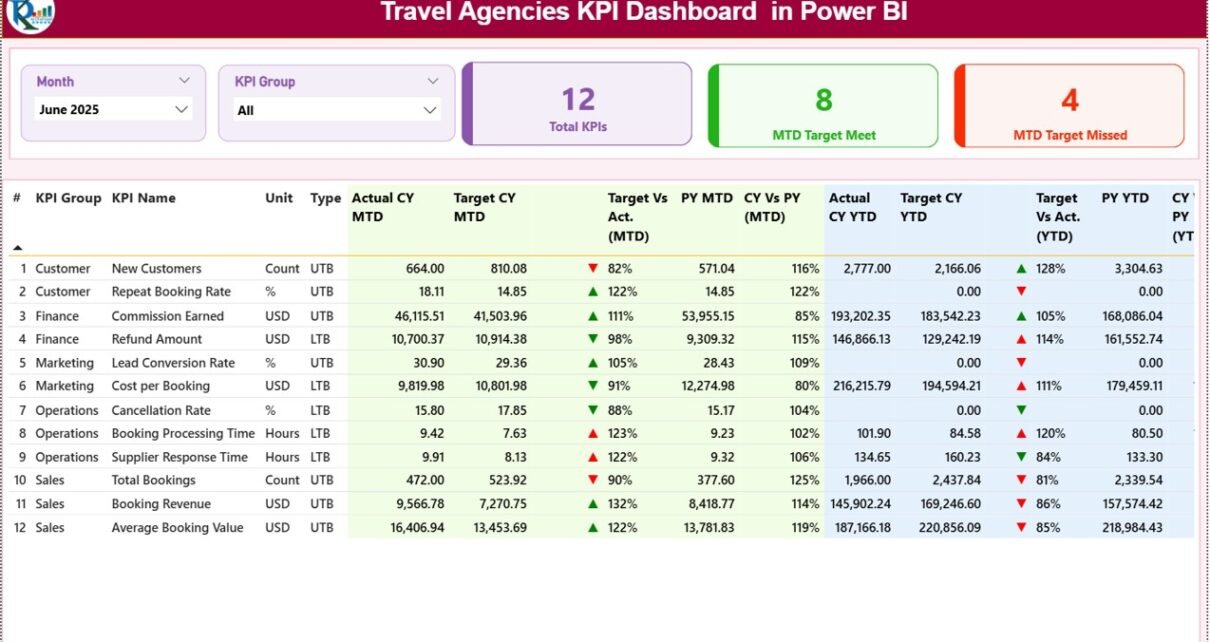
The Summary Page is the main page of the Travel Agencies KPI Dashboard in Power BI.
Slicers Available on the Summary Page
At the top of the page, users can filter data using:
-
Month slicer
-
KPI Group slicer
As soon as users change a slicer selection, all visuals update automatically.
KPI Summary Cards
The Summary Page displays three KPI cards:
-
Total KPIs Count
-
MTD Target Meet Count
-
MTD Target Missed Count
These cards provide an instant overview of performance health.
What Information Does the KPI Detail Table Show?
Below the cards, the Summary Page displays a detailed KPI table with comprehensive metrics.
Columns Explained
-
KPI Number – Unique sequence number
-
KPI Group – Category of KPI
-
KPI Name – KPI title
-
Unit – Measurement unit
-
Type – LTB or UTB
MTD Performance Metrics
-
Actual CY MTD – Current year MTD actual value
-
Target CY MTD – Current year MTD target
-
MTD Icon – ▲ or ▼ icons with green/red color
-
Target vs Actual (MTD) – Actual ÷ Target (%)
-
PY MTD – Previous year MTD value
-
CY vs PY (MTD) – CY MTD ÷ PY MTD (%)
Because of icons and percentages, users can instantly spot performance issues.
YTD Performance Metrics
-
Actual CY YTD – Current year YTD actual
-
Target CY YTD – Current year YTD target
-
YTD Icon – ▲ or ▼ icons with green/red color
-
Target vs Actual (YTD) – Actual ÷ Target (%)
-
PY YTD – Previous year YTD value
-
CY vs PY (YTD) – CY YTD ÷ PY YTD (%)
This structure ensures complete visibility across short-term and long-term performance.
Click to Purchases Travel Agencies KPI Dashboard in Power BI
2. What Is the KPI Trend Page and How Does It Help?
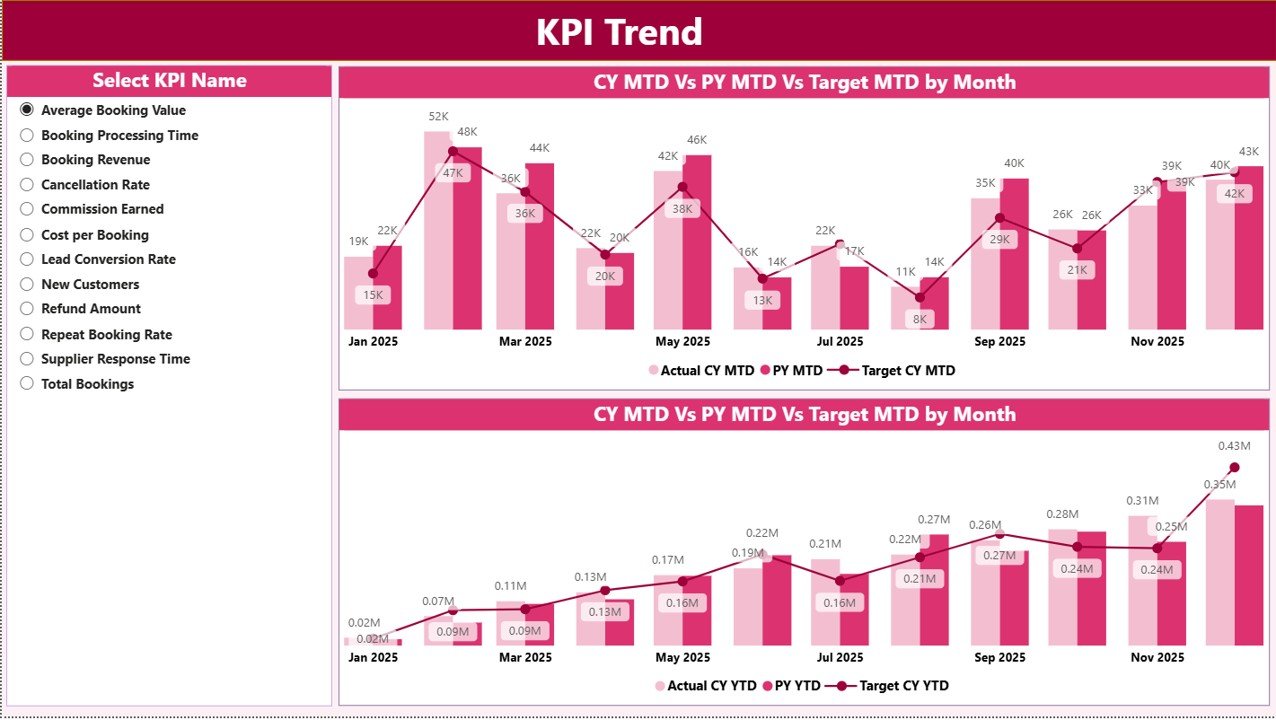
The KPI Trend Page focuses on time-based performance analysis.
Visuals Used on KPI Trend Page
This page includes two combo charts:
-
MTD Trend Chart
-
YTD Trend Chart
Each chart displays:
-
Current Year Actual
-
Previous Year Actual
-
Target values
KPI Selection Slicer
On the left side, users select the KPI Name using a slicer. As soon as the selection changes, both trend charts update dynamically.
Because of this setup, users analyze each KPI deeply without clutter.
Click to Purchases Travel Agencies KPI Dashboard in Power BI
3. What Is the KPI Definition Page and Why Is It Hidden?
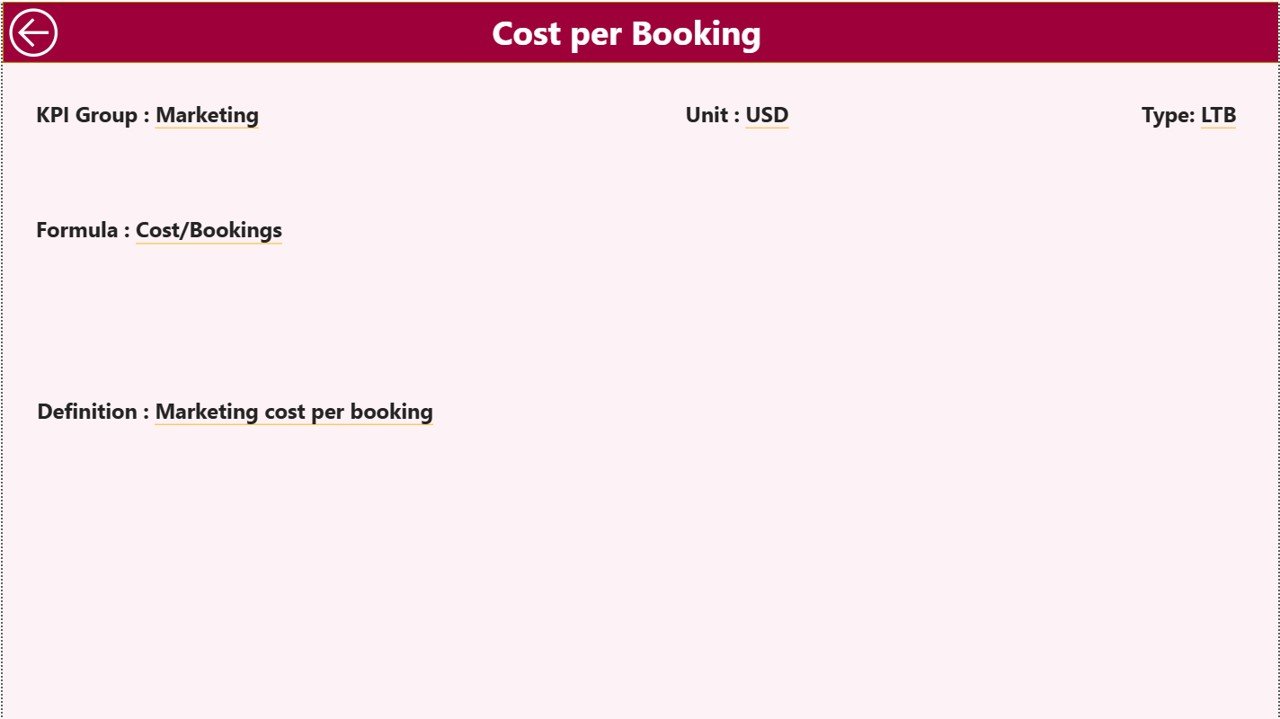
The KPI Definition Page acts as a drill-through page.
Purpose of the KPI Definition Page
This page displays:
-
KPI Formula
-
KPI Definition
-
KPI context and meaning
Because users access this page only when needed, the dashboard keeps it hidden by default.
How Does Drill-Through Work?
From the Summary Page:
-
Right-click on a KPI
-
Select Drill-Through
-
Navigate to KPI Definition Page
A Back button on the top-left corner allows users to return to the Summary Page easily.
What Excel Data Is Used in This Power BI Dashboard?
The dashboard uses Excel as the data source, which makes data entry simple and flexible.
1. Input_Actual Sheet Tab
This sheet captures actual KPI performance.
Columns Captured
-
KPI Name
-
Month (first date of the month)
-
MTD value
-
YTD value
Users simply enter actual numbers for each KPI and month.
2. Input_Target Sheet Tab
This sheet captures target values.
Columns Captured
-
KPI Name
-
Month
-
MTD target
-
YTD target
Targets drive variance calculations and KPI status indicators.
3. KPI Definition Sheet Tab
This sheet defines each KPI clearly.
Columns Included
-
KPI Number
-
KPI Group
-
KPI Name
-
Unit
-
Formula
-
Definition
-
Type (LTB or UTB)
Because definitions stay centralized, KPI interpretation remains consistent.
Click to Purchases Travel Agencies KPI Dashboard in Power BI
What Types of KPIs Can Travel Agencies Track?
This dashboard supports KPIs such as:
-
Total bookings
-
Revenue growth
-
Conversion rate
-
Average booking value
-
Cancellation rate
-
Agent productivity
-
Customer retention
Therefore, agencies can customize KPIs based on business goals.
How Does This Dashboard Improve Decision-Making?
This dashboard improves decision-making because it:
-
Shows performance gaps instantly
-
Tracks trends visually
-
Compares targets and history
-
Supports drill-down analysis
As a result, leadership teams act faster and smarter.
Click to Purchases Travel Agencies KPI Dashboard in Power BI
Advantages of Travel Agencies KPI Dashboard in Power BI
Using a Travel Agencies KPI Dashboard in Power BI offers several advantages.
✔ Centralized KPI Monitoring
All KPIs stay in one interactive dashboard.
✔ Real-Time Insights
Power BI refreshes data quickly.
✔ Visual Performance Indicators
Icons and colors simplify analysis.
✔ MTD and YTD Visibility
Users track short-term and long-term performance.
✔ Year-Over-Year Comparison
Previous year analysis highlights growth trends.
✔ Scalable Analytics
Power BI supports future expansion.
✔ Professional Reporting
The dashboard improves management reporting quality.
Best Practices for the Travel Agencies KPI Dashboard in Power BI
To get maximum value, follow these best practices.
📌 Define KPIs Clearly
Maintain accurate definitions in the KPI Definition sheet.
📌 Enter Data Consistently
Use the first date of each month for consistency.
📌 Review KPIs Monthly
Regular reviews prevent surprises.
📌 Focus on Trends
Look beyond single-month numbers.
📌 Validate Targets Regularly
Align targets with business strategy.
📌 Use Drill-Through for Details
Analyze root causes using KPI Definition page.
Who Should Use This Power BI Dashboard?
This dashboard suits:
-
Travel agency owners
-
Sales managers
-
Operations leaders
-
Finance teams
-
Regional heads
Both small and growing agencies can benefit from it.
Click to Purchases Travel Agencies KPI Dashboard in Power BI
Conclusion: Why Should You Use a Travel Agencies KPI Dashboard in Power BI?
A Travel Agencies KPI Dashboard in Power BI delivers a structured, visual, and powerful way to monitor business performance. Because it combines KPI tracking, trend analysis, targets, and drill-through insights, it transforms raw data into actionable intelligence.
Moreover, its ready-to-use design ensures quick implementation with Excel as the data source. If your goal involves improving transparency, accountability, and strategic decision-making, this Power BI dashboard becomes an essential analytics solution.
Frequently Asked Questions (FAQs)
1. What is a Travel Agencies KPI Dashboard in Power BI?
It is an interactive Power BI dashboard used to monitor travel agency KPIs.
2. Does the dashboard support MTD and YTD analysis?
Yes, it shows both MTD and YTD metrics.
3. Can I filter KPIs by month?
Yes, the Month slicer allows dynamic filtering.
4. Does the dashboard compare previous year data?
Yes, it includes CY vs PY comparisons.
5. Can I customize KPIs?
Yes, KPIs can be modified using the Excel source file.
6. Is this dashboard suitable for small agencies?
Yes, both small and mid-sized agencies can use it effectively.
7. Does it require advanced Power BI skills?
No, basic Power BI knowledge is sufficient.
8. Can this dashboard replace manual reports?
Yes, it significantly reduces manual reporting effort.
Click to Purchases Travel Agencies KPI Dashboard in Power BI
Visit our YouTube channel to learn step-by-step video tutorials