Urban development never slows down. Cities expand every year. Roads stretch further. Bridges rise higher. Utilities grow stronger. Meanwhile, project budgets increase, deadlines tighten, and stakeholders demand complete transparency.
So, how can city planners, infrastructure companies, and government authorities track labor cost, equipment cost, material expenses, regional performance, and project completion in one place?
The answer is simple.
You need an Urban Infrastructure Dashboard in Power BI.
Click to Purchases Urban Infrastructure Dashboard in Power BI
This powerful, interactive dashboard transforms raw infrastructure data into clear visuals. As a result, decision-makers understand project status instantly. Moreover, they compare budget vs actual costs, analyze region-wise performance, and identify cost overruns before they grow.
In this detailed guide, you will learn:
What an Urban Infrastructure Dashboard in Power BI is
Why infrastructure monitoring needs smart analytics
Complete explanation of all 5 dashboard pages
Advantages of using this dashboard
Best practices for implementation
Frequently Asked Questions
Let us explore everything step by step.
What Is an Urban Infrastructure Dashboard in Power BI?
An Urban Infrastructure Dashboard in Power BI is an interactive reporting solution that tracks city development projects using real-time data.
Instead of managing scattered Excel sheets, you can:
Monitor project completion percentage
Track labor, equipment, and material costs
Compare budget vs actual spending
Analyze city-wise and region-wise performance
Identify delays early
Because Power BI provides slicers, drill-down options, and dynamic visuals, users can filter data instantly. Therefore, leadership teams make faster and smarter decisions.
Why Do Urban Infrastructure Projects Need a Dashboard?
Urban projects involve multiple moving parts. For example:
Roads
Highways
Bridges
Water systems
Electrical grids
Public transport
Each project includes labor teams, equipment usage, and material consumption. However, without centralized reporting, managers struggle to answer basic questions:
Which city exceeded the budget?
Which region shows high labor cost?
Which infrastructure type consumes maximum material?
Are projects on track this month?
Therefore, an Urban Infrastructure Dashboard in Power BI becomes essential. It brings clarity, control, and accountability.
Detailed Explanation of the 5 Dashboard Pages
The Urban Infrastructure Dashboard in Power BI contains five powerful analytical pages. Each page focuses on a specific dimension of infrastructure management.
1️⃣ Overview Page – How Is the Overall Infrastructure Performance?
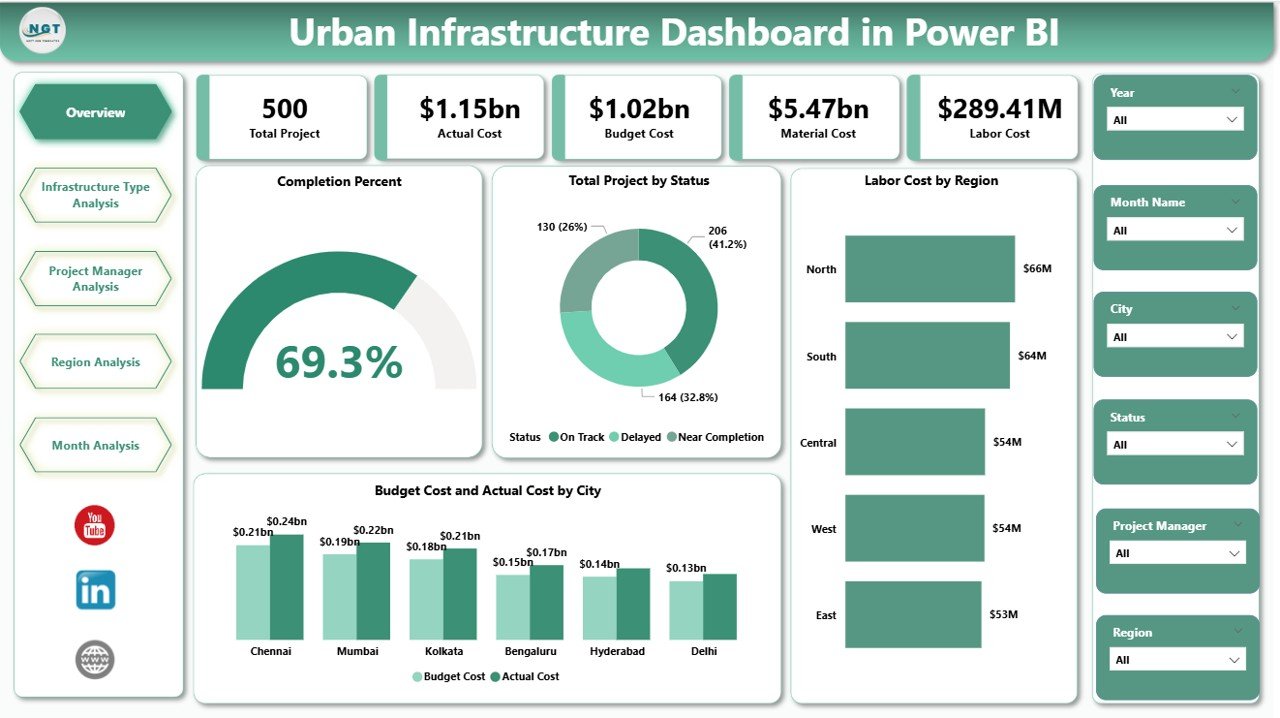
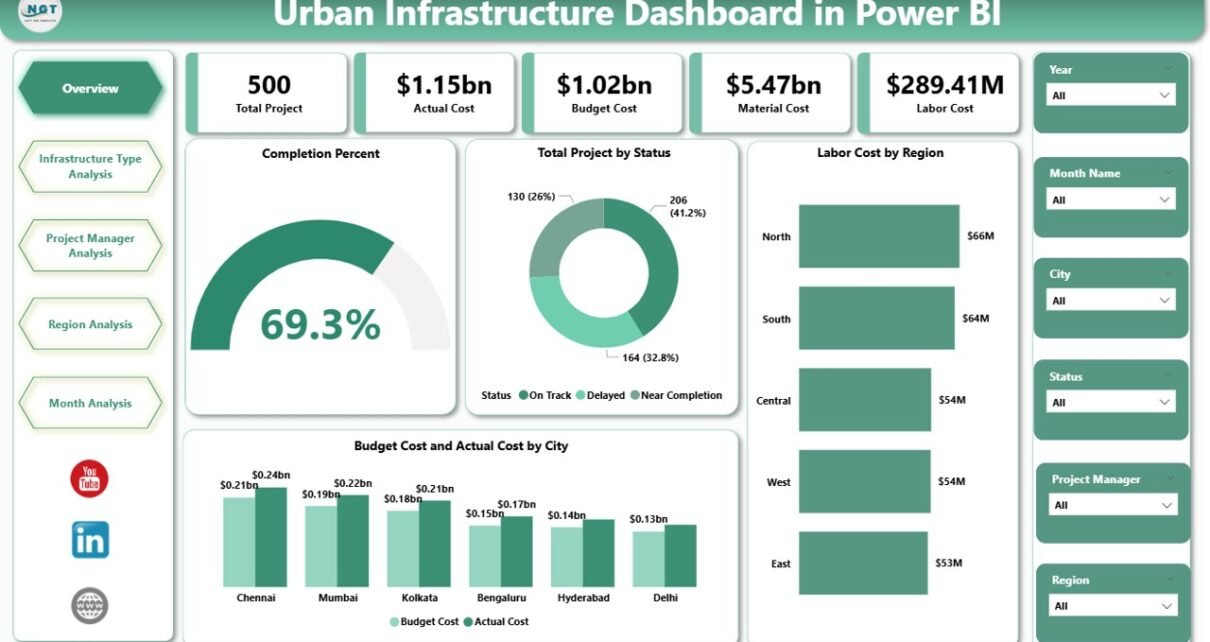
The Overview Page acts as the command center of the dashboard.
Key Features on the Overview Page
You will see:
Completion Percent Card
Total Projects by Status Card
Labor Cost by Region Chart
Budget Cost vs Actual Cost by City Chart
Dynamic slicers for filtering data
Why Is This Page Important?
First, the Completion Percent card shows how much work teams have completed. Therefore, leadership quickly understands progress.
Second, the Total Projects by Status card highlights:
Completed projects
Ongoing projects
Delayed projects
As a result, managers identify risk areas instantly.
Third, the Labor Cost by Region chart shows cost distribution. Consequently, planners allocate resources better.
Finally, the Budget vs Actual Cost by City chart reveals financial discipline. If actual cost exceeds the budget, decision-makers take immediate corrective action.
Click to Purchases Urban Infrastructure Dashboard in Power BI
2️⃣ Infrastructure Type Analysis – Which Type Costs the Most?
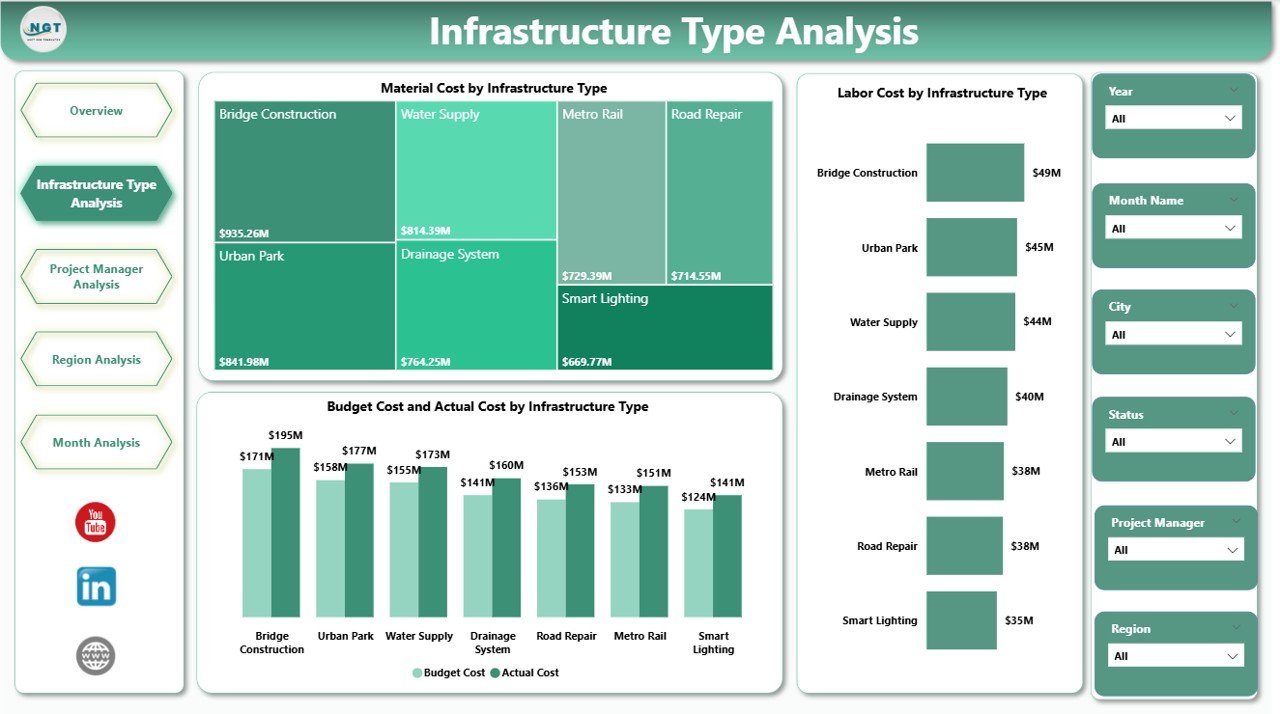
Cities develop multiple infrastructure types. However, each type consumes different resources.
This page focuses on infrastructure categories such as:
Roads
Bridges
Metro systems
Utilities
Residential projects
Charts Included on This Page
Material Cost by Infrastructure Type
Labor Cost by Infrastructure Type
Budget Cost vs Actual Cost by Infrastructure Type
Why Does This Matter?
For example, bridge construction often requires heavy materials and skilled labor. Meanwhile, road maintenance may consume more equipment hours.
Therefore, this page helps you:
Identify cost-heavy infrastructure types
Compare spending patterns
Control overspending early
Because you use slicers, you can filter by year, region, or month. As a result, you analyze performance deeply.
3️⃣ Project Manager Analysis – Who Delivers the Best Performance?
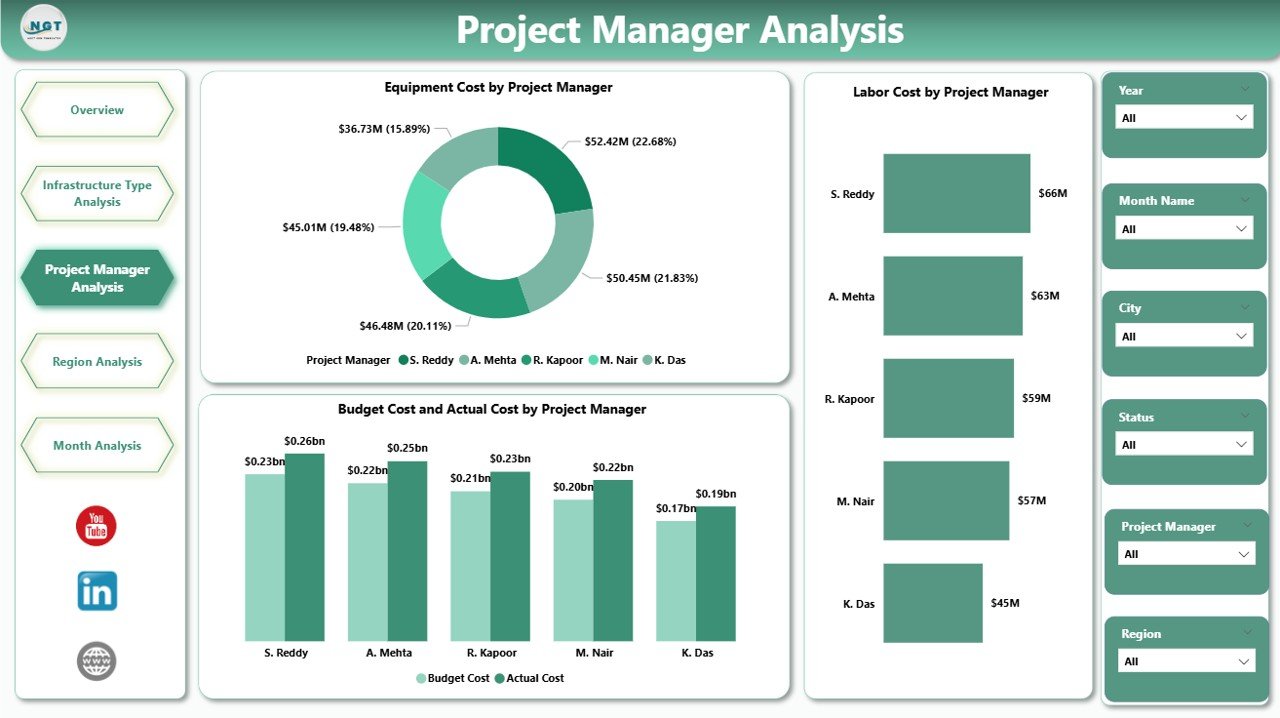
Leadership teams often ask: Which project manager handles costs effectively?
This page provides clear answers.
Charts Included
Equipment Cost by Project Manager
Labor Cost by Project Manager
Budget Cost vs Actual Cost by Project Manager
Why Is This Insight Powerful?
First, you compare managers side by side.
Second, you identify cost control strengths.
Third, you detect overspending patterns.
Therefore, management rewards efficient leaders and supports underperforming teams.
Additionally, this transparency builds accountability across the organization.
4️⃣ Region Analysis – Which Region Performs Better?
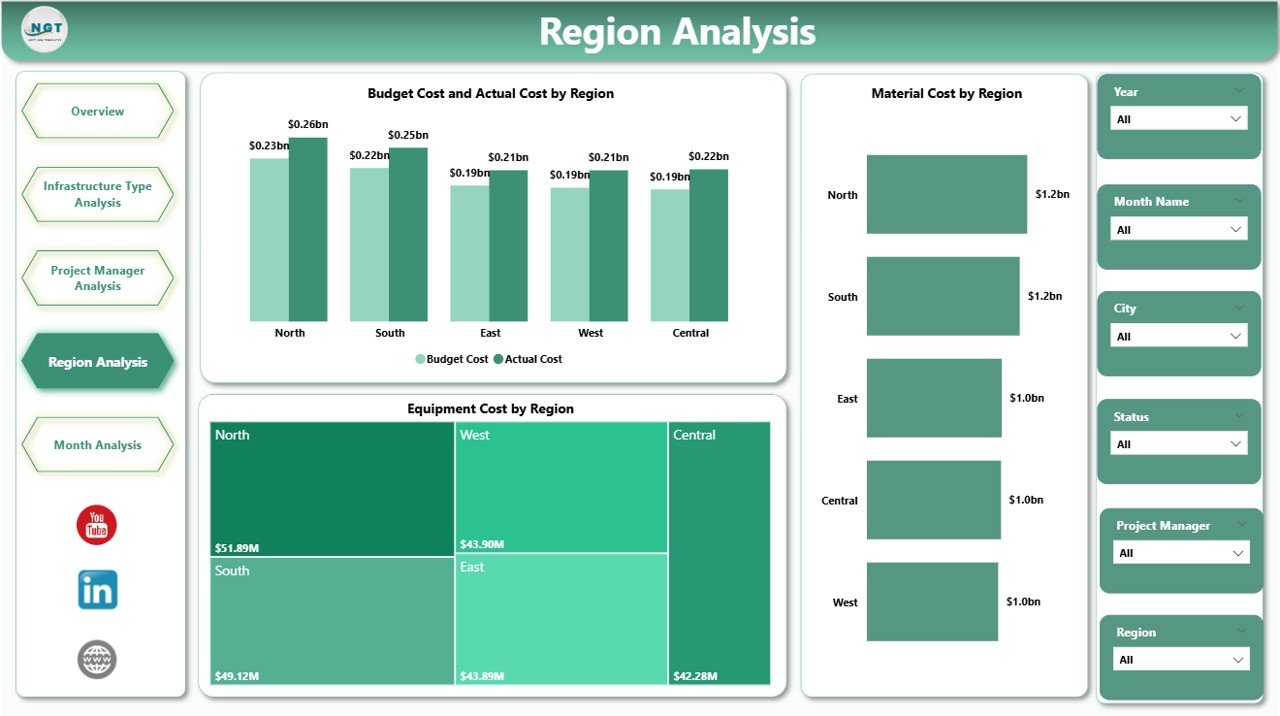
Urban projects spread across multiple regions. However, each region faces different challenges.
For example:
Terrain conditions
Labor availability
Material pricing
Regulatory factors
Charts Included
Equipment Cost by Region
Material Cost by Region
Budget Cost vs Actual Cost by Region
What Can You Discover?
You can:
Compare regional spending
Identify high-cost zones
Analyze budget control per region
Therefore, city authorities allocate funding more effectively.
5️⃣ Month Analysis – How Do Costs Change Over Time?
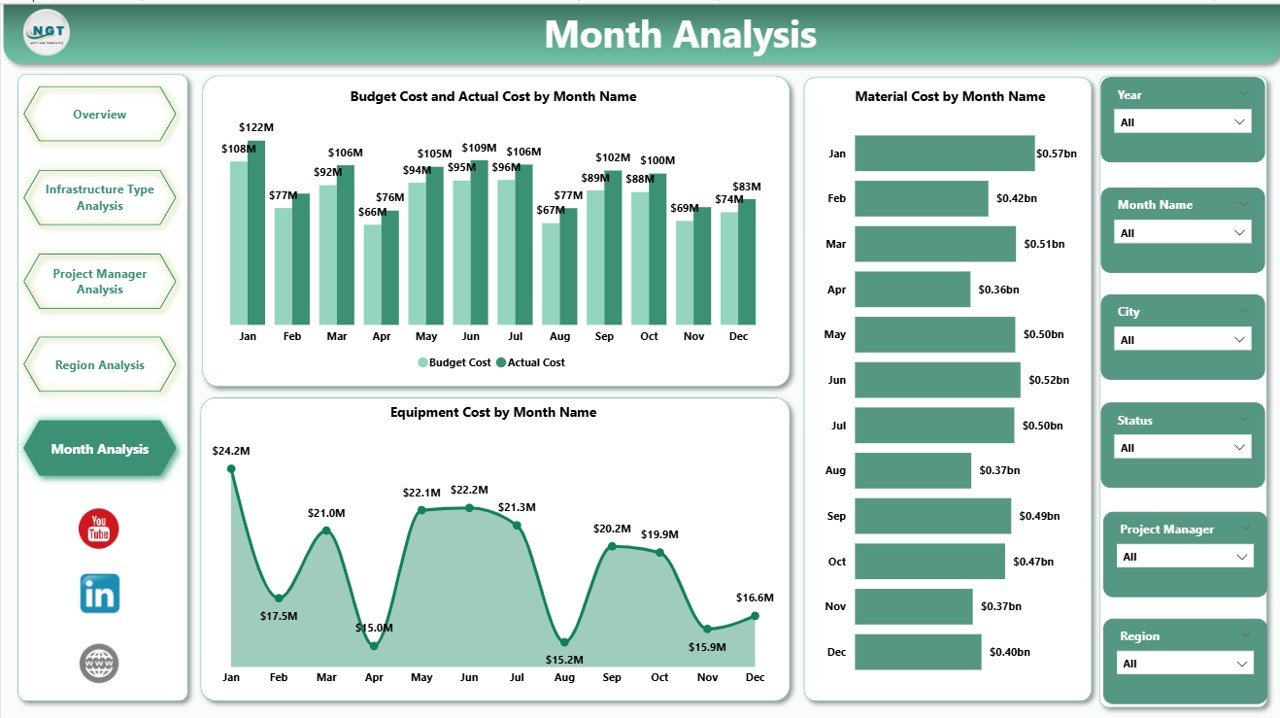
Infrastructure projects span months or years. Therefore, tracking monthly trends becomes crucial.
Charts Included
Equipment Cost by Month
Material Cost by Month
Budget Cost vs Actual Cost by Month
Why Is Monthly Tracking Important?
First, you detect seasonal patterns.
Second, you forecast future expenses.
Third, you adjust budgets proactively.
For example, material prices may rise during certain months. Therefore, early identification prevents financial shock.
Advantages of Urban Infrastructure Dashboard in Power BI
Click to Purchases Urban Infrastructure Dashboard in Power BI
Now let us explore the major benefits.
1️⃣ Real-Time Visibility
Because Power BI updates data dynamically, leaders view the latest performance instantly.
2️⃣ Better Financial Control
You compare budget vs actual cost quickly. Therefore, you reduce cost overruns.
3️⃣ Improved Resource Allocation
When you analyze labor and equipment costs, you optimize resource deployment.
4️⃣ Data-Driven Decisions
Instead of relying on assumptions, managers use factual insights.
5️⃣ Higher Accountability
Transparent reporting encourages responsible project management.
6️⃣ Time Savings
You avoid manual reporting. Consequently, teams focus on execution.
Best Practices for the Urban Infrastructure Dashboard in Power BI
To maximize results, follow these best practices:
1️⃣ Maintain Clean Data
Ensure you enter accurate project details, costs, and dates.
2️⃣ Update Data Regularly
Refresh data weekly or monthly to maintain relevance.
3️⃣ Use Clear KPI Definitions
Define cost categories clearly. For example:
Labor Cost
Equipment Cost
Material Cost
Budget Cost
Actual Cost
4️⃣ Train Your Team
Teach users how to use slicers and filters effectively.
5️⃣ Monitor Budget Variance Monthly
Review Budget vs Actual monthly to prevent large deviations.
6️⃣ Customize Visuals as Needed
Power BI allows easy customization. Therefore, tailor visuals to stakeholder needs.
How Does This Dashboard Improve Urban Planning?
Urban planning requires long-term thinking. However, long-term planning fails without short-term monitoring.
This dashboard supports planning because:
It tracks cost trends
It identifies delay risks
It compares infrastructure categories
It reveals regional inefficiencies
Therefore, governments build smarter cities.
Who Should Use This Dashboard?
This dashboard benefits:
Urban development authorities
Construction companies
Infrastructure consultants
Government agencies
City planning departments
Smart city project managers
Because the dashboard offers structured insights, both technical and non-technical users can understand it easily.
How Does Power BI Enhance Infrastructure Reporting?
Power BI provides:
Interactive slicers
Drill-through analysis
Real-time visuals
Automated refresh
Export options
Therefore, you create professional reports without complex systems.
Conclusion: Why Should You Adopt an Urban Infrastructure Dashboard in Power BI?
Urban projects involve massive investments. Therefore, every decision impacts public funds and development speed.
An Urban Infrastructure Dashboard in Power BI delivers:
Complete cost transparency
Real-time monitoring
Region-wise performance tracking
Manager-level accountability
Monthly trend visibility
Because of these benefits, infrastructure leaders make faster and smarter decisions.
If you want to build smarter cities and control project spending, this dashboard becomes your strongest ally.
Frequently Asked Questions (FAQs)
What Is the Purpose of an Urban Infrastructure Dashboard in Power BI?
It helps track project progress, costs, regional performance, and budget variance in one interactive report.
Can I Customize the Dashboard?
Yes. You can modify visuals, filters, and KPIs according to project needs.
How Often Should I Update the Data?
You should update it weekly or monthly depending on project scale.
Does This Dashboard Help in Budget Control?
Yes. It compares budget vs actual cost clearly. Therefore, you detect overspending quickly.
Is Power BI Suitable for Large Infrastructure Projects?
Yes. Power BI handles large datasets efficiently and provides advanced analytics.
Can Government Agencies Use This Dashboard?
Absolutely. Government departments use it to improve transparency and accountability.
Visit our YouTube channel to learn step-by-step video tutorials