Managing vendors plays a critical role in every organization. Companies rely on vendors for raw materials, services, logistics, technology, and many other needs. However, poor vendor visibility often leads to delayed deliveries, cost overruns, compliance gaps, and strained relationships. Because of this, businesses now demand a structured and data-driven approach to vendor oversight.
A Vendor Management Dashboard in Excel offers a powerful, simple, and cost-effective solution. It gives procurement teams, finance managers, and leadership a clear, real-time view of vendor performance, payments, contracts, and risks—all in one place.
In this in-depth article, you will learn what a Vendor Management Dashboard in Excel is, why organizations need it, how it works, what pages it includes, and how to use it effectively. Moreover, the article explains advantages, best practices, and frequently asked questions to help you implement it successfully.
Click to Purchases Vendor Management Dashboard in Excel
What Is a Vendor Management Dashboard in Excel?
A Vendor Management Dashboard in Excel is a ready-to-use analytical tool that tracks, monitors, and evaluates vendor-related performance using structured metrics and visual reports.
Instead of managing vendors through scattered spreadsheets and manual reports, this dashboard consolidates all vendor data into one interactive Excel file. As a result, users can analyze costs, delivery efficiency, vendor activity, payment trends, and regional performance with ease.
Because Excel remains widely available and flexible, organizations of all sizes use this dashboard without investing in expensive vendor management software.
✅ Why Do Businesses Need a Vendor Management Dashboard?
Vendor management affects costs, timelines, quality, and compliance. When businesses rely on manual tracking, they face serious challenges.
Common Vendor Management Challenges
-
Lack of vendor performance visibility
-
Delayed delivery tracking issues
-
Payment variance and budget overruns
-
Inconsistent vendor evaluation
-
Manual reporting delays
-
Difficulty in comparing vendors across regions
However, a Vendor Management Dashboard in Excel eliminates these challenges by offering a centralized and visual management approach.
✅ How Does a Vendor Management Dashboard in Excel Work?
This dashboard uses structured Excel tables as the data source and converts them into interactive visuals using pivot tables, slicers, charts, and KPI cards.
Key Functional Flow
-
Upload or enter vendor data into predefined tables
-
Refresh pivot tables and charts
-
Use slicers to filter by month, region, vendor category, or manager
-
Analyze KPIs through visual cards and charts
-
Identify trends and risks instantly
Because Excel handles calculations automatically, teams spend less time on manual work and more time on decision-making.
✅ What Are the Key Features of a Vendor Management Dashboard in Excel?
This ready-to-use Vendor Management Dashboard includes powerful and user-friendly features designed for business users.
🔹 Page Navigator
-
Located on the left side
-
Allows quick navigation across all dashboard pages
-
Eliminates scrolling and confusion
-
Improves usability for non-technical users
🔹 Right-Side Slicers
-
Filter data by month, region, vendor category, and more
-
Enable focused analysis in seconds
-
Help users drill down into details
✅ What Pages Are Included in the Vendor Management Dashboard in Excel?
This dashboard includes five interactive pages, each focusing on a specific aspect of vendor management.
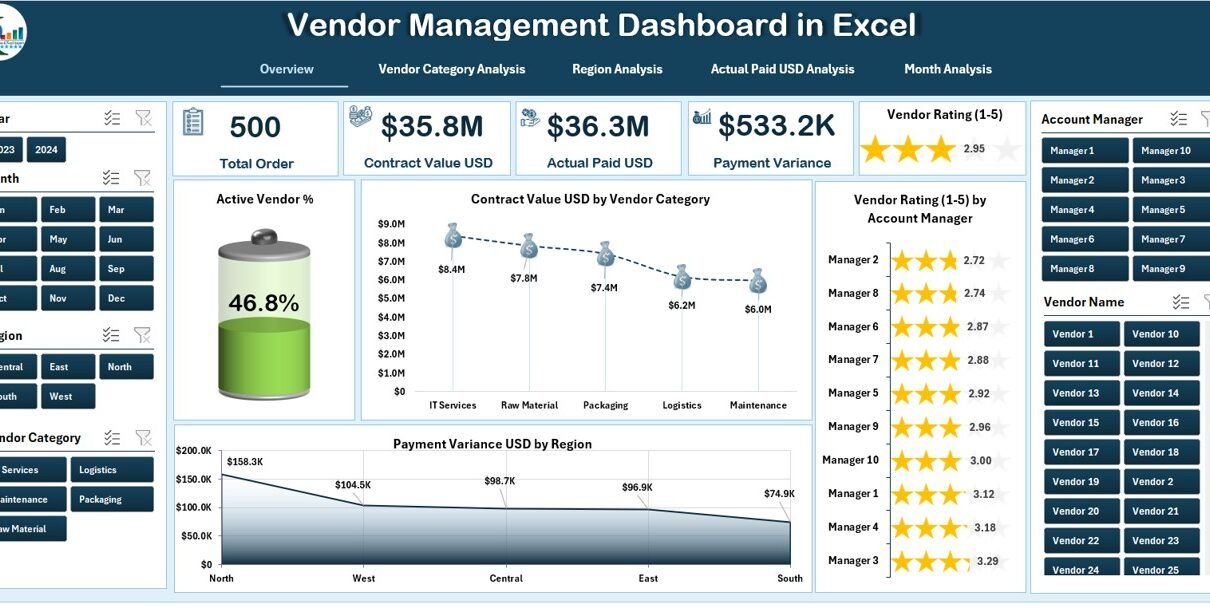
✅ What Insights Does the Overview Page Provide?
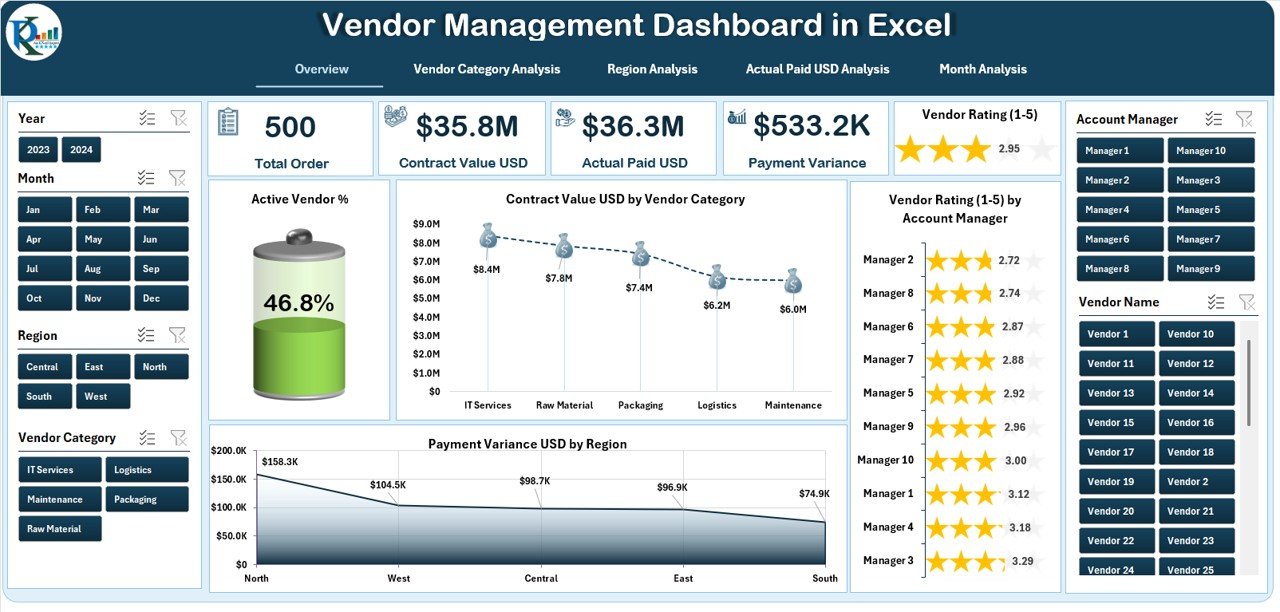
The Overview Page acts as the executive summary of the entire dashboard.
✅ KPI Cards on the Overview Page
The overview includes five KPI cards that give instant performance visibility:
-
Active Vendor %
-
Total Contract Value USD
-
Average Vendor Rating
-
Total Payment Variance USD
-
Delayed Delivery %
✅ Charts on the Overview Page
The overview page also includes four essential charts:
-
Active Vendor % – shows vendor engagement status
-
Contract Value USD by Vendor Category – highlights spending distribution
-
Vendor Rating by Account Manager – compares vendor quality across managers
-
Payment Variance USD by Region – reveals financial discrepancies region-wise
Because this page summarizes vendor health instantly, decision-makers rely on it for quick reviews.
Click to Purchases Vendor Management Dashboard in Excel
✅ How Does the Vendor Category Analysis Page Help?
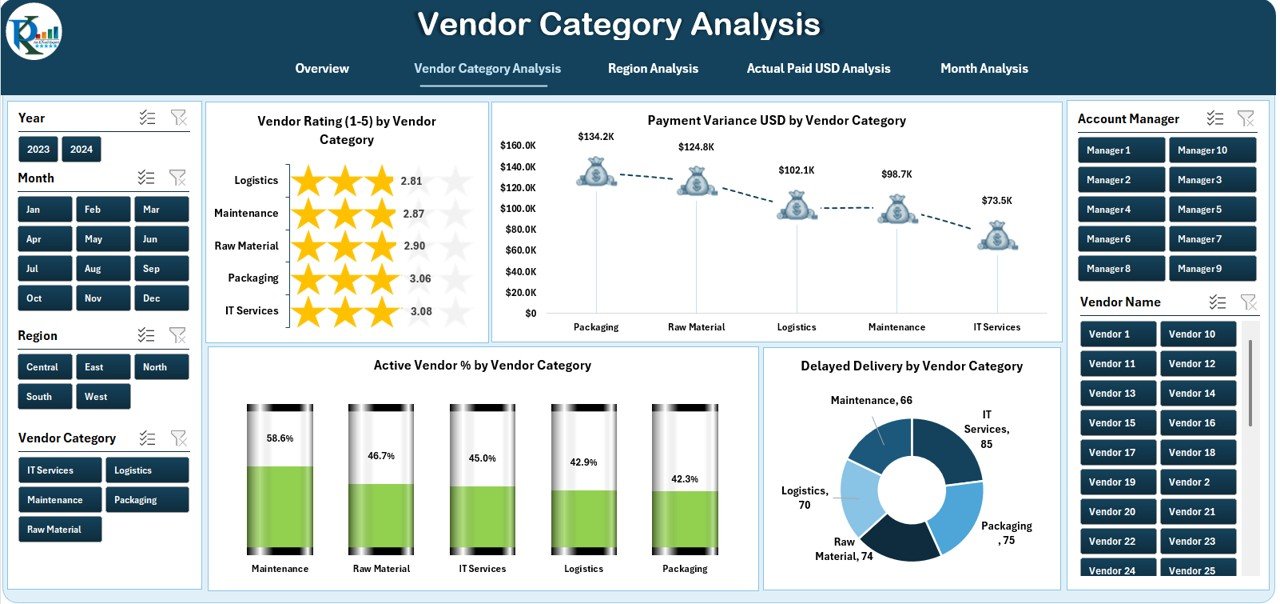
The Vendor Category Analysis Page focuses on comparing vendor performance based on category or type.
✅ Charts on Vendor Category Analysis Page
This page includes four analytical charts:
-
Vendor Rating by Vendor Category
-
Payment Variance USD by Vendor Category
-
Active Vendor % by Vendor Category
-
Delayed Delivery % by Vendor Category
✅ Why Vendor Category Analysis Matters
-
Identifies high-performing vendor categories
-
Highlights risky or underperforming categories
-
Supports category-level negotiation strategies
-
Improves sourcing decisions
Because categories often show different behavior patterns, this page enables smarter vendor segmentation.
✅ What Does the Region Analysis Page Show?
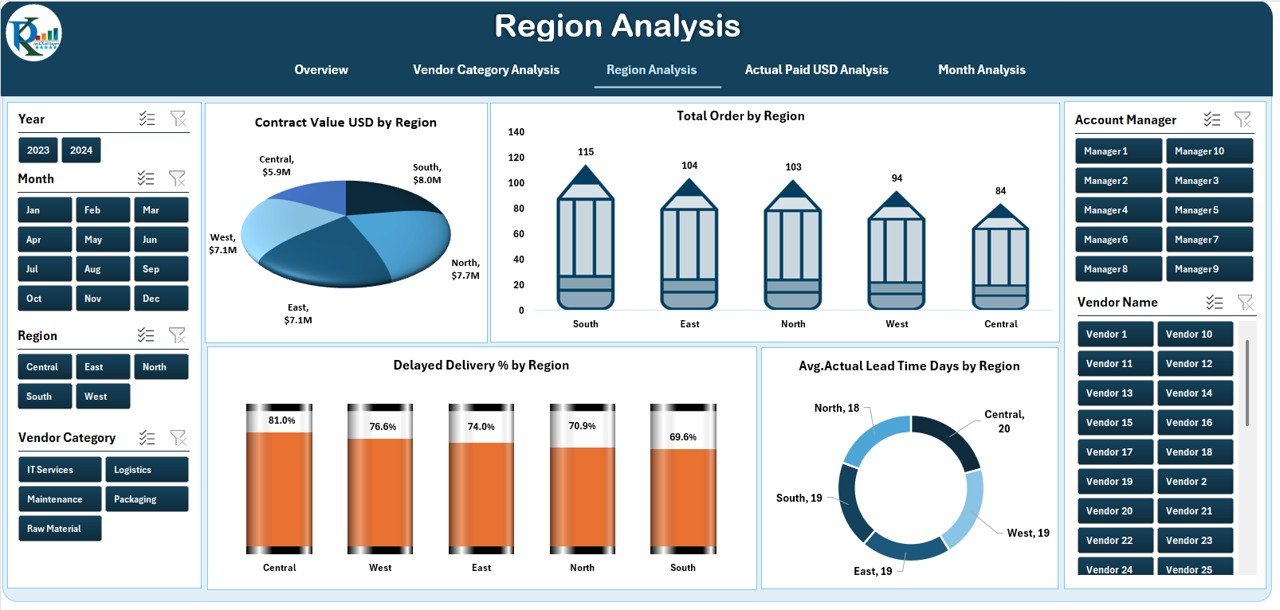
The Region Analysis Page evaluates vendor performance across geographic locations.
✅ Charts on Region Analysis Page
This page contains four region-focused charts:
-
Contract Value USD by Region
-
Total Orders by Region
-
Delayed Delivery % by Region
-
Average Actual Lead Time Days by Region
-
Click to Purchases Vendor Management Dashboard in Excel
✅ Benefits of Region-Based Vendor Analysis
-
Identifies logistical inefficiencies
-
Highlights regional vendor risks
-
Supports region-wise budgeting
-
Improves supply chain planning
Because vendor behavior differs by location, this page helps organizations manage regional performance proactively.
✅ Why Analyze Actual Paid USD in Vendor Management?
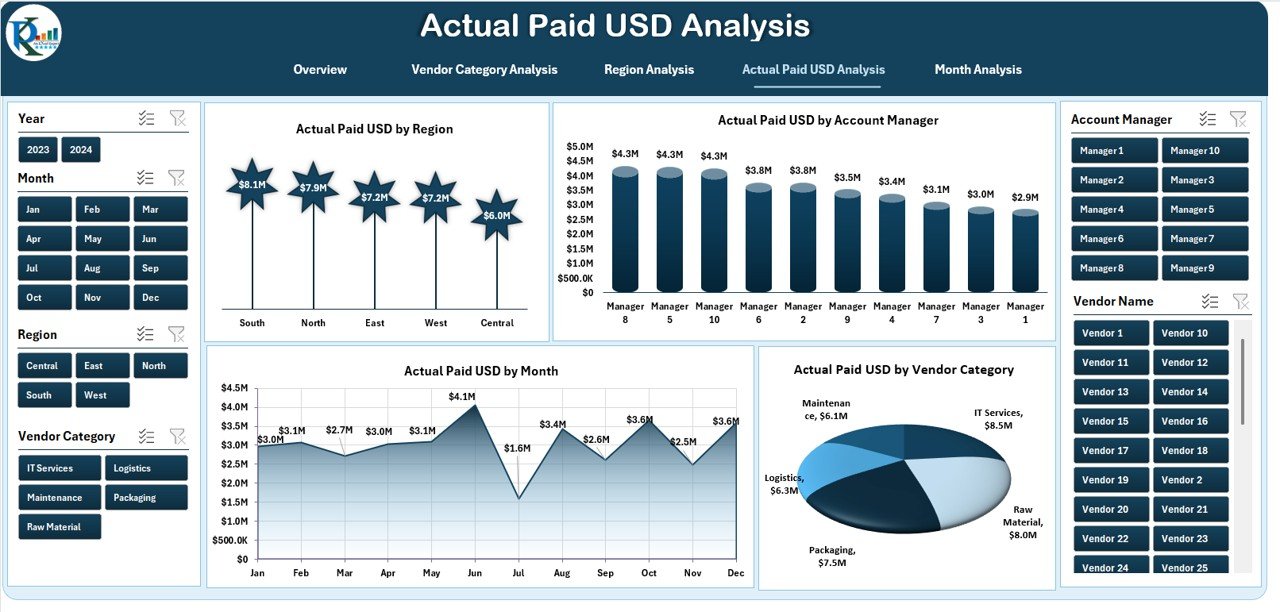
Payments represent one of the most sensitive aspects of vendor relationships. Therefore, the Actual Paid USD Analysis Page focuses entirely on vendor payments.
✅ Charts on Actual Paid USD Analysis Page
This page includes four detailed charts:
-
Actual Paid USD by Region
-
Actual Paid USD by Account Manager
-
Actual Paid USD by Month
-
Actual Paid USD by Vendor Category
✅ Value of Payment Analysis
-
Tracks vendor payment trends
-
Identifies budget leakage
-
Monitors account manager accountability
-
Supports cash flow planning
Because payment visibility improves financial control, finance and procurement teams rely heavily on this page.
✅ What Insights Does the Month Analysis Page Deliver?
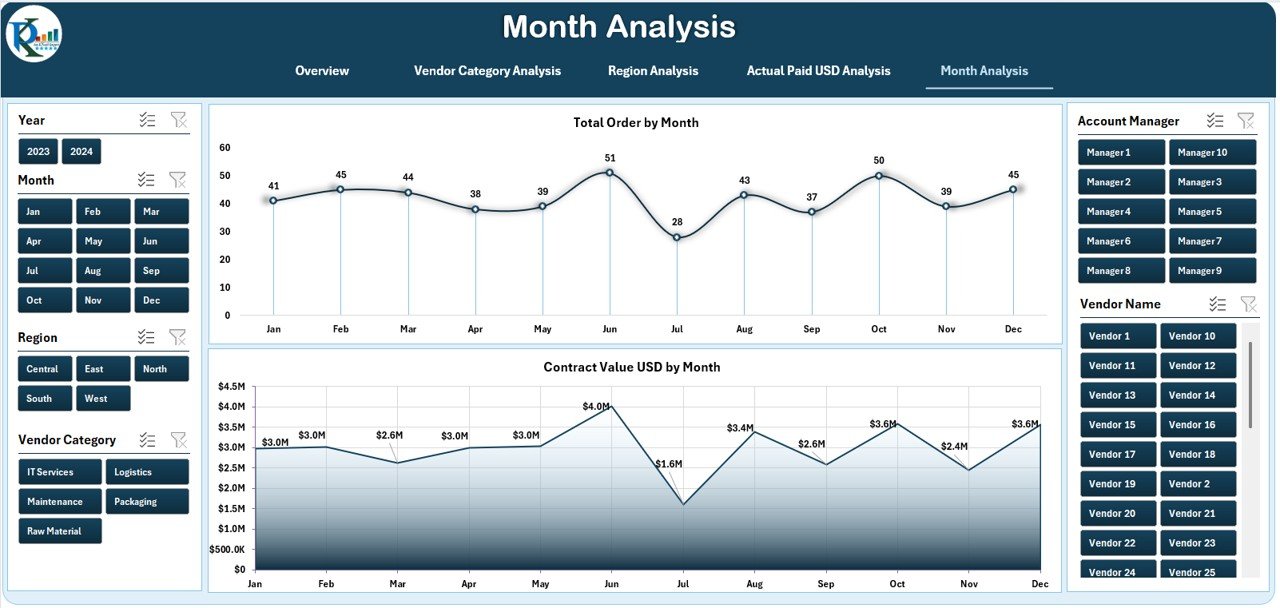
The Month Analysis Page tracks vendor performance over time.
✅ Key Uses of Monthly Analysis
-
Identifies seasonal trends
-
Detects performance fluctuations
-
Supports forecasting
-
Improves monthly performance reviews
By observing month-wise data, teams can predict issues before they escalate.
✅ Advantages of Vendor Management Dashboard in Excel
✅ Why Should You Use a Vendor Management Dashboard in Excel?
A Vendor Management Dashboard in Excel offers several valuable advantages.
🔹 Centralized Vendor Control
-
Brings all vendor data into one place
-
Eliminates scattered spreadsheets
🔹 Improved Decision-Making
-
Visual insights support faster decisions
-
Data-driven discussions replace assumptions
🔹 Cost Optimization
-
Highlights payment variance
-
Identifies high-cost vendor categories
🔹 Better Vendor Relationships
-
Data-backed evaluations improve transparency
-
Fair ratings strengthen trust
🔹 Easy Customization
-
Excel allows full customization
-
Teams adapt dashboards to business needs
🔹 No Additional Software Cost
-
Uses Excel, which most organizations already own
-
Avoids expensive vendor management systems
✅ Best Practices for the Vendor Management Dashboard in Excel
✅ How Can You Get the Best Results from This Dashboard?
Click to Purchases Vendor Management Dashboard in Excel
Follow these proven best practices to maximize value.
🔹 Standardize Vendor Data
-
Use consistent vendor names
-
Maintain uniform categories and regions
🔹 Update Data Regularly
-
Refresh vendor data monthly or weekly
-
Avoid outdated insights
🔹 Define Clear KPIs
-
Use consistent vendor rating criteria
-
Align KPIs with business goals
🔹 Train Users Properly
-
Educate users on slicers and filters
-
Reduce misuse and misinterpretation
🔹 Use It for Reviews
-
Include dashboard insights in vendor reviews
-
Support contract renegotiations
🔹 Secure the File
-
Protect formulas and structure
-
Limit editing permissions when needed
✅ Who Should Use a Vendor Management Dashboard in Excel?
This dashboard supports multiple business roles.
-
Procurement Managers
-
Supply Chain Teams
-
Finance Managers
-
Vendor Relationship Managers
-
Operations Leaders
-
Business Owners
Because it suits both operational and strategic needs, teams across departments find it useful.
✅ Can Small Businesses Use a Vendor Management Dashboard in Excel?
Absolutely. Small and medium businesses benefit greatly because:
-
Excel remains affordable
-
Setup requires minimal effort
-
Vendor risks often impact SMEs more severely
Therefore, this dashboard fits organizations of all sizes.
✅ How Customizable Is a Vendor Management Dashboard in Excel?
Excel offers powerful customization options:
-
Add or remove KPIs
-
Modify charts and layouts
-
Introduce new vendor categories
-
Adjust currencies and regions
-
Integrate with Power BI later
Because of this flexibility, the dashboard grows with your business.
✅ Future Improvements for Vendor Management Dashboards
Although Excel dashboards work exceptionally well, organizations can enhance them further.
-
Integrate Power BI for advanced visuals
-
Automate data imports
-
Add risk and compliance scoring
-
Include contract expiry alerts
-
Apply predictive analytics
These upgrades strengthen long-term vendor strategy.
✅ Conclusion
A Vendor Management Dashboard in Excel transforms vendor oversight from a manual, reactive task into a strategic, transparent process. It empowers organizations to monitor vendors, control costs, improve delivery performance, and strengthen relationships—all from one Excel file.
With interactive pages covering overview, vendor category analysis, region analysis, payment insights, and monthly trends, this dashboard becomes an essential tool for procurement and finance teams.
When businesses follow best practices and maintain data discipline, this dashboard delivers long-term value, clarity, and control.
✅ Frequently Asked Questions (FAQs)
❓ What is the main purpose of a Vendor Management Dashboard in Excel?
The main purpose involves tracking vendor performance, costs, deliveries, and payments in one centralized and visual format.
❓ Can I use this dashboard without advanced Excel skills?
Yes. The dashboard uses simple slicers and charts, making it easy for any business user to operate.
❓ How often should I update the vendor data?
You should update vendor data monthly or weekly, depending on transaction volume and business needs.
❓ Can I customize KPIs in the Vendor Management Dashboard?
Yes. Excel allows you to add, remove, or modify KPIs based on organizational requirements.
❓ Does this dashboard support multi-region businesses?
Yes. The Region Analysis page specifically supports regional vendor evaluation and comparisons.
❓ Can I integrate this dashboard with Power BI later?
Yes. Excel works seamlessly as a data source for Power BI, enabling future scalability.
❓ Is Excel secure enough for vendor data?
Yes. You can protect sheets, lock formulas, and control access to ensure data security.
Visit our YouTube channel to learn step-by-step video tutorials