Veterinary Clinic Dashboard in Power BI is an interactive, professionally designed analytics dashboard built for veterinary clinic owners, practice managers, and animal healthcare professionals who want complete visibility into clinic operations, patient trends, treatment patterns, and revenue performance — all inside Microsoft Power BI. This dashboard includes 5 interactive report pages covering every angle of veterinary clinic management from high-level overviews to granular revenue breakdowns.
Whether you run a small veterinary practice or manage a multi-location animal hospital, this Power BI dashboard delivers interactive, drill-down analytics to help you make smarter clinical and business decisions every day. If you are looking for an Excel-based alternative, check out the Veterinary Clinic Dashboard in Excel.
Click here to Purchase the Veterinary Clinic Dashboard in Power BI

Key Features of Veterinary Clinic Dashboard in Power BI
The Veterinary Clinic Dashboard in Power BI is packed with powerful features that make veterinary clinic analytics effortless and insightful. Here are the key highlights that set this template apart:
- 5 Interactive Dashboard Pages — Overview, Patient Analysis, Treatment Insights, Vet Performance, and Revenue Breakdown provide a complete 360-degree view of your clinic’s operations, finances, and patient care quality.
- Dynamic DAX-Powered Visuals — All charts and KPI cards are powered by DAX measures, ensuring accurate and real-time calculations across every report page without manual formula management.
- Slicer Filters for Instant Analysis — Built-in slicers let you filter data by month, department, pet type, veterinarian, visit type, and more for quick, targeted insights tailored to your specific needs.
- KPI Summary Cards — The Overview page displays Total Visits, Avg Visit Duration, Total Revenue, Avg Bill Per Visit, and Total Consultation Fees at a glance so you can monitor clinic health instantly.
- Patient and Treatment Analytics — Analyze visits by breed, diagnosis category, treatment type, and veterinarian to understand patient flow, treatment effectiveness, and satisfaction patterns.
- Revenue Intelligence — Break down revenue by payment method, year, department, and pet type to identify top-performing revenue streams and optimize your billing strategy.
- Veterinarian Performance Tracking — Compare satisfaction ratings, revenue contribution, and visit status across your veterinary team to identify top performers and balance workloads.
- Easy Data Replacement — Simply replace the sample Excel data source with your own clinic records and refresh the report to see your personalized dashboard instantly.
-
Click here to Purchase the Veterinary Clinic Dashboard in Power BI
Dashboard Pages Explanation
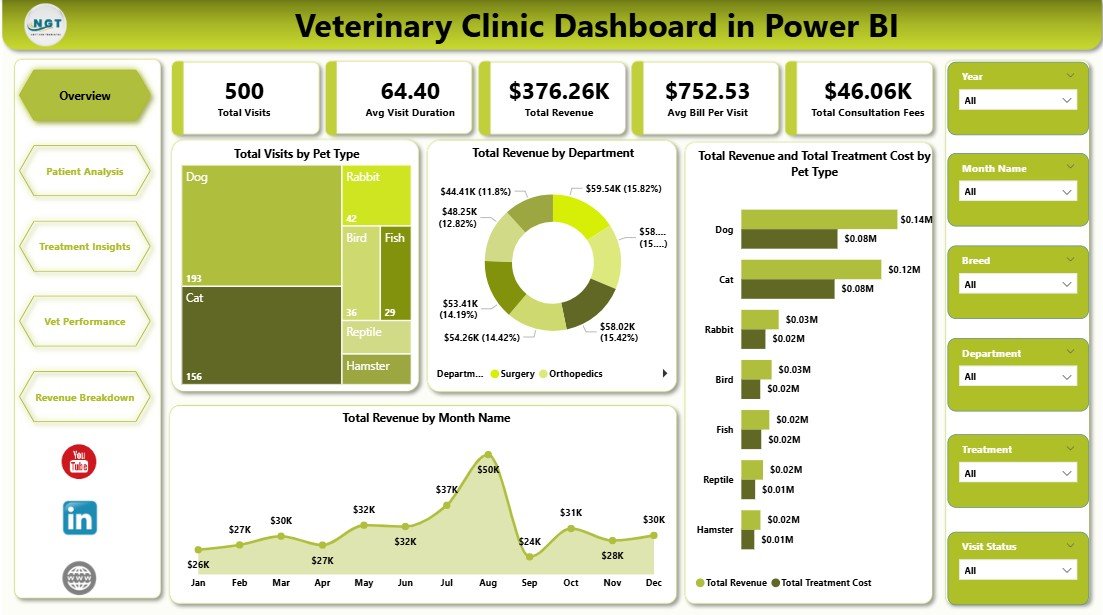
1. Overview Page
The Overview page serves as your command center for veterinary clinic analytics. At the top, you will find high-level KPI cards displaying Total Visits, Avg Visit Duration, Total Revenue, Avg Bill Per Visit, and Total Consultation Fees. These cards give you an instant snapshot of your clinic’s overall performance.
Below the KPI cards, multiple interactive charts provide deeper insights. The Total Visits by Pet Type chart shows which animal categories drive the most appointments. The Total Revenue by Department chart breaks down income across different service areas. The Total Revenue and Total Treatment Cost by Pet Type chart lets you compare what you earn versus what you spend on treatments for each pet category. Finally, the Total Revenue by Month Name chart reveals seasonal revenue patterns and trends throughout the year.
Multiple slicers are available to filter the entire dashboard by month, department, pet type, veterinarian, and visit type — giving you complete control over the data you analyze.
Veterinary Clinic Dashboard in Power BI2. Patient Analysis
The Patient Analysis page provides a deep dive into patient demographics and satisfaction data. The Total Visits by Breed chart shows which breeds generate the most clinic visits, helping you understand your patient population mix. The Avg Satisfaction Score by Diagnosis Category chart reveals which diagnosis types receive the highest and lowest patient satisfaction ratings, enabling you to focus on quality improvement areas. The Total Revenue by Treatment chart breaks down earnings by individual treatment types, showing which services contribute the most to your revenue.
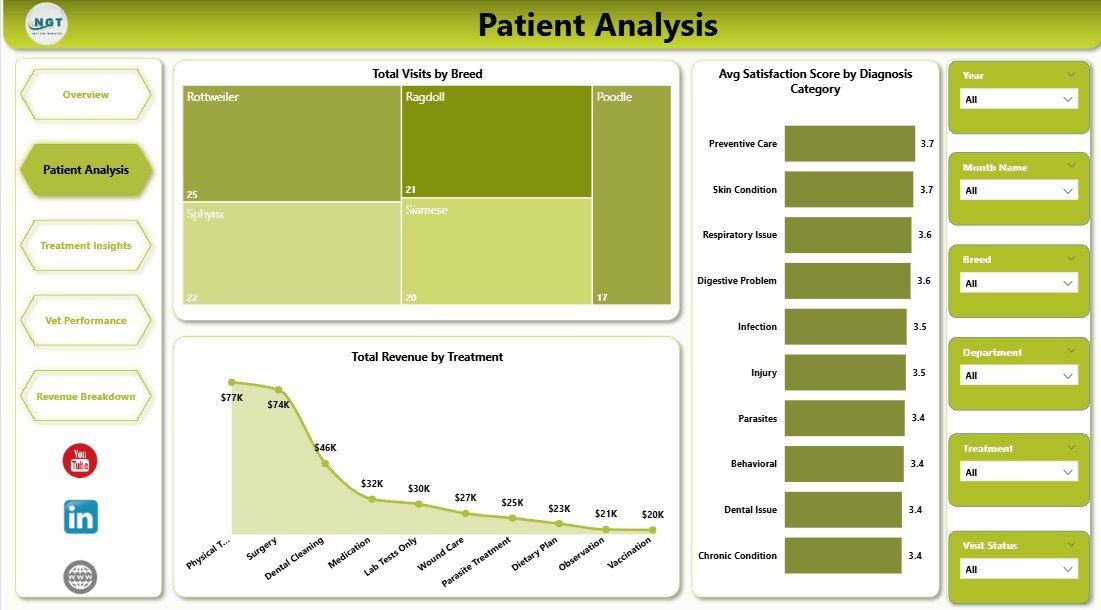 Patient Analysis
3. Treatment Insights
The Treatment Insights page focuses on operational efficiency and treatment cost analysis. The Total Visits by Veterinarian chart shows how appointments are distributed across your team members. The Total Revenue and Total Medication Cost by Visit Type chart compares revenue earned against medication expenses for different visit categories like emergency, routine, and follow-up visits. The Total Visits by Treatment chart reveals which treatment types are most frequently administered across your clinic.
Click here to Purchase the Veterinary Clinic Dashboard in Power BI
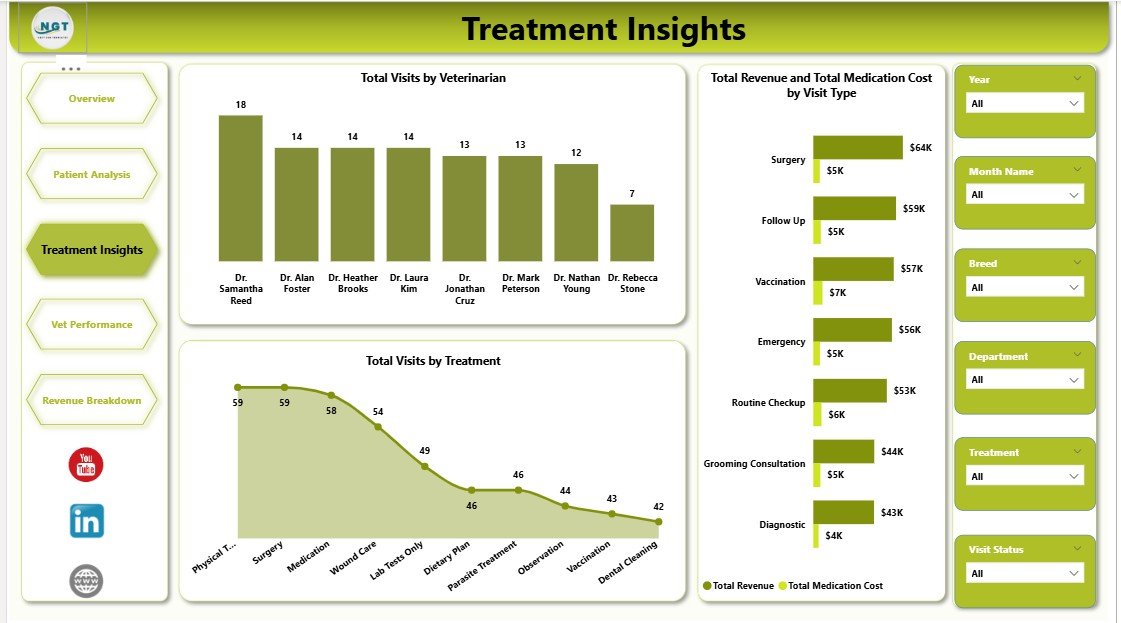 Treatment Insights
4. Vet Performance
The Vet Performance page gives clinic managers clear data to assess individual veterinarian effectiveness. The Total Visits by Visit Status chart shows completed, pending, and cancelled visits across your team. The Total Revenue by Veterinarian chart ranks each vet by their revenue contribution. The Avg Satisfaction Score by Veterinarian chart compares patient satisfaction ratings per doctor, helping you identify coaching opportunities and recognize top-performing team members.
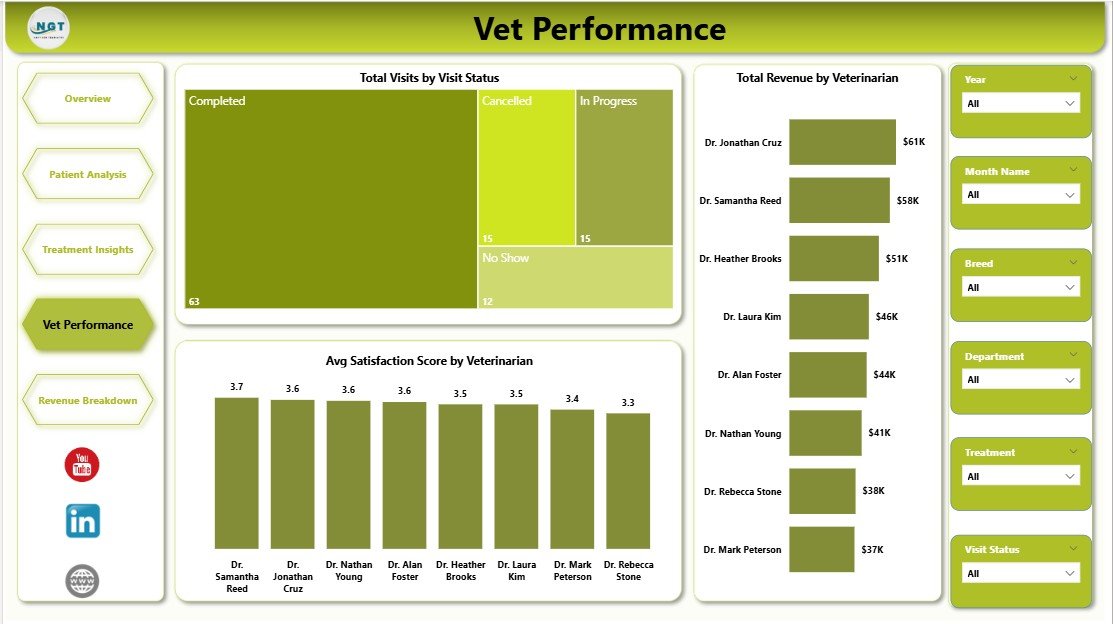 Vet Performance
5. Revenue Breakdown
The Revenue Breakdown page provides comprehensive financial analytics for your veterinary clinic. The Total Revenue by Year chart tracks long-term revenue growth and helps you identify year-over-year trends. The Avg Bill Per Visit by Pet Type chart shows which animal categories have the highest average transaction values. The Total Revenue by Payment Method chart breaks down income by cash, card, insurance, and other payment methods — helping you understand your patients’ preferred payment channels and optimize billing workflows.
Click here to Purchase the Veterinary Clinic Dashboard in Power BI
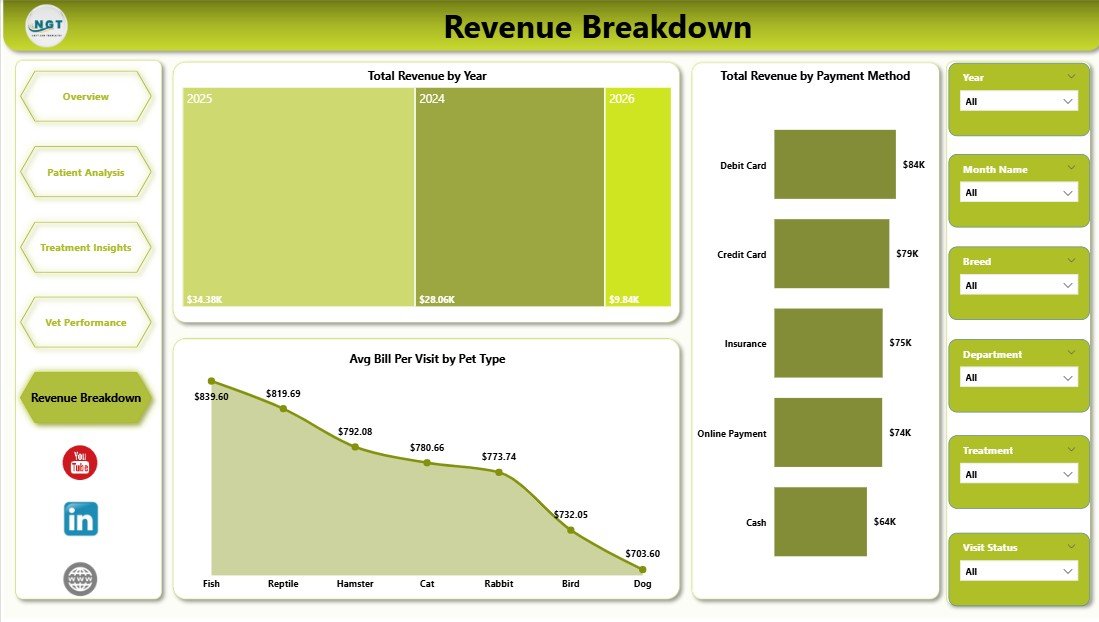 Revenue Breakdown
Advantages of Veterinary Clinic Dashboard in Power BI
This dashboard offers several compelling advantages for veterinary professionals who want to move beyond spreadsheets and into modern business intelligence:
- Centralized Analytics — All your clinic data is consolidated into one interactive interface instead of being scattered across multiple spreadsheets and reports.
- Real-Time Decision Making — Refresh the data source and all 5 pages update instantly, giving you the latest insights without manual recalculations.
- Visual Storytelling — Power BI’s rich visualization capabilities transform raw numbers into clear, actionable charts that anyone on your team can understand.
- Scalable Across Locations — Whether you manage one clinic or multiple animal hospitals, the dashboard scales with your data.
- Cost-Effective Analytics — Power BI Desktop is free from Microsoft, so you only pay for the template — no expensive BI software subscriptions required.
Opportunities for Improvement
While this dashboard covers the most critical areas of veterinary clinic analytics, there are opportunities to extend its capabilities further:
- Add appointment scheduling analytics to track no-show rates and booking efficiency.
- Include inventory management metrics for medical supplies and medications.
- Integrate with live data sources like practice management software for real-time streaming analytics.
- Add predictive analytics using Power BI’s AI capabilities to forecast seasonal demand and revenue trends.
Best Practices for Using This Dashboard
- Update data regularly — Refresh your Excel data source weekly or monthly to keep all analytics current and actionable.
- Use slicers strategically — Combine multiple slicer selections (e.g., specific month + specific veterinarian) for granular, focused analysis.
- Share with your team — Publish to Power BI Service so your entire veterinary team can access the dashboard from any device.
- Customize to fit your workflow — Add new DAX measures or modify existing ones to match your clinic’s unique KPI definitions.
- Compare periods — Use the Revenue Breakdown page to compare year-over-year performance and identify growth opportunities.
Explore Relevant Templates
If you found this Veterinary Clinic Dashboard in Power BI useful, explore these related templates from NextGenTemplates:
- Veterinary Clinic Dashboard in Excel — Pivot-driven Excel dashboard with 5 interactive analysis pages, data sheet, and support sheet.
- Veterinary Clinic KPI Scorecard in Excel — Track monthly and yearly KPI targets with MTD/YTD comparisons and color-coded performance indicators.
- Pet Care Services KPI Dashboard in Power BI — Advanced KPI tracking for pet grooming, boarding, daycare, and training businesses.
- Veterinary Services KPI Dashboard in Power BI — Pre-defined KPI metrics with MTD/YTD target tracking, trend charts, and drill-through definitions.
Frequently Asked Questions
What is the best Power BI dashboard for veterinary clinics?
The Veterinary Clinic Dashboard in Power BI from NextGenTemplates is one of the best options available. It includes 5 interactive pages tracking visits, revenue, treatments, vet performance, and financial breakdowns — all with slicer filters and DAX-powered visuals for accurate, real-time analytics.
What KPIs does this veterinary dashboard track?
This dashboard tracks Total Visits, Avg Visit Duration, Total Revenue, Avg Bill Per Visit, and Total Consultation Fees as primary KPIs. It also provides detailed analysis of revenue by department, treatment costs by pet type, satisfaction scores by veterinarian, and revenue trends by year and payment method.
Do I need Power BI Pro to use this template?
No. You can open and use this dashboard with the free Power BI Desktop application from Microsoft. Power BI Pro is only needed if you want to publish and share the report online with your team through Power BI Service.
How do I replace the sample data with my own clinic data?
Open the .pbix file in Power BI Desktop, go to Transform Data, and update the Excel data source path to point to your own clinic records. Ensure your data follows the same column format as the sample. Then click Refresh to update all visuals automatically.
Can I add more report pages or modify existing charts?
Yes. Power BI Desktop gives you full flexibility to add new report pages, create custom DAX measures, modify existing visuals, and tailor the dashboard to your clinic’s specific needs. No coding is required for basic customizations.
Is there an Excel version of this dashboard?
Yes! The Veterinary Clinic Dashboard in Excel provides the same 5 analysis pages using pivot tables and pivot charts, with slicer filters and automated data refresh.
Conclusion
The Veterinary Clinic Dashboard in Power BI is a powerful analytics tool that transforms raw clinic data into actionable insights across 5 interactive pages. From tracking patient visits and treatment patterns to evaluating veterinarian performance and analyzing revenue breakdowns, this dashboard gives you everything you need to manage your veterinary practice with confidence and clarity.
Stop relying on scattered spreadsheets and start making data-driven decisions with professional Power BI analytics. Download the Veterinary Clinic Dashboard in Power BI today and take your clinic’s performance management to the next level.
Click here to Purchase the Veterinary Clinic Dashboard in Power BI
Visit our YouTube channel to learn step-by-step video tutorials