The veterinary industry is evolving rapidly, driven by data, digital tools, and rising client expectations. Veterinary Services KPI Dashboard in Power BI Veterinary hospitals, clinics, and pet-care centers must monitor performance closely to maintain service quality, ensure profitability, and deliver better animal outcomes.
Veterinary Services KPI Dashboard in Power BI That’s where the Veterinary Services KPI Dashboard in Power BI comes in — a ready-to-use, data-driven solution that helps veterinary professionals analyze key metrics efficiently. Built in Microsoft Power BI, this dashboard connects seamlessly to Excel data sources and converts raw numbers into actionable visual insights.
Click to Purchases Veterinary Services KPI Dashboard in Power BI
What Is a Veterinary Services KPI Dashboard in Power BI?
A Veterinary Services KPI Dashboard is an interactive business-intelligence tool that tracks all essential veterinary performance indicators in one place. It helps administrators, clinic owners, and veterinarians measure both clinical and operational efficiency through well-defined Key Performance Indicators (KPIs).
With this dashboard, users can analyze everything from appointment volumes and treatment success rates to revenue growth and operational performance — all dynamically visualized in Power BI with slicers, charts, and KPI cards.
Key Features of the Veterinary Services KPI Dashboard
The dashboard consists of three pages in the Power BI desktop file. Each page serves a specific analytical purpose, ensuring smooth navigation and deep insights.
1️⃣ Summary Page – Your Main Control Panel

The Summary Page is the central view where all essential veterinary KPIs are displayed in a clear, visual format.
Highlights include:
-
📅 Month & KPI Group Slicers: Easily filter data by month or category.
-
📊 KPI Cards: Three KPI cards display — Total KPI Count, MTD (Target Met), and MTD (Target Missed).
-
📈 Detailed KPI Table: A structured table that lists every KPI and its current status.
Columns explained:
-
KPI Number: Sequential identifier of each KPI.
-
KPI Group: Category such as Financial, Clinical, Operational, or Customer Service.
-
KPI Name: The specific performance indicator (e.g., Treatment Success Rate %).
-
Unit: Measurement unit like %, Count, Days, or USD.
-
Type: KPI direction — LTB (Lower the Better) or UTB (Upper the Better).
-
Actual CY MTD: Current Year Month-to-Date actual values.
-
Target CY MTD: Current Year Month-to-Date targets.
-
MTD Icon: Green ▲ or red ▼ icons show whether the KPI meets its target.
-
Target vs Actual (MTD): Formula = Actual / Target (MTD) × 100.
-
PY MTD: Previous Year Month-to-Date value.
-
CY vs PY (MTD): Formula = CY MTD / PY MTD × 100.
-
Actual CY YTD: Current Year Year-to-Date actuals.
-
Target CY YTD: YTD targets for the current year.
-
YTD Icon: Green ▲ or red ▼ based on YTD performance.
-
Target vs Actual (YTD): Formula = Actual / Target (YTD) × 100.
-
PY YTD: Previous Year YTD values.
-
CY vs PY (YTD): Formula = CY YTD / PY YTD × 100.
This page gives a complete performance summary for management reviews, audits, and board presentations.
Click to Purchases Veterinary Services KPI Dashboard in Power BI
2️⃣ KPI Trend Page – Visualize Performance Over Time
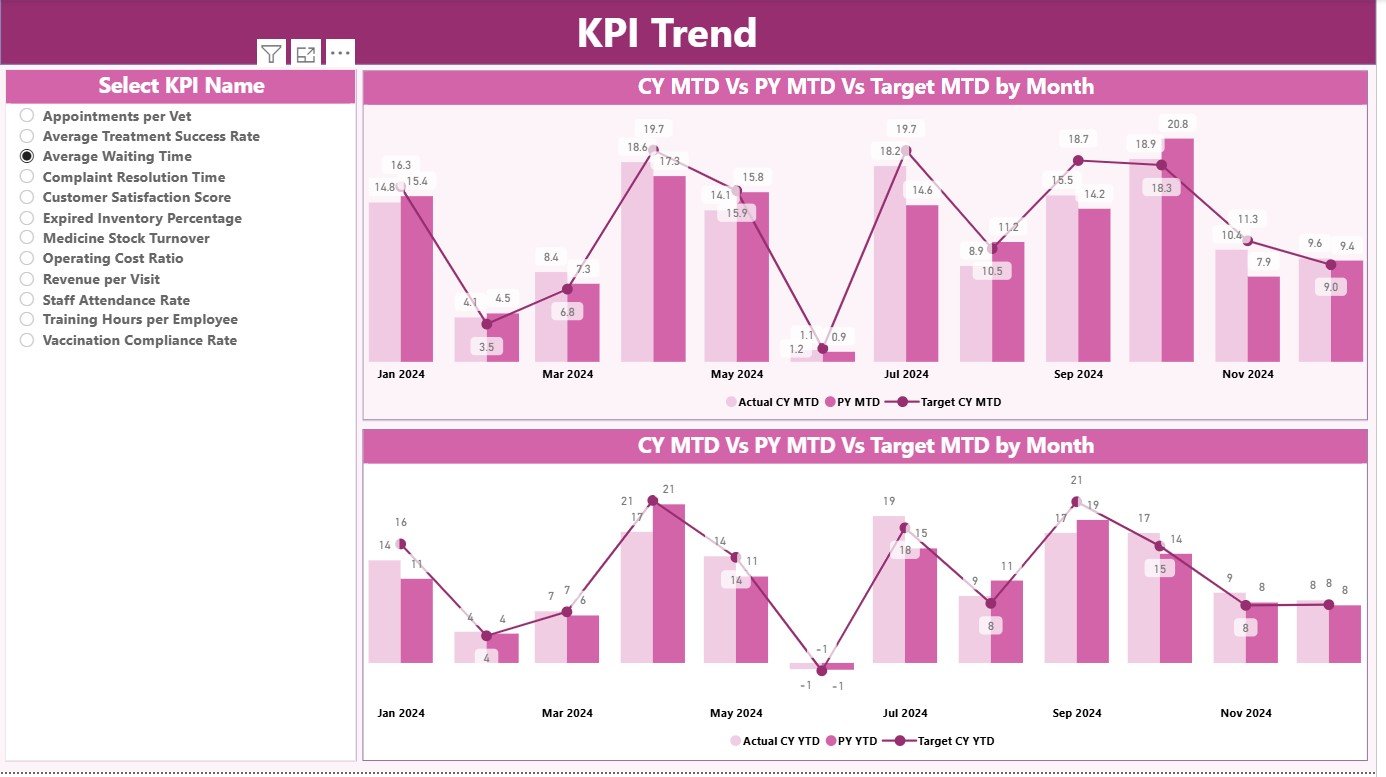
The KPI Trend Page helps users explore historical data patterns.
Features:
-
📌 Slicer for KPI Selection: Choose any KPI from the left-side filter.
-
📉 Two Combo Charts:
-
Chart 1 – MTD Actual vs Target vs Previous Year
-
Chart 2 – YTD Actual vs Target vs Previous Year
-
-
Dynamic Comparisons: Quickly identify growth trends or performance drops.
This page helps clinic owners and managers make informed decisions about staff performance, client care, and cost optimization.
3️⃣ KPI Definition Page – Maintain Transparency and Clarity

The KPI Definition Page is a hidden drill-through page that users can access directly from the Summary Page.
It displays additional details such as:
-
Formula Used
-
KPI Definition / Description
-
Measurement Type (UTB or LTB)
To return to the Summary Page, simply click the Back button in the top-left corner.
Excel Data Source – Powering the Dashboard
The Veterinary Services KPI Dashboard pulls data from an Excel file with three worksheet tabs.
1️⃣ Input – Actual Sheet
-
Enter actual KPI values.
-
Columns include KPI Name, Month (first date of month), MTD Actual, and YTD Actual.
2️⃣ Input – Target Sheet
-
Record monthly and yearly target numbers.
-
Columns include KPI Name, Month, MTD Target, and YTD Target.
3️⃣ KPI Definition Sheet
-
Enter KPI Number, Group, Name, Unit, Formula, Definition, and Type (LTB / UTB).
With Power BI’s data connection, this Excel file automatically updates your visuals whenever new information is entered.
Click to Purchases Veterinary Services KPI Dashboard in Power BI
Why Use a Veterinary Services KPI Dashboard?
Every veterinary practice collects a wealth of data — patient visits, treatments, lab results, financials, and staff utilization. Without visualization, that data remains under-used.
This dashboard helps turn that information into meaningful insights that improve decision-making and patient outcomes.
Benefits Include:
-
Centralized Data Access: View all KPIs in one interactive interface.
-
Instant Visual Analysis: Quickly detect underperforming areas.
-
Historical Trends: Compare current metrics against past performance.
-
Automation: Eliminate manual report generation.
-
Enhanced Transparency: Every stakeholder can monitor KPIs clearly.
Examples of Veterinary KPIs to Track
A balanced veterinary dashboard should include metrics across four dimensions:
1️⃣ Clinical KPIs
-
Treatment Success Rate (%)
-
Surgical Complication Rate (%)
-
Average Diagnosis Time (Hours)
-
Patient Recovery Time (Days)
2️⃣ Operational KPIs
-
Appointments Handled Per Vet Per Day
-
Average Waiting Time (Minutes)
-
Equipment Utilization Rate (%)
-
Inventory Turnover Ratio
3️⃣ Customer Satisfaction KPIs
-
Client Retention Rate (%)
-
Average Feedback Score (Out of 5)
-
New Client Referrals Count
4️⃣ Financial KPIs
-
Revenue Per Consultation (USD)
-
Profit Margin (%)
-
Cost Per Treatment (USD)
-
Outstanding Invoices (Count / Value)
Advantages of the Veterinary Services KPI Dashboard
1. Real-Time Visibility
Get live insights into practice operations, improving responsiveness and planning.
2. Data-Driven Decisions
Replace guesswork with evidence-based management.
3. Improved Client Satisfaction
Tracking service quality and waiting times helps boost client trust.
4. Streamlined Operations
Identify inefficiencies, allocate resources properly, and enhance productivity.
5. Benchmarking and Growth
Compare monthly and yearly data to set achievable growth targets.
6. Cost Control
Analyze costs by department or service type to optimize spending.
Click to Purchases Veterinary Services KPI Dashboard in Power BI
Best Practices for Using the Veterinary KPI Dashboard
1️⃣ Define Clear KPIs
Ensure that each KPI directly supports your strategic and clinical goals.
2️⃣ Update Data Regularly
Maintain accurate monthly updates for reliable analysis.
3️⃣ Leverage Conditional Formatting
Use color cues to highlight target performance instantly.
4️⃣ Drill Down When Needed
Utilize the hidden KPI Definition Page for deeper insights.
5️⃣ Engage Teams
Encourage vets and support staff to review performance regularly.
6️⃣ Use Trend Charts
Monitor both MTD and YTD comparisons to understand seasonality.
7️⃣ Automate Refresh
Schedule Power BI data refresh to update visuals automatically.
How the Dashboard Supports Decision-Making
This Power BI dashboard becomes a strategic control center for your veterinary business.
-
Clinic Owners: Monitor overall profitability and client satisfaction.
-
Veterinarians: Track treatment success and patient recovery metrics.
-
Operations Managers: Optimize scheduling and resource usage.
-
Finance Teams: Evaluate revenue trends and cost efficiency.
By integrating Excel data into Power BI, the entire practice gains access to powerful analytics that support smarter, faster decisions.
Click to Purchases Veterinary Services KPI Dashboard in Power BI
How to Implement the Dashboard
-
Prepare Your Data: Collect actual and target KPIs in Excel.
-
Connect Excel to Power BI: Use Get Data → Excel → Select Your File.
-
Load and Transform Data: Clean, rename, and structure the tables.
-
Link Sheets: Build relationships between Actual, Target, and Definition tables.
-
Create Visuals: Use cards, combo charts, and slicers.
-
Apply Conditional Formatting: Show green/red indicators for performance.
-
Publish and Share: Deploy to Power BI Service for team access.
Conclusion
The Veterinary Services KPI Dashboard in Power BI empowers animal healthcare providers to make data-driven, informed decisions. By visualizing clinical, operational, and financial performance in one place, it enhances accountability, efficiency, and overall patient care.
Whether you manage a single veterinary clinic or a multi-branch hospital network, this dashboard provides the clarity you need to measure success, optimize resources, and achieve sustainable growth.
Frequently Asked Questions (FAQs)
1. What is the main purpose of this dashboard?
It tracks veterinary KPIs like treatment success, client satisfaction, and revenue performance to help clinics improve efficiency.
2. Can I connect other data sources besides Excel?
Yes. Power BI can connect to SQL databases, Google Sheets, and cloud data sources for real-time reporting.
3. How often should I update the data?
Ideally monthly — or set up an auto-refresh schedule in Power BI Service.
4. Can I customize KPIs?
Absolutely. Add or remove KPIs in the Excel definition sheet and refresh the Power BI model.
5. Who should use this dashboard?
Veterinary clinic owners, practice managers, finance teams, and marketing teams who need insight into performance.
Click to Purchases Veterinary Services KPI Dashboard in Power BI
Visit our YouTube channel to learn step-by-step video tutorials