The video game industry is one of the fastest-growing creative sectors in the world — but behind every successful title lies precise project tracking, disciplined budgeting, and effective team coordination. From coding milestones to player satisfaction, every phase must be measured.
That’s where the Video Game Development KPI Dashboard in Excel becomes a game-changer.
This ready-to-use Excel dashboard allows studios, developers, and project managers to monitor development progress, financial performance, and production efficiency — all within a single interactive file.
In this comprehensive article, we’ll explore how this dashboard works, its structure, key features, benefits, best practices, and frequently asked questions.
Click to Purchases Video Game Development KPI Dashboard in Excel
What Is a Video Game Development KPI Dashboard in Excel?
A Video Game Development KPI Dashboard is a performance-management tool designed to track the key performance indicators (KPIs) throughout the lifecycle of a game project — from pre-production to post-launch.
Built entirely in Microsoft Excel, this dashboard simplifies KPI tracking by consolidating actual results, targets, and previous-year data into one interactive visual system.
By using this Excel-based solution, game studios can monitor metrics such as production efficiency, bug-fix rates, sprint completion, revenue performance, and player feedback — without requiring any expensive software.
Why Game Studios Need KPI Dashboards
Developing a video game involves hundreds of moving parts — design, art, coding, QA, marketing, and post-launch updates.
Without a structured performance-tracking system, deadlines slip, costs rise, and quality suffers.
The Video Game Development KPI Dashboard ensures teams stay aligned by providing:
-
🎮 Real-time visibility into project health
-
💰 Budget control across all development phases
-
🧩 Cross-departmental coordination between design, coding, QA, and marketing
-
📊 Instant trend analysis for decision-making
-
⚡ Automated data updates with monthly drop-down selection
This Excel template acts as your in-house performance command center.
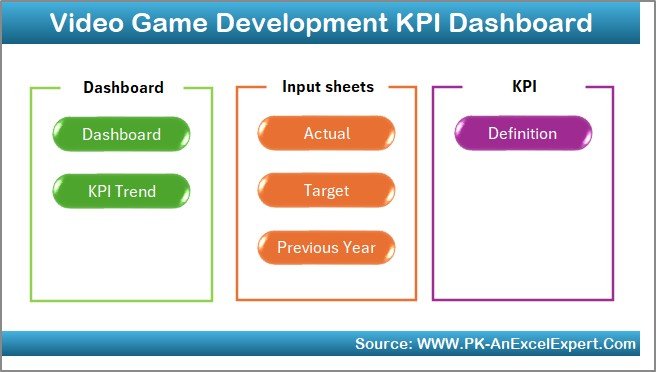
Structure of the Video Game Development KPI Dashboard
This template consists of seven key worksheets, each serving a distinct purpose for data entry, monitoring, and visualization.
1. Home Sheet – Your Navigation Hub
The Home Sheet works as an index page, containing six interactive buttons that let you jump directly to the respective sheets.
It ensures quick navigation, especially for large teams collaborating across various project stages.
This user-friendly layout allows even non-technical users to access reports and make updates effortlessly.
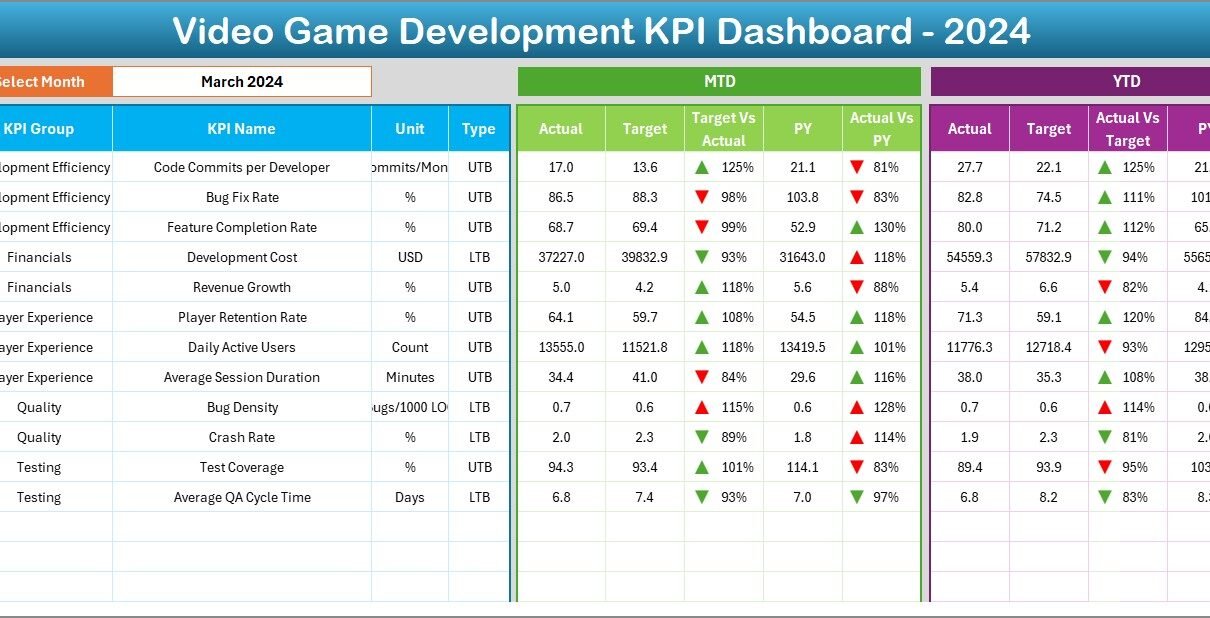
2. Dashboard Sheet – The Main Control Panel
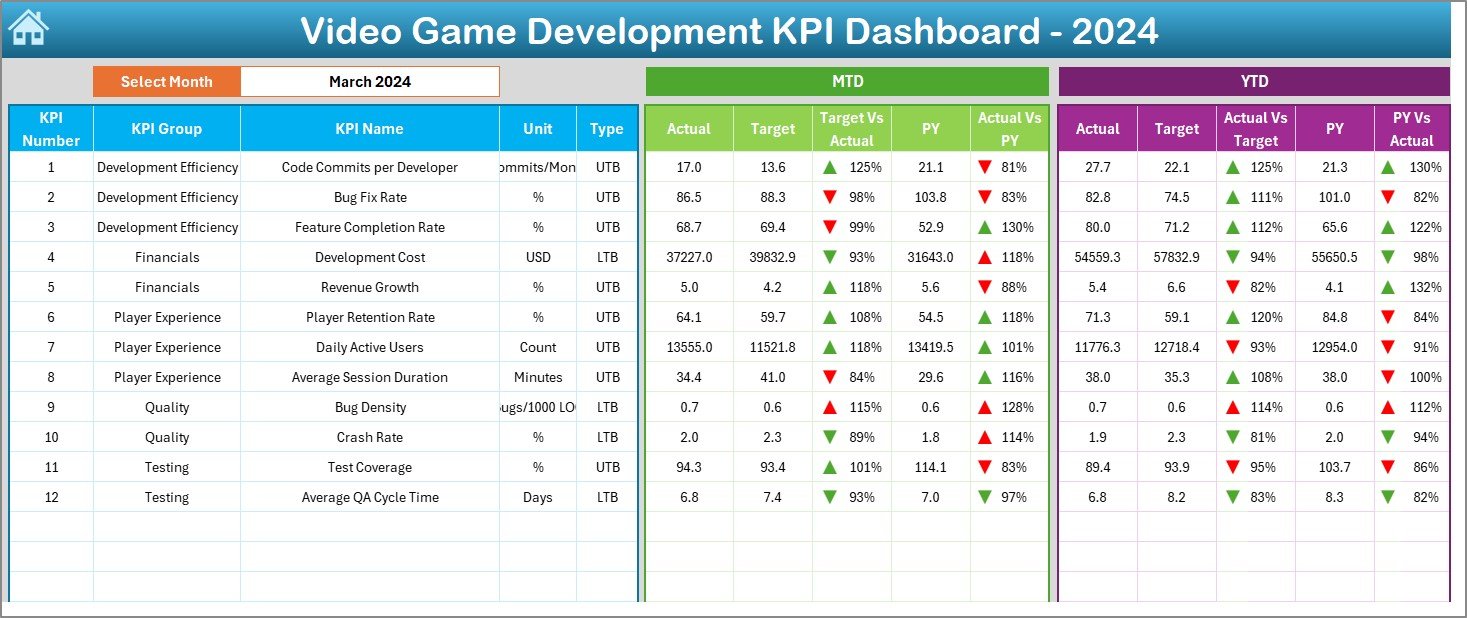
The Dashboard Sheet is the central hub where all KPIs come together. It provides a complete picture of performance for a specific month.
Key Features:
-
📆 Dynamic Month Selection:
Select the month from the drop-down in cell D3 — all charts and tables update automatically. -
📈 MTD and YTD Insights:
-
MTD (Month-to-Date): Shows Actual, Target, and Previous Year data.
-
YTD (Year-to-Date): Displays cumulative figures since the start of the year.
-
-
🔻🔺 Visual Indicators:
Conditional formatting arrows (green ▲ for improvement, red ▼ for decline) instantly show how each KPI performs against its target or previous year. -
📊 Comparative Metrics:
-
Target vs Actual (%)
-
PY vs Actual (%)
For both MTD and YTD values.
-
This page delivers an immediate visual summary of how your studio is performing — across production, creativity, finance, and player engagement.
Click to Purchases Video Game Development KPI Dashboard in Excel
3. KPI Trend Sheet – Track Progress Over Time
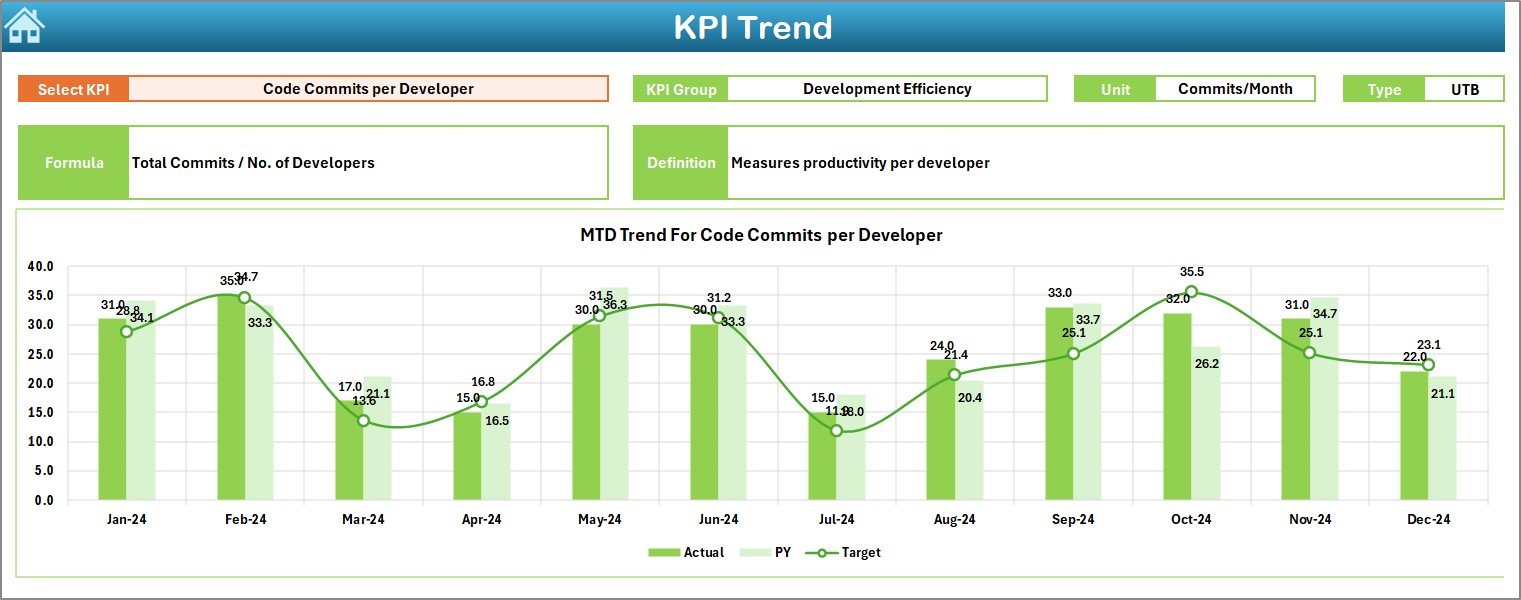
The KPI Trend Sheet helps you analyze how each KPI evolves over months.
This is especially useful for identifying long-term patterns such as productivity spikes, bottlenecks, or improvements in bug resolution speed.
Key Features:
-
🎮 KPI Selector (Cell C3): Choose any KPI from the drop-down to explore its performance.
-
📋 KPI Metadata: View essential details — KPI Group, Unit, Type (“Lower the Better” or “Upper the Better”), Formula, and Definition.
-
📈 Trend Charts: Dual charts show both MTD and YTD trends for Actual, Target, and Previous Year values.
This sheet brings storytelling to your data — turning raw numbers into meaningful development insights.
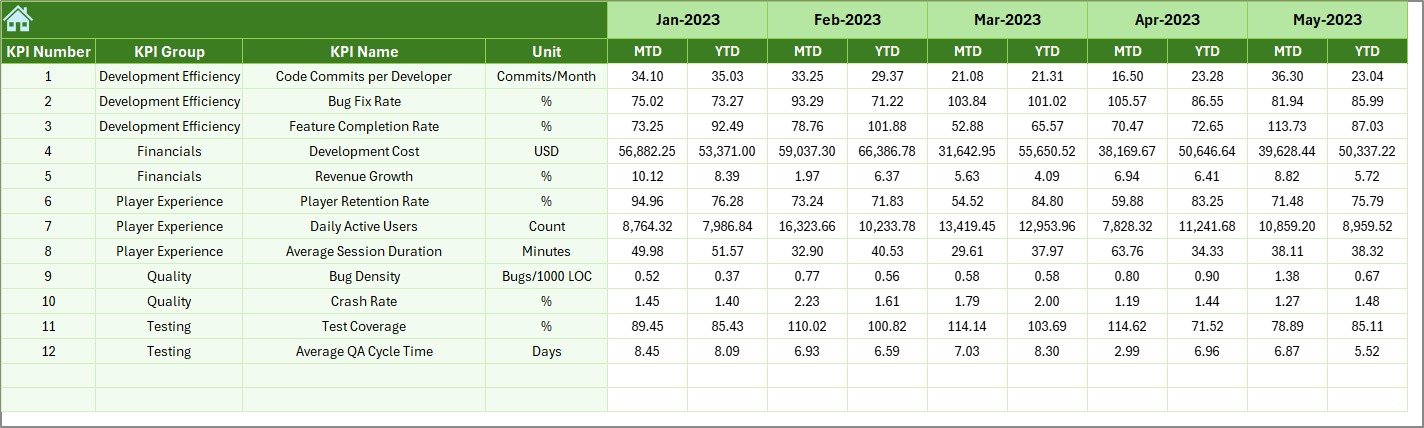
4. Actual Numbers Input Sheet – Capturing Reality
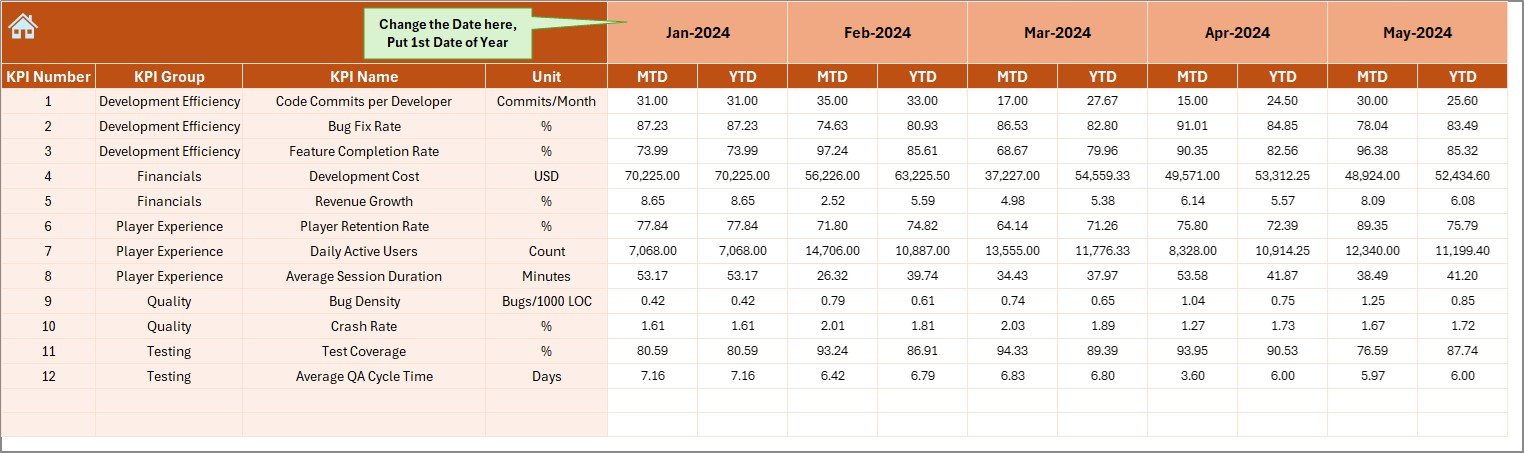
This sheet is where you enter actual performance data for each KPI.
How It Works:
-
Define the first month of the fiscal or project year in cell E1.
-
Enter MTD and YTD figures for every KPI each month.
-
Data automatically feeds the dashboard and trend charts.
This is your “truth” layer — ensuring that all visuals reflect real-time studio progress.
5. Target Sheet – Setting Benchmarks
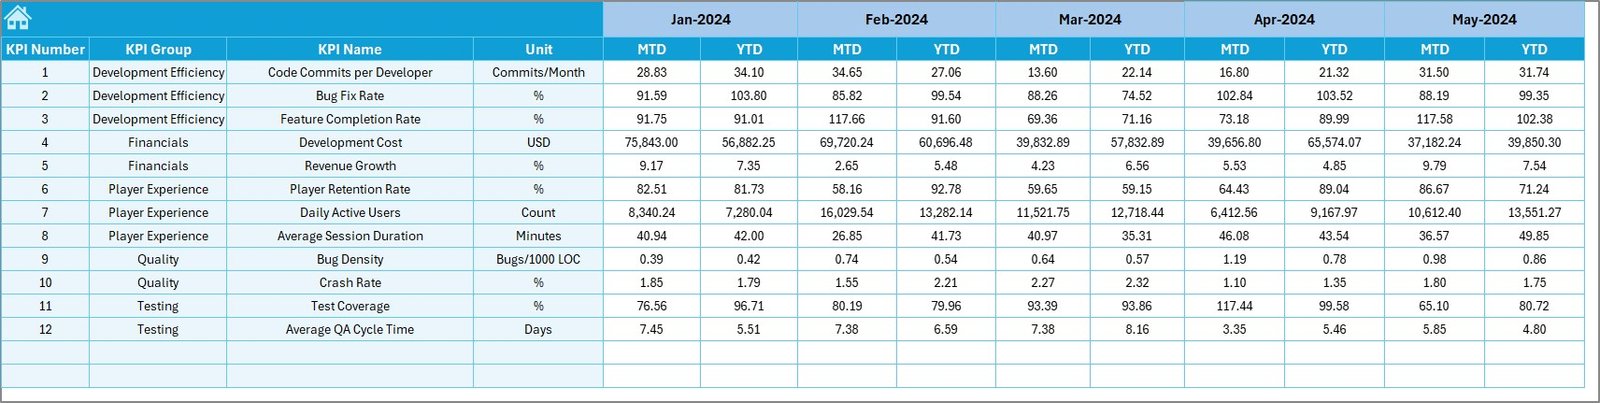
The Target Sheet defines your goals.
Here, you specify expected values for every KPI on a monthly and year-to-date basis.
Setting accurate targets allows you to measure success objectively — whether it’s meeting sprint goals, staying within budget, or improving player ratings.
6. Previous Year Number Sheet – Historical Comparison
Use this sheet to enter last year’s data.
Comparing current and past performance helps you gauge progress and identify areas needing improvement — such as faster QA cycles or lower production delays.
This historical reference adds depth to your analytics.
7. KPI Definition Sheet – Your Reference Library
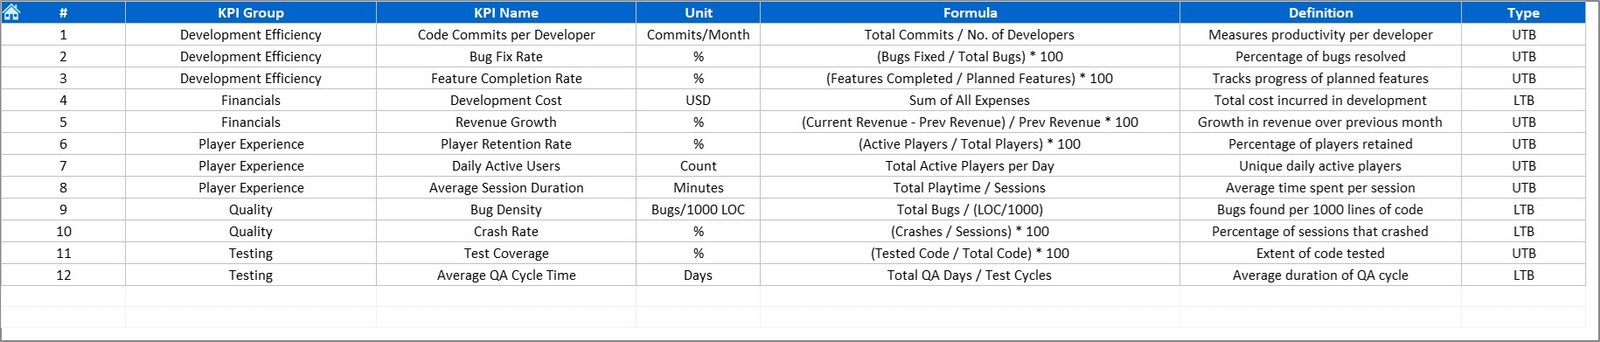
Every KPI tracked must be defined clearly. The KPI Definition Sheet ensures that.
Fields Included:
-
KPI Name
-
KPI Group (e.g., Production, Quality, Finance, Engagement)
-
Unit
-
Formula
-
Definition
This ensures consistency and helps new team members understand what each KPI measures.
Click to Purchases Video Game Development KPI Dashboard in Excel
Sample KPIs for Game Development Studios
To get the most from this dashboard, you can customize it with metrics that matter most to your studio.
Here are some commonly tracked Video Game Development KPIs:
🎮 Production KPIs
-
Sprint Completion Rate (%): Completed vs planned tasks.
-
Bug Fix Rate: Number of bugs fixed per week/month.
-
Feature Implementation Ratio: Features completed vs total planned.
-
Code Review Efficiency: Time spent vs accepted code ratio.
💰 Financial KPIs
-
Development Cost per Hour: Measures budget efficiency.
-
Revenue per Release: Evaluates financial returns post-launch.
-
Cost Variance (%): Tracks deviations from the planned budget.
-
ROI (Return on Investment): Profitability metric for the project.
🧩 Quality Assurance KPIs
-
Bug Density (per 1,000 lines of code): Monitors software stability.
-
Average Test Coverage (%): Ensures code is properly tested.
-
Regression Rate: Frequency of bugs reappearing after fixes.
👥 Team Performance KPIs
-
Task Completion Time (hrs): Measures efficiency per developer.
-
Team Utilization Rate (%): Tracks workload balance.
-
Overtime Hours: Helps manage burnout risk.
🎯 Player Experience KPIs
-
Player Retention Rate (%): Percentage of players returning.
-
User Rating (★): Average score from players or reviewers.
-
Average Session Length (mins): Indicates engagement level.
-
Support Tickets Resolved: Reflects post-launch responsiveness.
By integrating these KPIs, studios can track both creative and technical performance holistically.
Advantages of Video Game Development KPI Dashboard in Excel
1. One Centralized Reporting Tool
Eliminate multiple files — track all development and performance metrics in one dashboard.
2. Easy-to-Use Interface
Drop-downs, color-coded indicators, and simple buttons make it beginner-friendly.
3. Visual Clarity
See real-time trends with arrow indicators and combo charts for instant understanding.
4. Cost-Effective
No need for Power BI or advanced software — Excel handles everything efficiently.
5. Data Transparency
Historical comparisons (PY vs CY) foster accountability and continuous improvement.
6. Customization Ready
Add, rename, or redefine KPIs to fit any studio’s workflow — indie or AAA.
7. Informed Decision-Making
Visual insights highlight bottlenecks before they escalate into production issues.
Best Practices for Using the KPI Dashboard
To get the best results from this Excel dashboard, follow these best practices:
1. Define KPIs Clearly
Each KPI should have a measurable outcome, a defined formula, and ownership.
2. Update Data Regularly
Enter monthly data promptly to ensure dashboards reflect the latest progress.
3. Maintain Consistency
Use the same units and formats for every KPI to avoid misinterpretation.
4. Utilize Conditional Formatting Wisely
Keep color schemes simple — green for success, red for underperformance.
5. Protect Formulas
Lock critical cells to prevent accidental overwriting.
6. Review Monthly
Hold monthly KPI meetings to review trends and adjust goals.
7. Align KPIs with Project Stages
Use different sets of KPIs for pre-production, development, testing, and launch phases.
8. Back Up Data
Regular backups safeguard historical performance data for future analysis.
Customization Tips
-
🎨 Add a studio logo and theme colors for branding.
-
🧩 Integrate slicers or filters for departments (Design, QA, Marketing).
-
📊 Create pivot charts for deeper analysis.
-
🔒 Protect sheets with passwords.
-
🌍 Add localization metrics (region-wise player retention).
These enhancements can make the dashboard uniquely yours.
Who Can Use This Dashboard
This Excel template benefits:
-
🎮 Game Developers – Track production speed and efficiency.
-
🧠 Project Managers – Oversee deliverables, budgets, and milestones.
-
💼 Finance Teams – Monitor cost control and ROI.
-
🧪 QA Teams – Measure testing outcomes and bug-fix rates.
-
📈 Executives – Evaluate the studio’s overall performance at a glance.
Conclusion
The Video Game Development KPI Dashboard in Excel is an indispensable tool for game studios aiming to balance creativity with efficiency.
It transforms scattered production and financial data into actionable insights — helping teams deliver high-quality games on time and within budget.
With dynamic tracking, trend analysis, and customizable KPIs, this Excel template empowers you to monitor, evaluate, and improve every aspect of the development cycle.
Whether you’re managing a small indie team or a large studio, this dashboard ensures you stay on top of your project — every milestone, every sprint, every success.
Click to Purchases Video Game Development KPI Dashboard in Excel
Frequently Asked Questions (FAQs)
1. What is the Video Game Development KPI Dashboard?
It’s an Excel-based tool that tracks performance indicators across the entire game-development process.
2. Can I customize KPIs?
Yes. You can edit or add KPIs in the KPI Definition Sheet based on your studio’s goals.
3. Does this dashboard support MTD and YTD data?
Absolutely. Both Month-to-Date and Year-to-Date views are available.
4. What type of visual indicators are used?
Conditional formatting arrows and color-coded cells show whether performance is above or below target.
5. Can I use it for multiple projects?
Yes. You can duplicate sheets for each project or maintain project-wise tabs.
6. Is it beginner-friendly?
Yes. No advanced Excel skills are required — all formulas and drop-downs are pre-built.
7. How often should I update it?
Monthly updates are recommended for accuracy, though weekly entries work for agile projects.
8. What’s the benefit of including previous-year data?
It allows performance comparison and helps set realistic future goals.
9. Can I share this dashboard with my team?
Yes. Share via OneDrive, Teams, or network drives for real-time collaboration.
10. Where can I download the dashboard?
You can download it from NextGenTemplates.com, available as a fully editable Excel file with sample KPIs and visual dashboards.
Click to Purchases Video Game Development KPI Dashboard in Excel
Visit our YouTube channel to learn step-by-step video tutorials