Warehousing operations grow more complex every year. Companies handle thousands of orders, shipments, inventory movements, and logistics tasks every day. Because of this growing workload, warehouse managers need clear insights to improve efficiency and reduce mistakes. Manual reports often slow the team and hide important trends. However, a Warehousing KPI Dashboard in Power BI changes everything. It helps you monitor warehouse performance in real time and supports faster decisions.
In this guide, you will learn what this dashboard includes, how it works, and why every warehouse team should use it. You will also see a clear breakdown of each dashboard page, the Excel data structure, advantages, best practices, and frequently asked questions.
Click to buy Warehousing KPI Dashboard in Power BI
What Is a Warehousing KPI Dashboard in Power BI?
A Warehousing KPI Dashboard in Power BI is a ready-to-use analytical reporting tool that tracks operational and performance indicators across warehouse functions. It captures data from Excel files and shows meaningful visuals that help teams understand productivity and performance without manual calculations.
This dashboard shows important KPIs like order fulfillment time, picking accuracy, inventory accuracy, dispatch performance, receiving cycle time, and stock movement speed. Moreover, the dashboard updates instantly when you select a month or KPI group. This allows warehouse leaders to analyze any period in seconds.
The dashboard runs on three simple pages:
- Summary Page
- KPI Trend Page
- KPI Definition Page (Drill-through)
Each page plays a different role and gives strong clarity on monthly and yearly warehouse performance.
Why Do Warehousing KPIs Matter?
Warehousing KPIs matter because they help teams identify problems before they affect customer service or inventory health. When you track KPIs every month, you improve clarity, remove delays, and make warehouse operations more predictable.
Here are some reasons to monitor warehousing KPIs:
- You reduce order delays
- You improve picking and packing accuracy
- You lower cost per order
- You optimize workforce productivity
- You increase customer satisfaction
- You maintain ideal inventory levels
- You reduce dead stock and overstock
Warehouse managers who rely on manual reports often miss trends. However, a Power BI dashboard shows performance instantly, which leads to faster and better decisions.
How Does the Warehousing KPI Dashboard Work?
The dashboard uses an Excel file as the data source. This makes it easy for any warehouse team to maintain the numbers without technical skills. You fill the Actual, Target, and KPI Definition sheets, and Power BI shows all visuals automatically.
The dashboard also includes slicers so users can select:
- Month
- KPI Group
- KPI Name
After selecting these fields, the dashboard updates all KPI cards, charts, and tables instantly. This helps warehouse teams understand what is going well and what needs improvement.
Page-by-Page Explanation of Warehousing KPI Dashboard in Power BI
Now let us explore each page in detail.
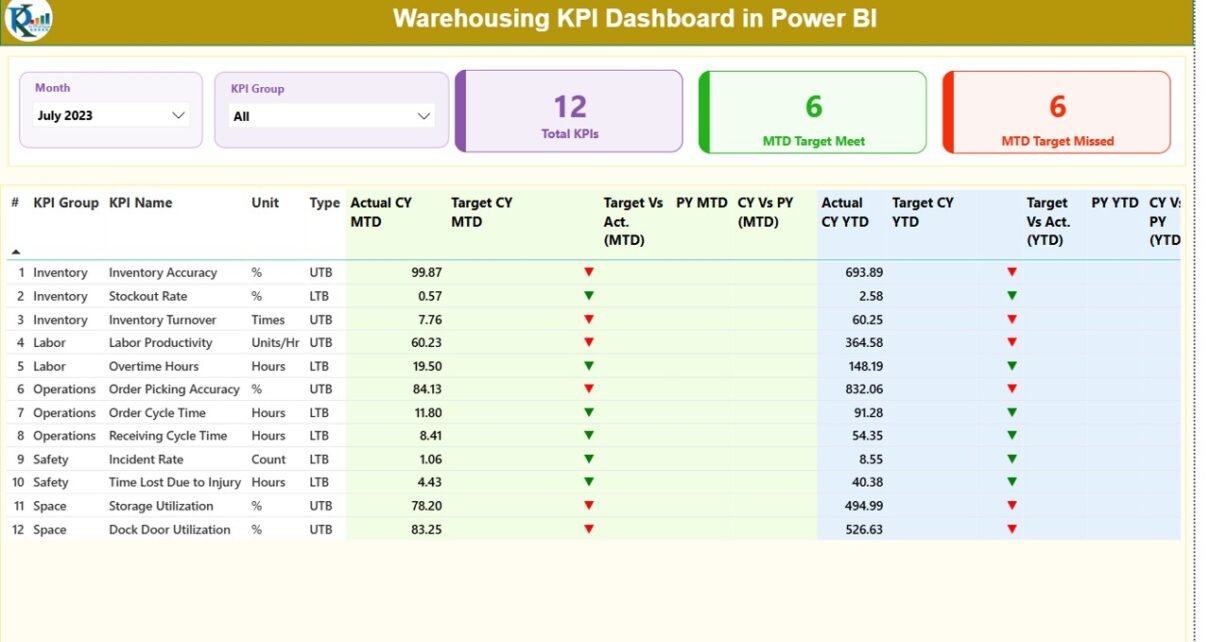
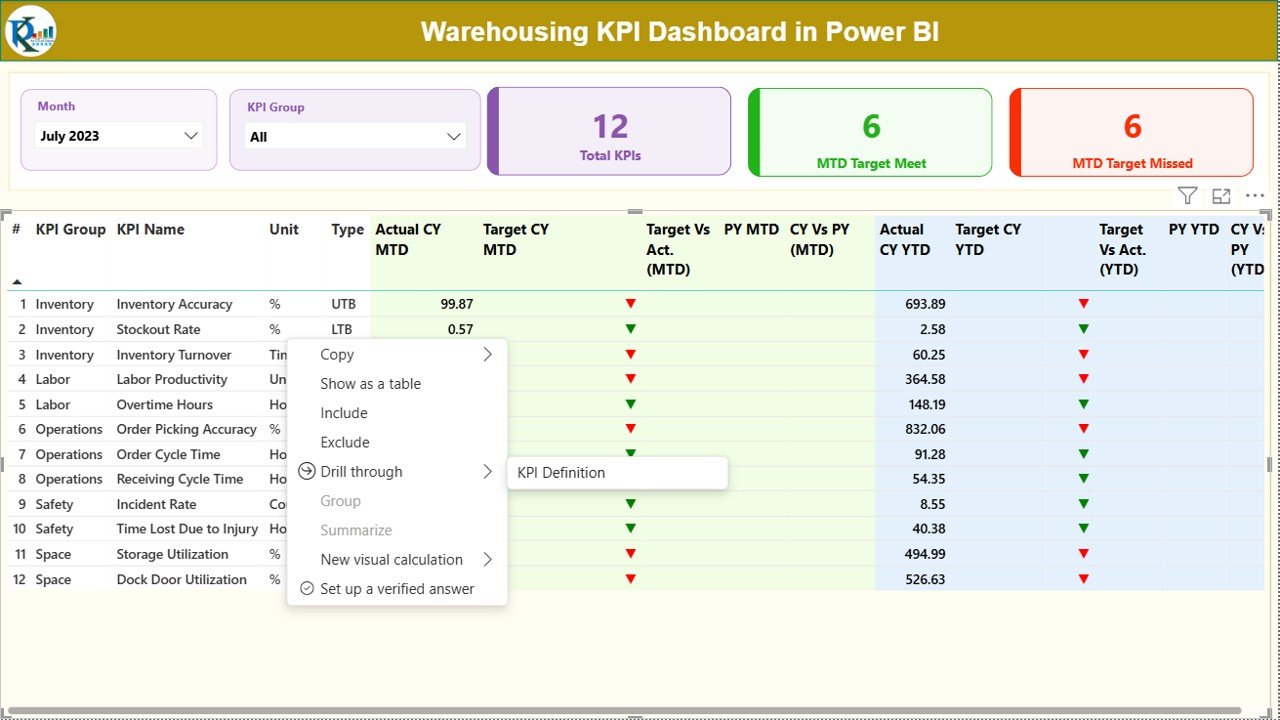
Summary Page – Your Complete Warehouse Overview
The Summary Page is the main page of the dashboard. It gives a clear and quick view of all warehouse KPIs. You can use this page to check performance for a specific month and compare it with targets and last year’s values.
🔹 Key Features of the Summary Page
Month Slicer and KPI Group Slicer
You choose any month, and the dashboard updates instantly. You also choose a KPI Group such as:
- Inventory KPIs
- Order Processing KPIs
- Receiving KPIs
- Shipping KPIs
- Warehouse Productivity KPIs
This makes navigation smooth and fast.
KPI Cards at the Top
The top section displays three important cards:
- Total KPIs Count
- MTD Target Met Count
- MTD Target Missed Count
These cards help you understand the overall health of the warehouse within seconds.
Detailed KPI Performance Table
Below the cards, the dashboard shows a detailed performance table. It displays every KPI with monthly and yearly comparisons. Here is what the table includes:
- KPI Number – Serial number
- KPI Group – Category of KPI
- KPI Name – Name of the indicator
- Unit – Unit of measurement (Hours, %, Count)
- Type (LTB/UTB) – Lower the Better or Upper the Better
- Actual CY MTD – Current Month Actual
- Target CY MTD – Current Month Target
- MTD Icon – Up/Down arrow to show performance
- Target vs Actual (MTD %)
- PY MTD – Previous Year’s MTD
- CY vs PY (MTD %)
- Actual CY YTD – Year-to-Date Actual
- Target CY YTD – Year-to-Date Target
- YTD Icon – Up/Down arrow for YTD performance
- Target vs Actual (YTD %)
- PY YTD – Previous Year’s YTD
- CY vs PY (YTD %)
This detailed table makes performance evaluation extremely clear because it shows all metrics in one place.

Click to buy Warehousing KPI Dashboard in Power BI
KPI Trend Page – Visualize Monthly and Yearly Trends
The KPI Trend Page helps warehouse managers compare Actual, Target, and Previous Year values for each KPI. You can select a KPI from a slicer on the left, and the charts show:
- MTD performance trend
- YTD performance trend
What You See on the Trend Page
- Two combo charts
- One chart for monthly numbers (MTD)
- One chart for yearly numbers (YTD)
- Clear comparison between current year, previous year, and targets
These visuals help you understand patterns, seasonal fluctuations, and improvement opportunities.

Click to buy Warehousing KPI Dashboard in Power BI
KPI Definition Page – Understand Every KPI Clearly
This page is hidden and works as a drill-through page. When you right-click a KPI on the Summary Page and drill through, you see:
- KPI Number
- KPI Group
- KPI Name
- Unit
- Formula
- KPI Definition
- Type (LTB or UTB)
This page helps new team members understand the meaning and logic behind each KPI.
You return to the main page by clicking the back button on the top left.

Click to buy Warehousing KPI Dashboard in Power BI
Excel Data Structure for This Dashboard
The dashboard uses three worksheets inside the Excel data source.
Input_Actual Sheet
Here you fill:
- KPI Name
- Month (First date of the month)
- MTD Actual
- YTD Actual
This sheet shows the real performance numbers.
Input_Target Sheet
Here you fill:
- KPI Name
- Month (First date of the month)
- MTD Target
- YTD Target
This sheet helps teams compare actual values with targets.
Click to buy Warehousing KPI Dashboard in Power BI
KPI Definition Sheet
Here you enter:
- KPI Number
- KPI Group
- KPI Name
- Unit
- Formula
- Definition
- Type (LTB/UTB)
This creates a complete KPI dictionary for the dashboard.
Advantages of Warehousing KPI Dashboard in Power BI
Warehouse operations become easier when managers follow a structured dashboard. Here are the main advantages.
Real-Time Warehouse Performance Visibility
You get accurate numbers for MTD and YTD performance without manual work.
Faster Decision-Making
Because trends update automatically, teams make decisions within minutes instead of hours.
Clear Comparison with Targets
You instantly see whether performance meets expectations.
Improved Accuracy
You reduce human errors because all calculations come from structured formulas.
Better Inventory Control
You understand stock movement, order completion speed, and warehouse delays.
Higher Productivity
Managers identify delays and take quick action to improve workflow.
Transparent KPI Definitions
The drill-through page makes KPI definitions easier for new employees.
Reduced Operational Costs
Clear insights lead to better planning, fewer errors, and lower cost per order.
Opportunities for Improvement in Warehousing KPI Tracking
Even though dashboards make reporting easier, warehouse teams can improve in several areas:
- Improve data accuracy by training staff
- Add more KPI categories such as labor productivity or equipment utilization
- Automate Excel data entry using forms or barcode tools
- Integrate with WMS systems for faster updates
- Add forecasting visuals for future inventory needs
- Monitor exceptions like delays or stockouts more closely
These improvements help the warehouse become smarter over time.
Best Practices for Using a Warehousing KPI Dashboard in Power BI
To get the best results from your dashboard, follow these practices:
Maintain Data Every Month
Consistent data entry keeps KPIs accurate and reliable.
Use Standard KPI Definitions
When all teams follow the same definitions, comparisons become meaningful.
Review Trends, Not Just Numbers
Trends help you understand long-term changes in warehouse behavior.
Track Both MTD and YTD
Monthly numbers show recent performance while YTD numbers show overall progress.
Train Your Team
Teach warehouse leaders how to use the slicers, charts, and drill-through features.
Update Targets Regularly
Set new targets when operational conditions change.
Add New KPIs When Needed
Warehousing needs evolve, so new KPIs help measure new goals.
Keep the Excel File Clean
Clean, structured data ensures smooth Power BI updates.
Conclusion
A Warehousing KPI Dashboard in Power BI brings clarity, speed, and accuracy to warehouse operations. It reduces manual reporting and allows managers to make faster decisions. The three dashboard pages—Summary, KPI Trend, and KPI Definition—give clear visibility into performance for every warehouse activity. Because it uses Excel data, the system remains simple and flexible.
Whether you manage inbound, outbound, storage, inventory, or overall warehouse operations, this dashboard becomes a powerful reporting tool. It supports teams, improves productivity, and creates a strong foundation for smarter warehouse management.
Frequently Asked Questions (FAQs)
- What is a Warehousing KPI Dashboard in Power BI?
It is an analytical dashboard that tracks warehouse performance indicators using Excel data and Power BI visuals.
- Who can use this dashboard?
Warehouse managers, operations teams, logistics departments, and supply chain analysts use this dashboard for decision-making.
- What KPIs does the dashboard track?
It tracks inventory accuracy, order cycle time, picking accuracy, receiving performance, dispatch delays, and many more.
- Do I need technical skills to maintain the data?
No. You only update the numbers in three Excel sheets: Actual, Target, and KPI Definition.
- Does the dashboard update automatically?
Yes. When you refresh the data, all visuals, slicers, and charts update instantly.
- Can I add more KPIs?
Yes. You add KPIs in the KPI Definition sheet and update the target and actual sheets.
- Can new team members understand the KPIs easily?
Yes. The KPI Definition page shows formulas and definitions clearly through a drill-through feature.
- Why are MTD and YTD comparisons important?
They help teams understand both short-term and long-term performance.
Visit our YouTube channel to learn step-by-step video tutorials
Watch the step-by-step video tutorial:
Click to buy Warehousing KPI Dashboard in Power BI