Every water plant I have ever walked into keeps the same two records: a spiral notebook in the van, and the owner’s memory. The notebook says twelve cans went to Blue Star Cafe on Tuesday. The memory says the cafe still owes for last week. Neither survives a dispute, and neither tells you at a glance how much money is sitting out on the route.
The Water Can Delivery Data Entry System in Excel is a small, honest fix for exactly that. It is a four-sheet macro-enabled workbook – one form, one table, four stat cards, three editable dropdown lists – that turns the day book into something you can filter, total and argue from. This post walks through every sheet, shows you the formula behind each card, and tells you plainly which cards count what their labels imply and which do not.
Key Features of the Water Can Delivery Data Entry System in Excel
- A seven-field entry form – Customer, Delivery Date, Delivery Area, Cans Delivered, Amount, Delivery Boy and Payment Status, all visible at once, no scrolling.
- Four VBA buttons – Add, Update, Delete and Reset, wired to real macros rather than to instructions telling you to copy a row.
- Automatic Record IDs – WCD-0001 upward. Two customers called “Sharma Residence” stay separable forever.
- An Entry TimeStamp on every row – kept separate from the Delivery Date, which is the difference between a log and an audit trail.
- Four live stat cards – Total Deliveries, Total Revenue, Cans Delivered and Pending Payments, linked pictures of real formula cells that refresh as you type.
- Three editable lists – 12 delivery areas, 10 delivery staff, 5 payment statuses, all on the Setting sheet.
- Ten-column delivery table starting at row 15, with dropdowns applied directly in the grid as well as in the form.
- Entirely offline – no account, no subscription, no per-driver fee, nothing leaves your PC.
Sheet-by-Sheet Walkthrough
1. Data Entry – the sheet you actually live in
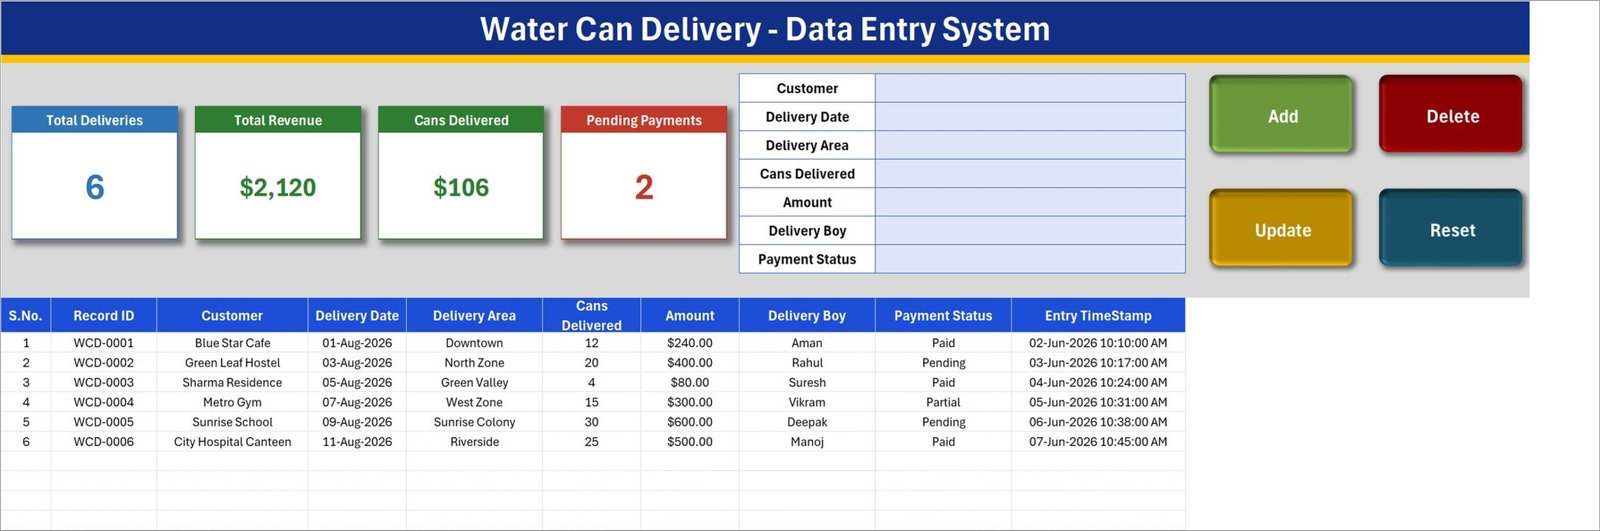
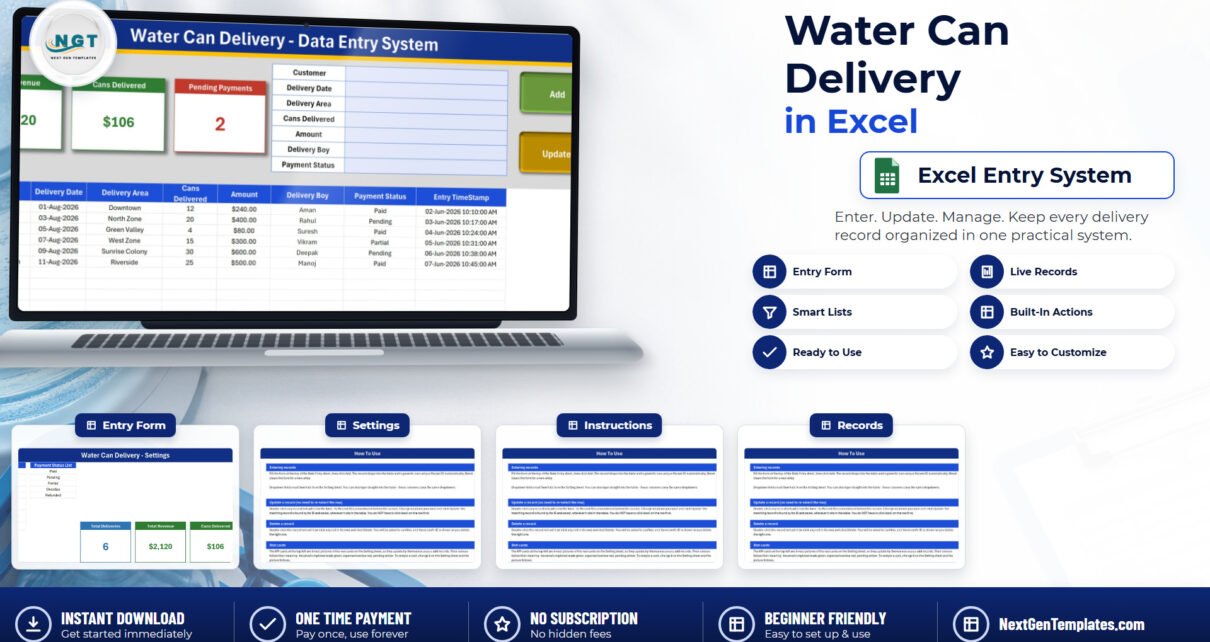
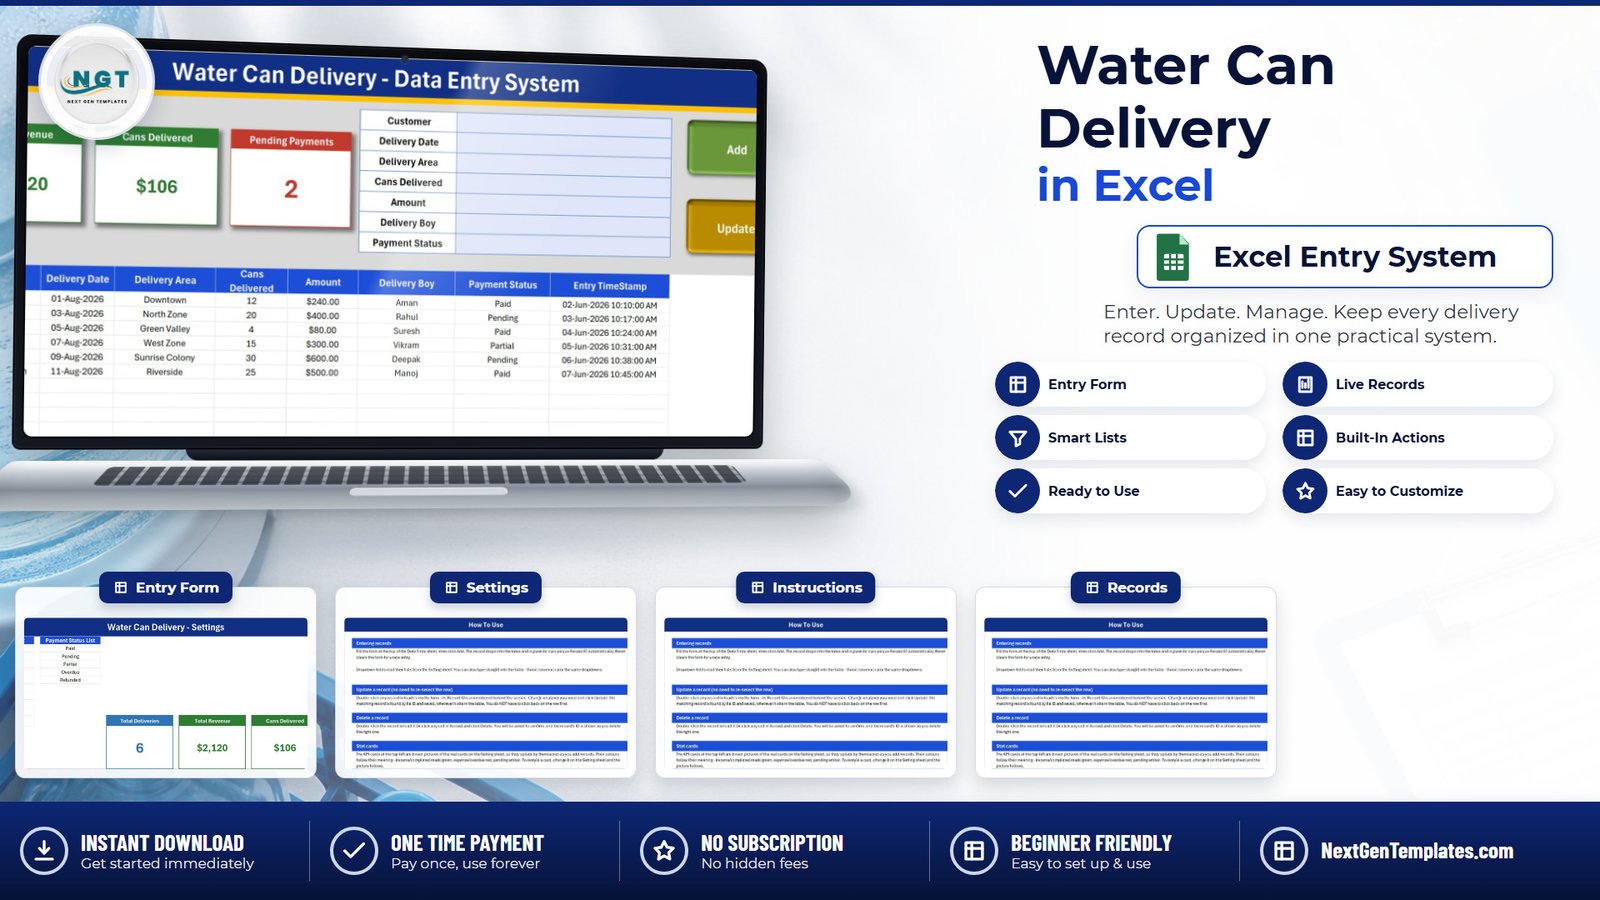
The layout is deliberately boring, which is the point. Four stat cards run along the top left. The seven-field form sits in the centre. Add, Delete, Update and Reset are four coloured buttons on the right. Below all of it, from row 15 down, is the delivery table: S.No., Record ID, Customer, Delivery Date, Delivery Area, Cans Delivered, Amount, Delivery Boy, Payment Status, Entry TimeStamp.
The six shipped sample rows show the shape of a normal day – Blue Star Cafe took 12 cans for $240 in Downtown, Sunrise School took 30 for $600 in Sunrise Colony, City Hospital Canteen took 25 for $500 on Riverside. The Update flow is the part worth appreciating: double-click any row and it loads back into the form, the workbook quietly remembers the Record ID it loaded, and Update finds that row again by ID wherever it has since been sorted to. You never have to click back on the row first.
2. Setting – the lists and the real cards
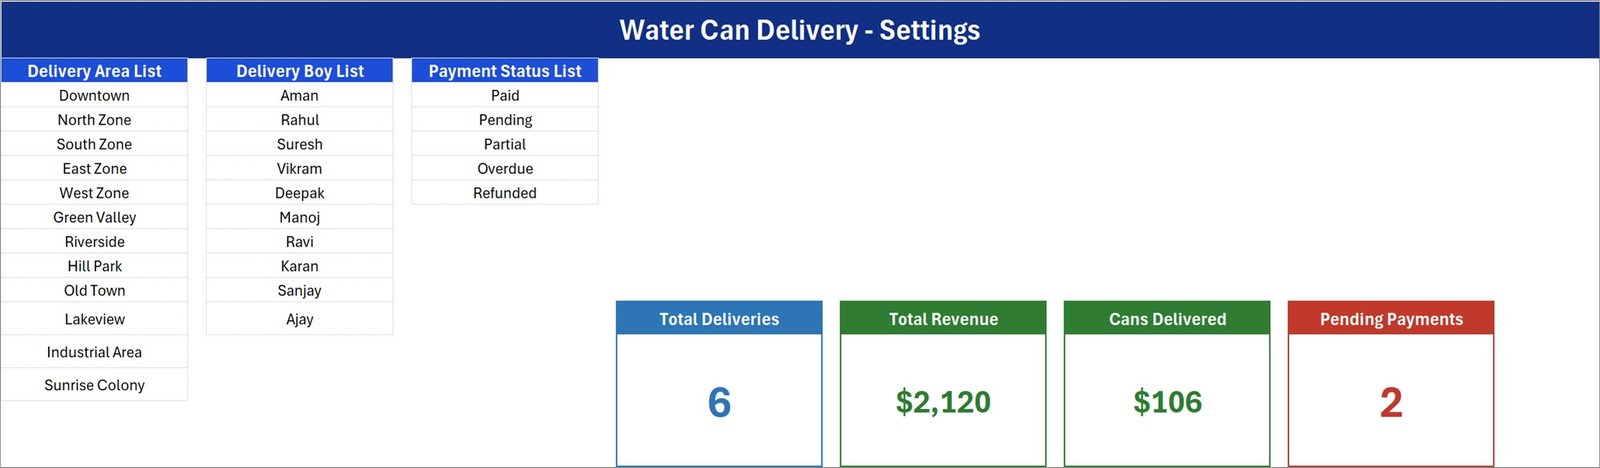
Three lists live here. Delivery Area List ships with Downtown, North Zone, South Zone, East Zone, West Zone, Green Valley, Riverside, Hill Park, Old Town, Lakeview, Industrial Area and Sunrise Colony. Delivery Boy List ships with Aman, Rahul, Suresh, Vikram, Deepak, Manoj, Ravi, Karan, Sanjay and Ajay. Payment Status List ships with Paid, Pending, Partial, Overdue and Refunded.
To the right sit the four real KPI cards. The cards you see on the Data Entry sheet are linked pictures of these, which is why they update by themselves and why restyling a card means restyling it here. Their formulas are worth reading, because two of them do something narrower than their labels suggest – see Opportunities for Improvement below.
3. Instructions – the built-in How To Use page
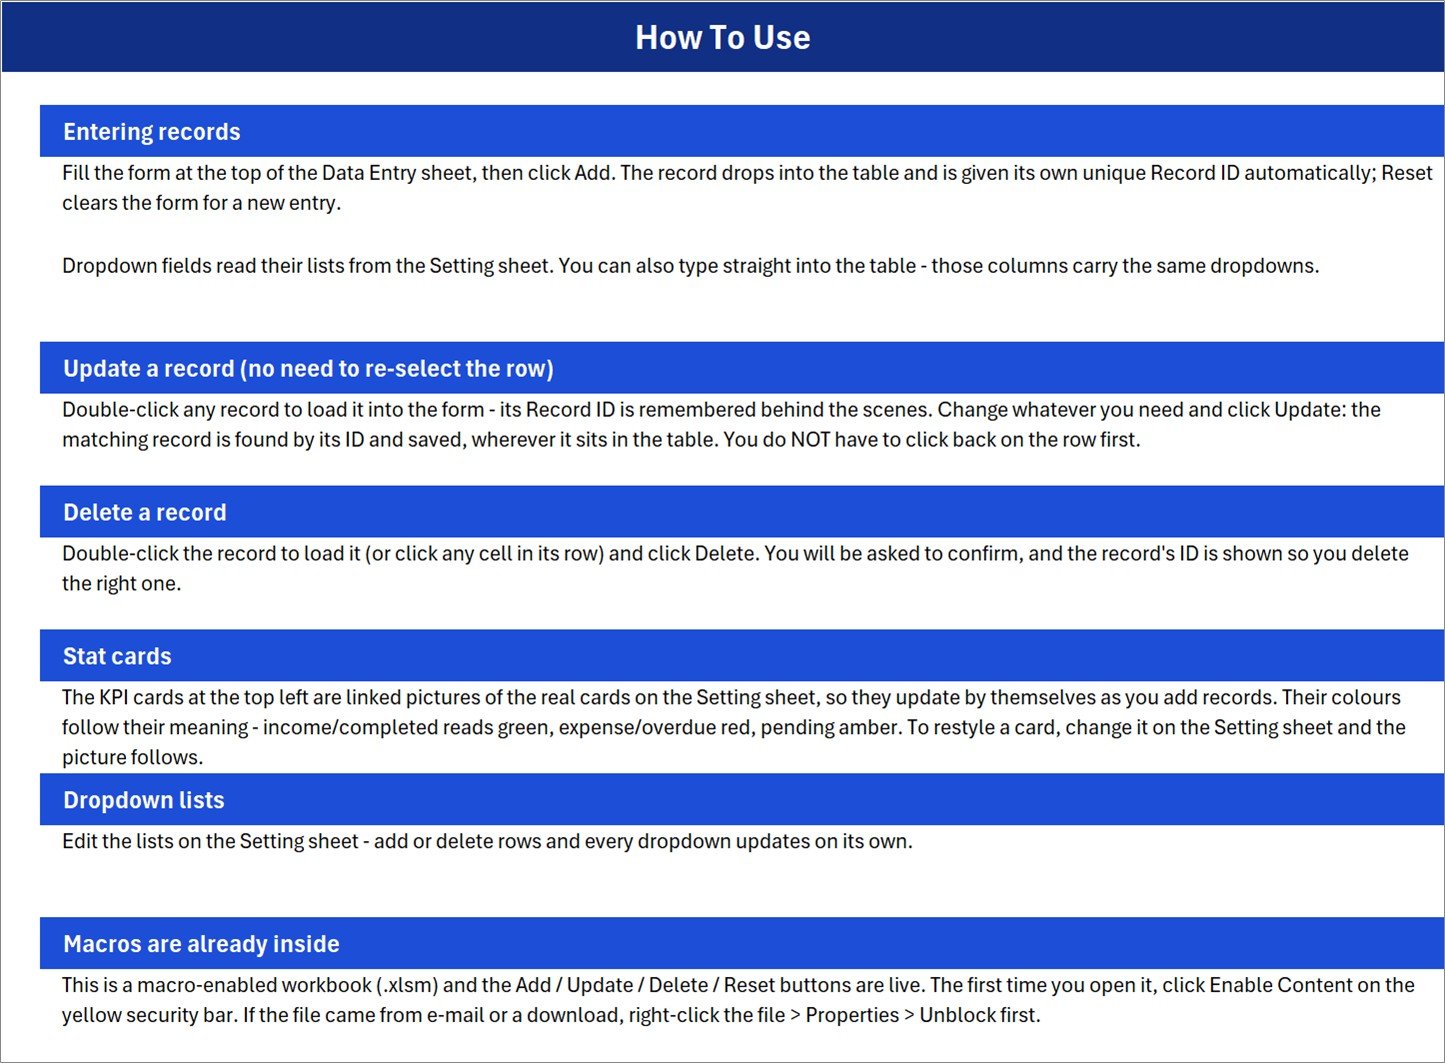
Six short sections: entering records, updating a record without re-selecting the row, deleting a record safely, how the stat cards work, editing the dropdown lists, and enabling macros. There is no separate PDF manual in the download – for this family of templates the Instructions sheet is the manual, which is normal rather than an omission.
4. Get More Templates
A single linking sheet back to the NextGenTemplates catalogue. Nothing to configure.
Water Can Delivery in Excel vs. a Google Sheets Log vs. Subscription Delivery Software
| This Excel system | A Google Sheets log | Subscription delivery software | |
|---|---|---|---|
| Cost | One payment, no renewal | One payment, no renewal | Roughly $15-$60 per month, often per driver |
| Platform | Excel for Windows desktop, macros on | Browser, any device | Web plus a driver phone app |
| Setup time | Under 5 minutes | Under 5 minutes | Account, route import, driver onboarding |
| One-click Add / Update / Delete | Yes – four VBA buttons | No – you type into the grid | Yes |
| Driver app and GPS proof of delivery | No | No | Yes |
| Route optimisation | No | No | Yes |
| Invoicing and payment reminders | No – you record the status, it sends nothing | No | Yes |
| Empty-can and deposit reconciliation | No – cans out only | Only if you build it | Usually yes |
| Real-time collaboration | No – single user, one file | Yes | Yes |
| Works with no internet | Yes | No | No |
| Where the data lives | On your own PC | In your Google Drive | On the vendor’s servers |
Who Should Use This Template
It suits a single water plant or depot filling twenty to two hundred cans a day; a distributor running two to ten delivery staff on fixed area routes; a bottled-water franchise that needs a dated record of who delivered what to whom; and an office or society manager reconciling a supplier’s monthly bill against what actually arrived at the gate.
It does not suit anyone who needs a driver phone app, GPS proof of delivery or route optimisation. It raises no invoices and sends no reminders. It does not track empty cans returned or deposits held – Cans Delivered records cans out, and nothing records cans back, which matters if bottle deposits are a real liability in your business. It is single-user. And the buttons are VBA, so it needs Excel on Windows desktop.
Real-World Use Cases
Ramesh, one plant and three vans. Each driver hands in a slip at the end of the route. Ramesh types the six or seven deliveries per van into the form, picking area and driver from the dropdowns, and closes the day book by 8pm. Sorting the table by Delivery Boy gives him one screen per driver for cash settlement.
Anita, township distributor. She works by area rather than by driver. Filtering Delivery Area to “Sunrise Colony” produces every can that entered the colony this month – which is precisely what the residents’ committee asks for when the bill is queried.
Vikas, chasing payment. Friday afternoons he filters Payment Status to Pending and Partial and works the list by phone. The Pending Payments card gives him the headline count before he starts; the Amount column gives him the number to quote.
Advantages of the Water Can Delivery Data Entry System
- The Update-by-ID behaviour is genuinely good. Most home-made Excel forms lose track of which row you are editing the moment the table is sorted. This one does not.
- Dropdowns are applied in the table as well as in the form, so a fast typist who prefers the grid still gets clean, consistent area and driver values.
- Cans and money on the same row means route profitability is a two-column question, not a reconstruction exercise.
- Nothing to log into. No connectivity, no account, no monthly bill that scales with the number of drivers.
- The stat cards are pictures of real cells, so restyling them is a formatting job on the Setting sheet rather than a VBA job.
Opportunities for Improvement
I would rather you knew these before you download than discover them in month two. All five are small, all five are fixable in minutes, and none of them corrupts data.
- Total Revenue is an unfiltered SUM of the whole Amount column. The formula is
=SUM('Data Entry'!G15:G1048576)– Payment Status plays no part in it. In the six sample rows the card reads $2,120, which is everything billed. Only $820 of that sits on rows marked Paid; $1,000 is Pending and $300 is Partial. Read the card as “value delivered”, not “cash collected”. If you want collected-only revenue,=SUMIF('Data Entry'!I15:I1048576,"Paid",'Data Entry'!G15:G1048576)gives it in one cell. - Only one of the five payment statuses is carded. Pending Payments is
=COUNTIF('Data Entry'!I15:I1048576,"Pending"). Paid, Partial, Overdue and Refunded have no card at all, so the carded numbers can never reconcile to Total Deliveries: the sample shows Pending 2 against a total of 6, with 3 Paid and 1 Partial invisible. Each missing card is a one-line COUNTIF on the Setting sheet. - Total Deliveries counts the Customer column, not Record ID. It is
=COUNTA('Data Entry'!C15:C1048576), and column C is Customer – a free-text field. Every row added through the form has a customer name, so in normal use the figure is right; but a row typed straight into the grid without a name is stored and silently uncounted. Repointing that one formula at the Record ID column in B makes the card count every saved row. - The dropdown lists are already exactly full. This is the one that catches people out, because the Instructions sheet says “add or delete rows and every dropdown updates on its own” – which is only true for deleting and renaming. The three named ranges are fixed:
Delivery_AreaListis Setting!$A$3:$A$14 with all 12 areas used,Delivery_BoyListis $C$3:$C$12 with all 10 names used,Payment_StatusListis $E$3:$E$7 with all 5 statuses used. Type a thirteenth area into A15 and no dropdown will ever show it. The fix is Formulas > Name Manager: select the name, extend the range over your new rows, click OK. Give yourself twenty spare rows the first time and you will never think about it again. - The Cans Delivered card wears a currency format. 106 cans displays as $106 because the card inherited the number format of Total Revenue beside it. The value is correct – 12 + 20 + 4 + 15 + 30 + 25 = 106 – only the format is wrong. Set the source cell on the Setting sheet to General and the linked picture follows.
One more thing that is a boundary rather than a bug: the dropdowns are applied to rows 15 to 214, a ceiling of 200 records. The card formulas already read the entire column, so delivery 201 is still counted and totalled – only the dropdowns stop. Drag the data validation down when you get there.
Best Practices
- Set the lists up before the first entry. Replace the twelve areas and ten names with your own, extend the named ranges to leave spare rows, and only then start typing deliveries. Renaming an area after two hundred rows exist means find-and-replace.
- Delete the six sample rows once you have used them to understand the flow.
- Enter deliveries daily, not weekly. The Entry TimeStamp is only evidence if it is close to the delivery.
- Add the four missing status cards on day one if payment chasing is why you bought this. Four COUNTIFs and the top of the sheet tells the whole story.
- Back the file up. It is one .xlsm on one PC – that is the trade for having no subscription and no cloud. A weekly copy to a second drive is the whole disaster-recovery plan.
- Keep Delivery Date and Entry TimeStamp distinct. Backdating a delivery is fine; backdating the timestamp defeats the purpose.
Explore Relevant Templates
- Relief Distribution Data Entry System in Excel – the same build, aimed at goods handed out at camps rather than sold on a route.
- Bar Stock Register Data Entry System in Excel – the stock-side sibling, for when what you need to count is what came back.
- Fertilizer Usage Data Entry System in Excel – quantity-plus-cost logging by plot instead of by customer.
- Courier & Parcel Delivery Management System Web App – the multi-user step up, when one file on one PC stops being enough.
- Last-mile Delivery Dashboard in Excel – analytics rather than a day book, once a year of deliveries has accumulated.
Frequently Asked Questions
Does Total Revenue show money I have collected?
No. It is an unfiltered sum of the whole Amount column and ignores Payment Status completely, so it reports total value delivered. In the sample it reads $2,120 while only $820 sits on Paid rows. A single SUMIF on the Payment Status column gives you collected-only revenue.
Why don’t the stat cards add up to the number of deliveries?
Because only one status is carded. Pending Payments is a COUNTIF for “Pending” alone; Paid, Partial, Overdue and Refunded rows are counted in Total Deliveries and in no card. The individual numbers are correct – they were never built to reconcile.
What does Total Deliveries actually count?
A COUNTA over the Customer column, not the Record ID column. Rows added through the form always have a customer name so the figure is right in normal use, but a row typed into the grid with the name left blank is stored and never counted.
I added a new delivery area and it is not in the dropdown. Why?
Because the named range behind the dropdown is a fixed size and is already exactly full – all 12 rows of Delivery_AreaList are in use. Open Formulas > Name Manager, extend the range to cover your new rows, and the dropdown picks them up immediately. The same applies to the Delivery Boy and Payment Status lists.
What happens after 200 records?
The dropdowns stop at row 214, which is record 200. Everything else keeps working – the stat cards read the whole column, so later rows are counted and totalled normally. Select the validated range and drag it down when you approach the limit.
Does it track empty cans or deposits?
No. Cans out are recorded; cans back are not. There is no returns column, no deposit ledger and no per-customer can balance. If that is your core problem, add a column of your own or use a stock-register template alongside it.
Do I need macros enabled?
Yes. This is a macro-enabled .xlsm workbook and the Add, Update, Delete and Reset buttons are VBA. Click Enable Content on the yellow bar on first open, and if the file came from e-mail or a download, right-click it, choose Properties and tick Unblock first.
Will it work on Mac, on the web, or on my phone?
You can open and read it anywhere, but the four buttons need Microsoft Excel on Windows desktop. Excel for the web, Excel for Mac and the mobile apps do not run VBA. The table, lists, cards and dropdowns behave as ordinary Excel everywhere.
About the Author
Written by PK – Microsoft Certified Professional with 15+ years of Excel, Google Sheets and Power BI experience, founder of NextGenTemplates, reaching 300K+ subscribers across YouTube channels. Every template is hand-built and opened before it is written about.
Conclusion
The Water Can Delivery Data Entry System is not delivery software and does not pretend to be. It is a well-built day book: a form that does not lose your place, IDs that survive sorting, timestamps that survive argument, and three lists you can bend to your own routes in five minutes. The five rough edges above are real, and they are all small – an unfiltered revenue card, four missing status cards, a COUNTA pointed one column off, three named ranges that need widening before they will grow, and a stray dollar sign on a can count. Fix the two that matter to you and this becomes the record your business has been keeping in a notebook.
Get it here: Water Can Delivery Data Entry System in Excel.
Last updated: 31 August 2026.