In today’s world, efficient water management is essential for ensuring sustainability, reliability, and customer satisfaction. Whether it’s a municipal water department, private utility company, or infrastructure monitoring team, having clear visibility into performance metrics can help make smarter decisions.
That’s where the Water Supply KPI Scorecard in Excel becomes a game-changer. This ready-to-use tool allows you to measure, analyze, and improve key performance indicators (KPIs) that define your organization’s success in water supply operations.
This article explains everything you need to know about the Water Supply KPI Scorecard — its structure, benefits, and best practices — along with insights on how you can use it to monitor performance month-to-month and year-to-date.
Click to Purchases Water Supply KPI Scorecard in Excel
🌊 What Is a Water Supply KPI Scorecard in Excel?
A Water Supply KPI Scorecard in Excel is an interactive and data-driven performance dashboard built using Microsoft Excel. It helps organizations monitor essential KPIs related to water production, distribution, quality, cost efficiency, and service delivery.
The scorecard consolidates all your performance data into one interface, making it easy to track trends, compare actual results against targets, and identify areas needing improvement.
You can switch between Month-to-Date (MTD) and Year-to-Date (YTD) views, use dropdown filters to focus on specific time periods, and visualize performance using color-coded charts or conditional formatting.
🧩 Structure of the Water Supply KPI Scorecard Template
This template includes four well-structured worksheets — each serving a unique purpose in the performance monitoring process.
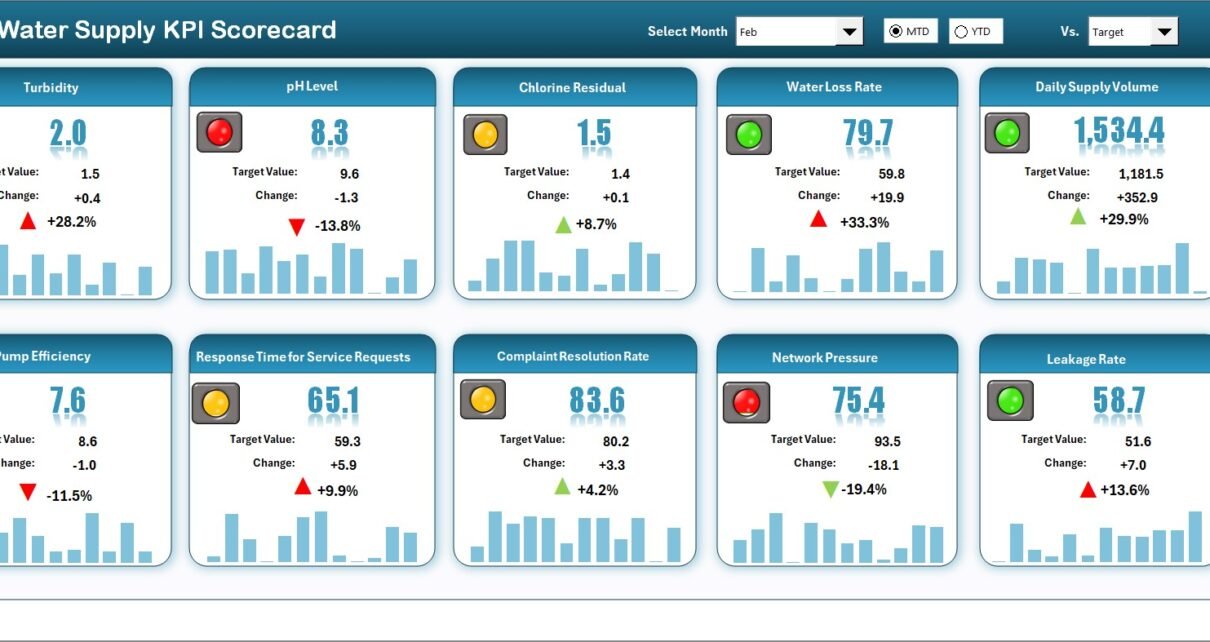
1. 📊 Scorecard Sheet (Main Dashboard)
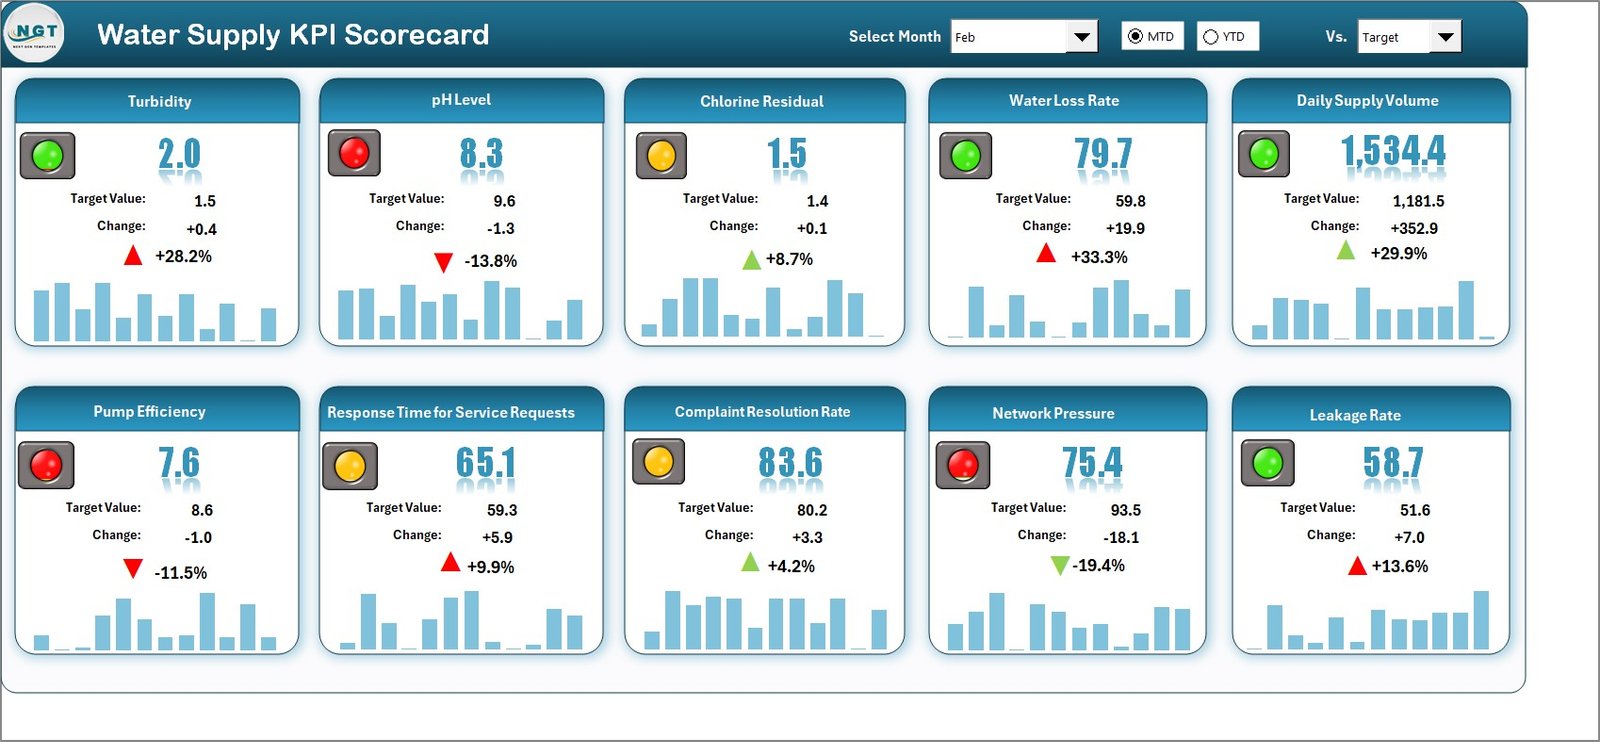
The Scorecard Sheet is the central hub of the template. It provides a quick overview of your KPIs, giving you actionable insights at a glance.
Key Features:
-
Dropdown Menus: Choose a specific month or view MTD/YTD data to understand short-term and long-term performance.
-
Actual vs. Target Comparison: Instantly see how your performance measures up against goals.
-
Color-Coded Indicators: Green, yellow, and red formatting visually show whether a KPI is on track, at risk, or below target.
-
Compact Design: Displays multiple KPIs (usually 10 per view) to ensure easy navigation and clarity.
This sheet acts as the main performance dashboard for managers and analysts, allowing for real-time decision-making.
2. 📈 KPI Trend Sheet
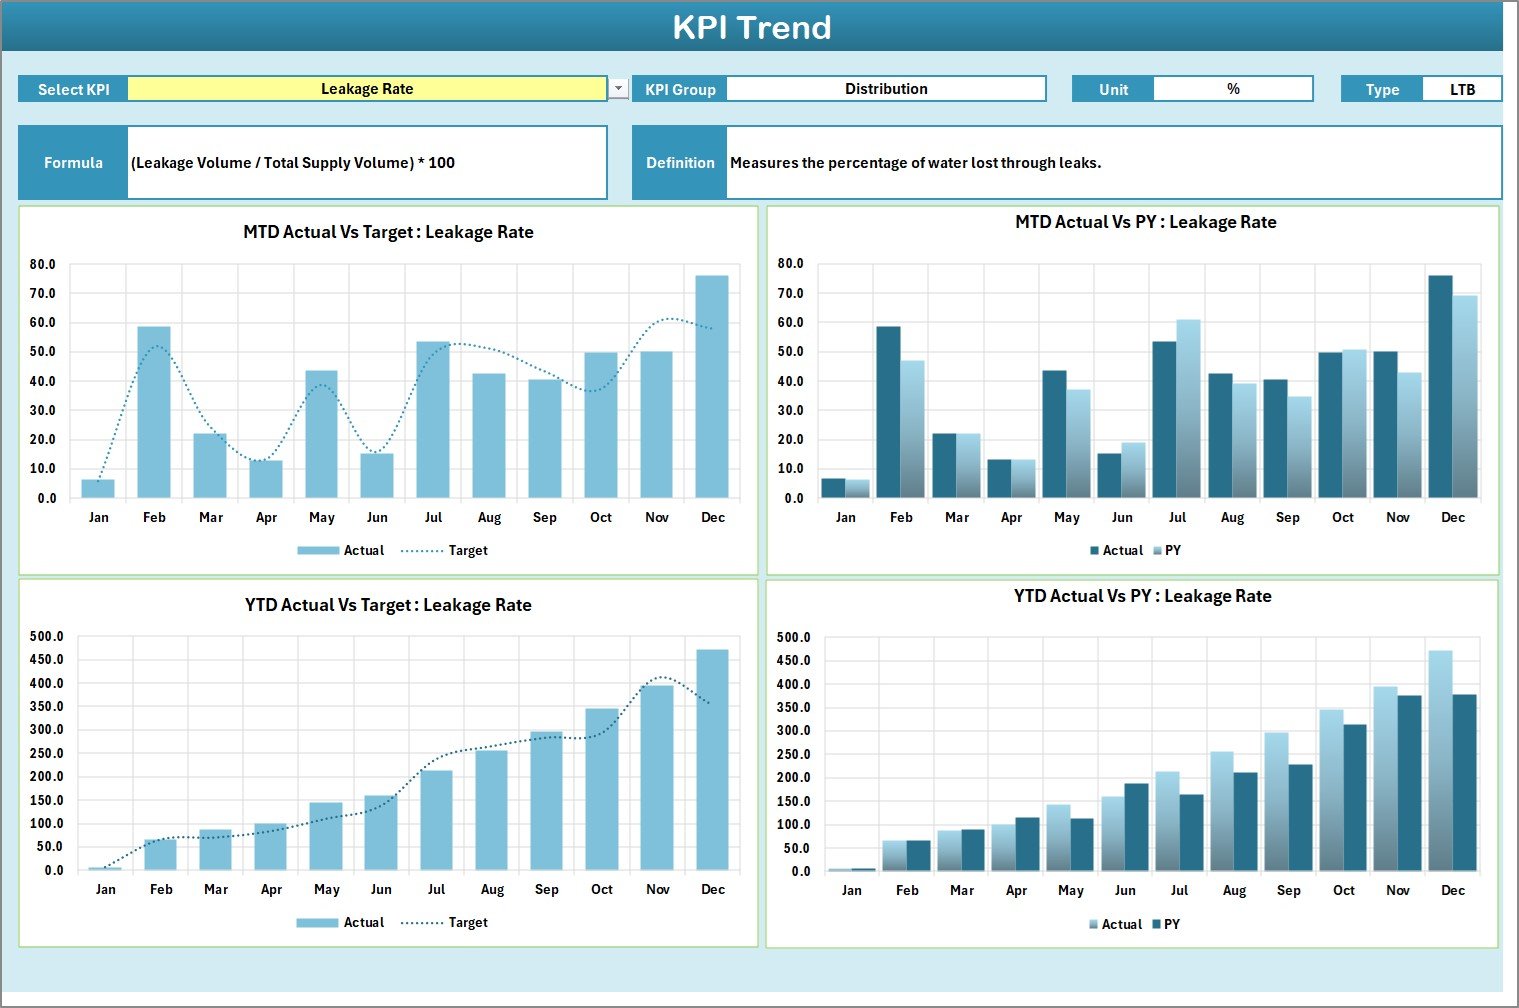
The KPI Trend Sheet focuses on the historical performance of individual KPIs.
Features and Functions:
-
Dynamic Dropdown (Cell C3): Select a KPI to view its trend.
-
Information Display: Automatically shows the KPI group, unit, type (Lower-the-Better or Upper-the-Better), and formula.
-
Trend Charts: Visualize the actual, target, and previous year (PY) values for both MTD and YTD.
-
Comparative Analysis: Track progress over time to identify consistent performers and areas of decline.
This page is especially useful for trend analysis and reporting, helping you demonstrate improvements over multiple months or years.
3. 🧾 Input Data Sheet
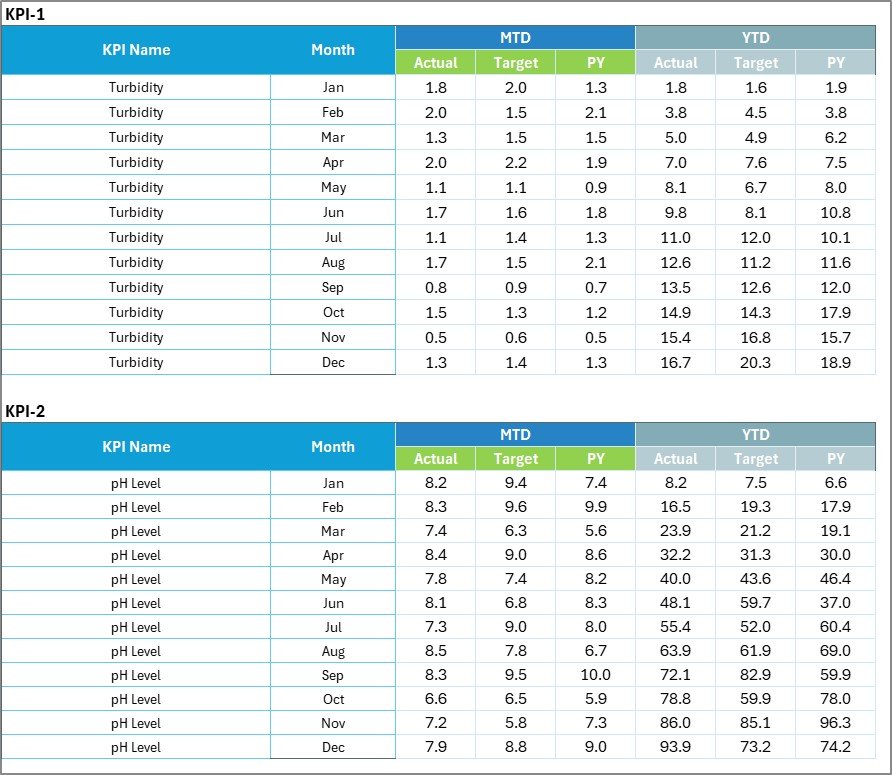
The Input Data Sheet is the backbone of the scorecard. It’s where you enter or import your raw performance data.
Highlights:
-
Data Entry Flexibility: Add monthly data for each KPI, including actual, target, and previous year metrics.
-
Easy Updating: Replace or update data anytime without altering dashboard formulas.
-
Accurate Calculations: Automatically updates MTD and YTD performance once new data is added.
This sheet ensures that your scorecard always reflects the latest and most accurate information.
4. 📘 KPI Definition Sheet
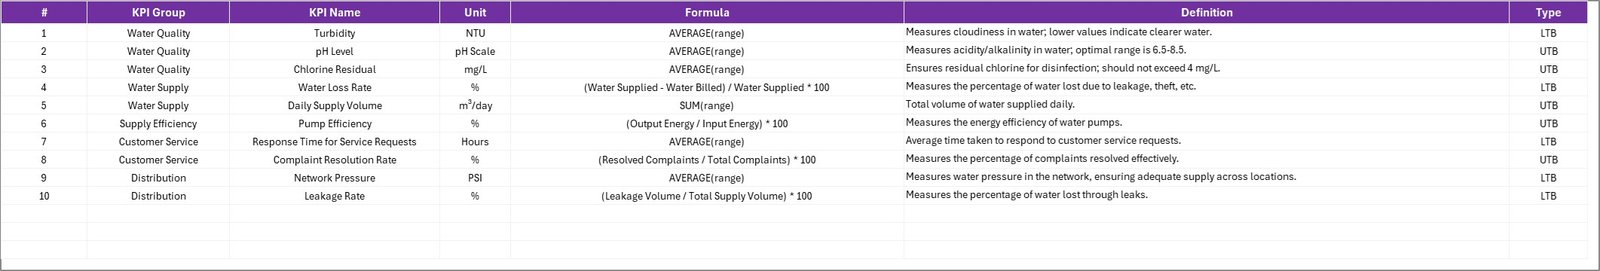
The KPI Definition Sheet provides clarity and consistency for all your key metrics.
Details Included:
-
KPI Name and Group: Helps categorize each performance metric (e.g., Production Efficiency, Water Quality, Financial Performance).
-
Unit of Measurement: Defines whether the KPI is measured in liters, percentages, or currency.
-
Formula and Definition: Explains how the KPI is calculated and what it represents.
By maintaining clear definitions, you ensure everyone in the organization understands how each KPI contributes to overall performance.
Click to Purchases Water Supply KPI Scorecard in Excel
💡 Why Is KPI Tracking Important in Water Supply Management?
Effective water management depends on data-driven monitoring. KPIs help translate raw operational data into actionable insights that decision-makers can easily understand.
Common KPI categories in water supply operations include:
-
Production Efficiency: Volume of water produced per energy unit or cost.
-
Distribution Losses: Percentage of non-revenue water (leakages or unauthorized consumption).
-
Customer Service: Response time to complaints or average repair duration.
-
Water Quality: Compliance with safety and purity standards.
-
Financial Health: Cost per liter distributed, revenue collection rate, and energy expenditure.
Monitoring these KPIs ensures you maintain supply reliability, reduce wastage, and enhance customer satisfaction.
⚙️ How to Use the Water Supply KPI Scorecard
Using this Excel scorecard is simple and practical, even for non-technical users. Follow these steps:
-
Open the Template: Launch the file and navigate to the Input Data sheet.
-
Enter Monthly Data: Record your actual and target values for each KPI.
-
Update KPI Definitions: Add new metrics or modify existing ones if required.
-
Check the Scorecard Sheet: Analyze performance for any selected month.
-
Switch Between Views: Toggle MTD and YTD views to see short-term vs. long-term progress.
-
Review Trends: Use the KPI Trend sheet for historical analysis and presentations.
The process is entirely Excel-based, meaning you can customize, filter, and visualize without external tools.
Click to Purchases Water Supply KPI Scorecard in Excel
🧮 Why Use Excel for Water Supply KPI Tracking?
Excel remains one of the most versatile and accessible tools for KPI tracking and reporting. You don’t need expensive software to create meaningful dashboards.
Key reasons to use Excel:
-
Ease of Use: Most professionals already know how to use Excel.
-
Customization: Adapt the scorecard to your organization’s KPIs.
-
Integration: Import or export data from external systems.
-
Visualization: Use charts, conditional formatting, and slicers to make data intuitive.
-
Automation: Use formulas and dropdowns to minimize manual work.
With Excel, you can create a powerful performance monitoring system that suits organizations of all sizes — from small water boards to national utilities.
🌟 Advantages of Using a Water Supply KPI Scorecard in Excel
Implementing this scorecard brings a wide range of benefits to your operations:
✅ 1. Enhanced Decision-Making
Instantly view which KPIs meet targets and which require attention. Decision-makers can act proactively.
✅ 2. Improved Accountability
Every department knows their performance goals and results, promoting transparency and ownership.
✅ 3. Centralized Data Management
All KPIs, targets, and historical trends exist in one organized file, eliminating scattered reports.
✅ 4. Visual Insights
Color indicators and charts help users interpret data without reading lengthy tables.
✅ 5. Time Efficiency
Automated calculations and dashboards save hours spent on manual reporting.
✅ 6. Better Strategic Planning
Comparing YTD and MTD data supports strategic budgeting and resource allocation.
✅ 7. Cost-Effective Solution
Unlike specialized BI software, Excel offers similar analytical capability at zero additional cost.
💧 Real-World Applications of Water Supply KPI Scorecards
Water utilities and public departments across the globe use KPI scorecards to:
-
Reduce Non-Revenue Water (NRW): Track leaks, theft, and metering errors.
-
Monitor Quality Standards: Ensure compliance with WHO or national water safety guidelines.
-
Measure Customer Satisfaction: Evaluate response times and complaint resolution efficiency.
-
Optimize Energy Use: Identify areas for energy conservation in pumping and treatment plants.
-
Evaluate Financial Efficiency: Track cost recovery and billing collection performance.
By continuously reviewing these indicators, organizations maintain operational excellence and sustainability.
🧠 Best Practices for Using the Water Supply KPI Scorecard in Excel
To get the most accurate and actionable insights, follow these best practices:
-
Define Clear KPIs: Avoid vague or overlapping indicators. Keep each KPI measurable and relevant.
-
Set Realistic Targets: Base targets on historical data and achievable improvements.
-
Update Regularly: Enter new data monthly to maintain accuracy.
-
Use Visual Alerts: Conditional formatting helps highlight urgent issues.
-
Validate Data Sources: Always ensure input data is verified before analysis.
-
Conduct Periodic Reviews: Compare MTD, YTD, and PY data to spot long-term trends.
-
Train Your Team: Ensure all users understand KPI definitions and update methods.
-
Back Up the File: Protect your scorecard from accidental deletion or corruption.
-
Integrate with Other Tools: Export Excel data to Power BI or Google Sheets for advanced visualization.
-
Document Changes: Keep a version log when you modify KPI definitions or formulas.
🔍 Common Mistakes to Avoid
While working with KPI scorecards, teams often make errors that affect reliability. Avoid these pitfalls:
-
Using too many KPIs: Focus on 10-15 key metrics instead of tracking everything.
-
Ignoring data validation: Unverified data can mislead performance analysis.
-
Not reviewing definitions: KPI formulas should remain consistent over time.
-
Skipping trend analysis: Comparing only one month gives an incomplete picture.
-
Overcomplicating visuals: Keep the dashboard simple and meaningful.
📘 Example Use Case: City Water Board Implementation
A mid-sized city water board implemented the Water Supply KPI Scorecard in Excel to track its 12 monthly performance metrics.
After three months, they noticed:
-
A 12% reduction in leak repair time, improving customer satisfaction.
-
Energy savings of 8%, thanks to tracking energy cost per million liters produced.
-
A 5% improvement in water quality compliance, achieved by monitoring chlorine residual levels.
These results came simply by tracking, visualizing, and comparing KPIs consistently using this scorecard.
📈 How to Customize the Template
The Water Supply KPI Scorecard is fully editable in Excel. You can tailor it to your organization’s specific needs.
Customization Options:
-
Add or remove KPIs in the definition sheet.
-
Modify formulas to match your data structure.
-
Insert slicers or pivot charts for additional analysis.
-
Change color schemes or branding to reflect your organization.
-
Protect key sheets to prevent accidental formula changes.
By customizing it, you can transform this simple template into a professional-grade dashboard that fits your operational model.
Click to Purchases Water Supply KPI Scorecard in Excel
🧾 How Often Should You Review Your KPIs?
To ensure accurate and timely performance management:
-
Monthly: Review MTD progress and short-term goals.
-
Quarterly: Evaluate department-level trends and cumulative YTD data.
-
Annually: Conduct a comprehensive review comparing current performance with previous years.
Regular monitoring ensures early detection of inefficiencies and supports continuous improvement.
🏁 Conclusion
The Water Supply KPI Scorecard in Excel is more than just a spreadsheet — it’s a complete performance management framework for the water utility sector.
By combining simplicity with analytical depth, it enables professionals to make informed decisions, improve efficiency, and ensure sustainable water delivery.
From tracking non-revenue water to analyzing cost efficiency and customer satisfaction, this Excel-based solution empowers organizations to turn raw data into measurable impact.
Start using the scorecard today and take control of your water supply performance with clarity and confidence.
Click to Purchases Water Supply KPI Scorecard in Excel
❓ Frequently Asked Questions (FAQs)
1. What is the purpose of a Water Supply KPI Scorecard?
It helps water utilities monitor operational, financial, and service KPIs in one interactive dashboard, improving visibility and decision-making.
2. How many KPIs should be tracked in the scorecard?
Ideally, track 10–15 core KPIs covering production, quality, cost, and service areas. Avoid adding too many indicators.
3. Can I customize the KPI Scorecard template?
Yes. You can add new KPIs, edit formulas, or change visuals without advanced Excel knowledge.
4. Is this template suitable for small organizations?
Absolutely. Whether you manage a small rural water network or a large urban utility, the scorecard scales easily.
5. How do I update the data each month?
Go to the Input Data sheet, add the latest actual and target values, and the dashboard updates automatically.
6. What does “Lower-the-Better” and “Upper-the-Better” mean?
Some KPIs, like “Non-Revenue Water,” perform better when lower, while others, like “Water Quality Compliance,” perform better when higher.
7. Can this scorecard integrate with other tools like Power BI?
Yes. You can export data to Power BI or Google Sheets for advanced visualization and reporting.
8. What are the benefits of using Excel for KPI tracking?
Excel offers affordability, flexibility, and easy customization — ideal for organizations without complex software systems.
9. How can I visualize performance trends?
Use the KPI Trend sheet, which provides monthly charts for Actual, Target, and Previous Year data.
10. Why is KPI tracking vital for sustainable water management?
Tracking KPIs helps identify inefficiencies, reduce wastage, and maintain service quality — all crucial for sustainable resource management.
Click to Purchases Water Supply KPI Scorecard in Excel
Visit our YouTube channel to learn step-by-step video tutorials