The wine industry runs on precision, timing, and quality control. However, many wineries still rely on scattered spreadsheets and manual reports. As a result, decision-makers often struggle to track fermentation efficiency, production yield, sales performance, and inventory levels in one place.Therefore, wineries need a structured performance monitoring system.More importantly, they need real-time visibility into their most critical KPIs.That is exactly where the Winemaking KPI Dashboard in Excel becomes essential.This ready-to-use Excel dashboard helps winery owners, production managers, and operations teams monitor performance, compare targets, and improve efficiency — all from one dynamic interface.
In this detailed guide, you will learn:
- What a Winemaking KPI Dashboard in Excel is
- Why wineries need KPI tracking
- Detailed explanation of all 7 worksheets
- Important KPIs for winemaking
- Advantages of the Winemaking KPI Dashboard
- Best practices for implementation
- Frequently asked questions
Click to buy Winemaking KPI Dashboard in Excel
What Is a Winemaking KPI Dashboard in Excel?
A Winemaking KPI Dashboard in Excel is a structured performance tracking tool designed specifically for wineries and wine production facilities. It consolidates key operational, production, quality, and financial metrics into one interactive Excel dashboard.
Instead of reviewing multiple reports, teams can:
- Monitor monthly and yearly performance
- Compare actual vs target values
- Track historical trends
- Identify production issues early
- Make faster and smarter decisions
Moreover, since the dashboard runs in Excel, most teams can implement it quickly without investing in expensive software.
Why Do Wineries Need a KPI Dashboard?
Winemaking involves many moving parts. For example, wineries must manage grape intake, fermentation, aging, bottling, quality checks, inventory, and sales. However, without proper tracking, small inefficiencies can quickly reduce profitability.
Therefore, a KPI dashboard becomes critical.
Key Challenges Without KPI Tracking
Many wineries face these common problems:
- Lack of real-time production visibility
- Difficulty comparing targets vs actuals
- Manual reporting consumes too much time
- Poor inventory planning
- Delayed decision-making
- Inconsistent quality monitoring
Because of these challenges, winery leaders often operate reactively instead of proactively.
How the Dashboard Solves These Problems
The Winemaking KPI Dashboard in Excel helps by:
- Centralizing all KPI data
- Automating performance calculations
- Highlighting gaps using visual indicators
- Enabling monthly and yearly analysis
- Supporting data-driven decisions
As a result, teams gain clarity and control over operations.
Key Features of the Winemaking KPI Dashboard in Excel
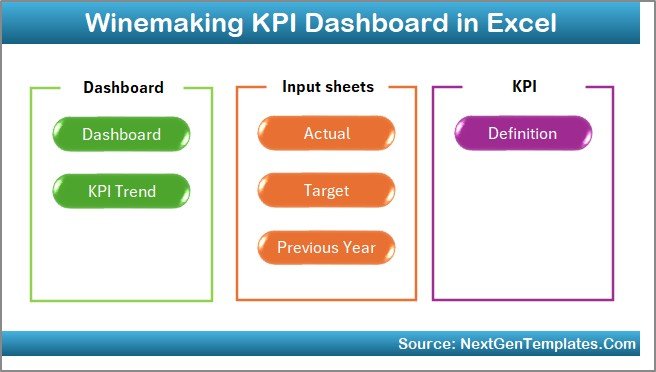
In this template, we have created a 7-worksheet structured system that supports complete KPI monitoring.
Let us review each sheet in detail.
Summary Page – The Navigation Hub
The Summary Page works as the index sheet of the dashboard.
What This Sheet Includes
- Six navigation buttons
- Quick access to all major sheets
- Clean and user-friendly layout
- One-click navigation experience
Why It Matters
Because users can jump to any section instantly, the dashboard becomes easy to use even for non-technical staff. Moreover, it improves the overall user experience significantly.
Click to buy Winemaking KPI Dashboard in Excel
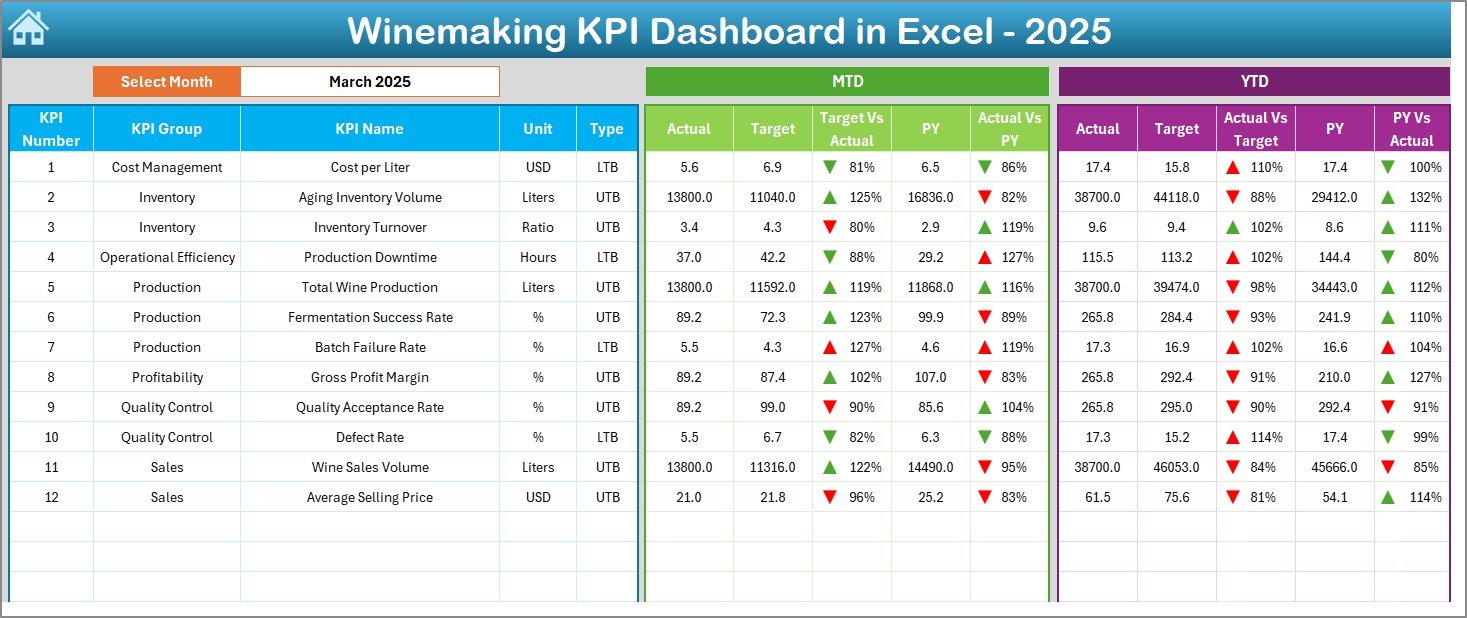
Dashboard Sheet – The Main Control Panel
The Dashboard sheet serves as the heart of the Winemaking KPI Dashboard in Excel.
Here, users can view the complete KPI performance for the selected month.
Interactive Month Selection
- Located at cell D3
- Uses a drop-down menu
- Automatically refreshes the dashboard
Therefore, users can analyze any month within seconds.
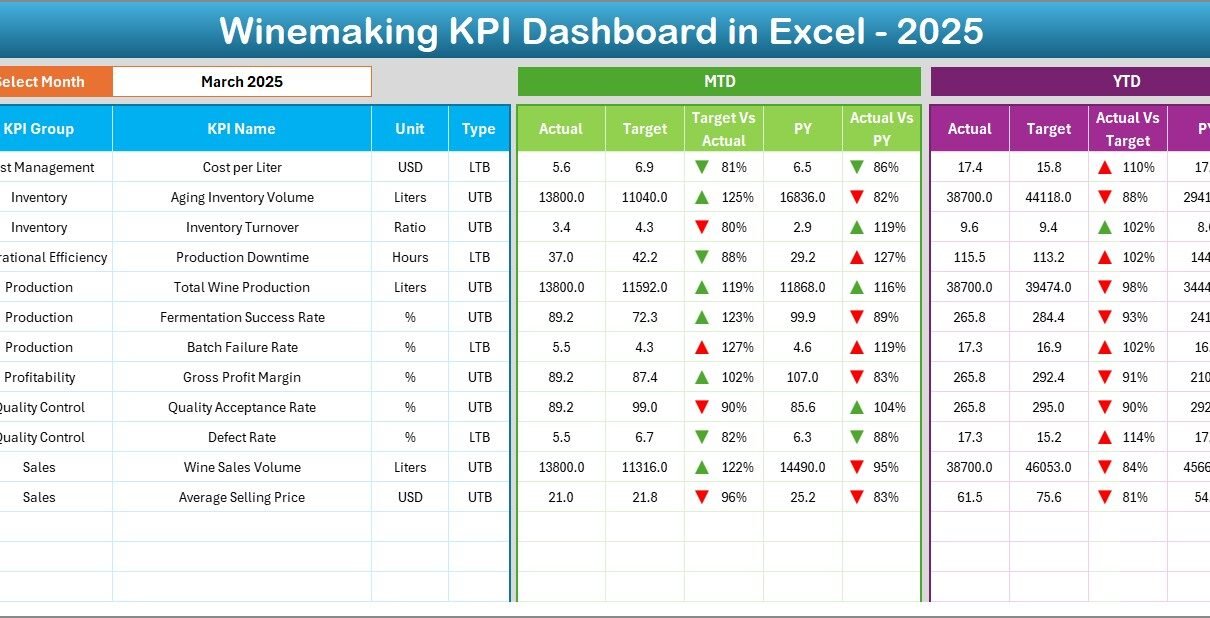
What Metrics Does the Dashboard Show?
The dashboard displays both MTD (Month-to-Date) and YTD (Year-to-Date) metrics.
MTD Section Includes
- MTD Actual
- MTD Target
- MTD Previous Year
- Target vs Actual comparison
- PY vs Actual comparison
- Conditional formatting arrows
YTD Section Includes
- YTD Actual
- YTD Target
- YTD Previous Year
- Target vs Actual comparison
- PY vs Actual comparison
- Conditional formatting arrows
Because of these comparisons, users can quickly identify performance gaps.
Visual Performance Indicators
The dashboard uses:
- Up and down arrows
- Color coding
- Variance calculations
As a result, managers can instantly spot:
- Over-performance
- Under-performance
- Risk areas
This visual clarity makes decision-making much faster.
Click to buy Winemaking KPI Dashboard in Excel
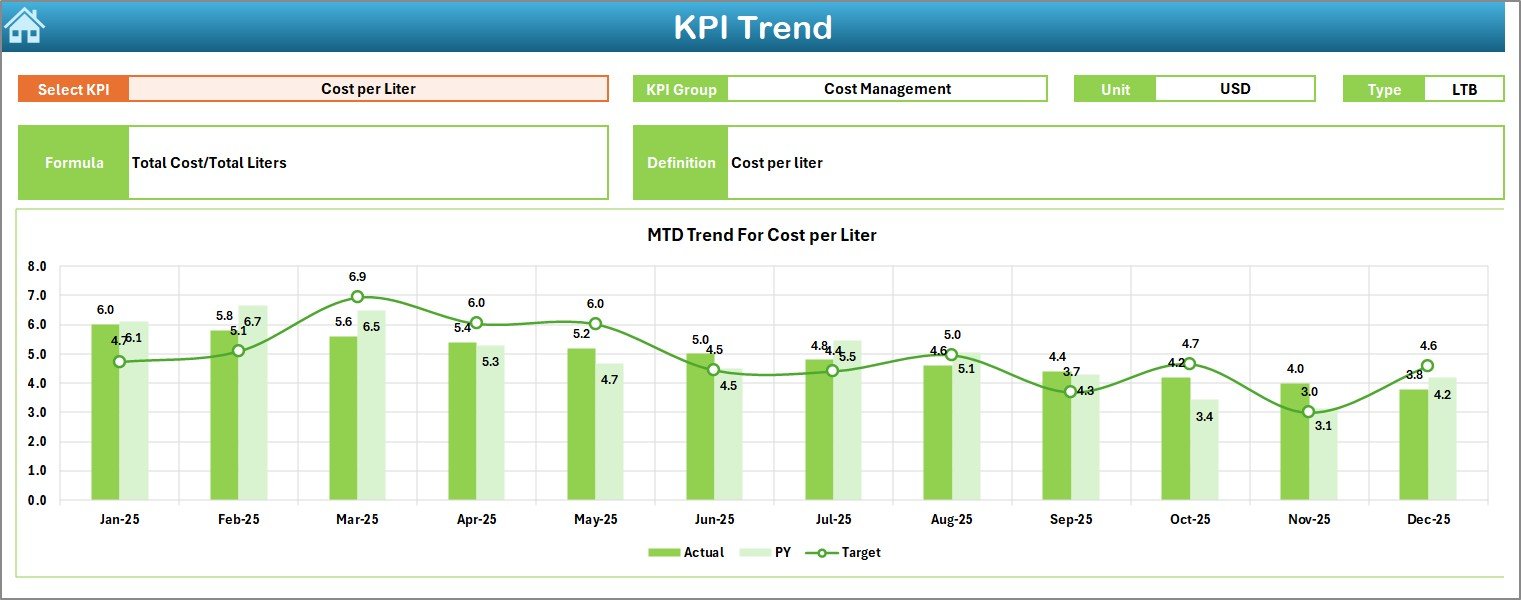
Trend Sheet – Deep KPI Analysis
The Trend sheet allows users to analyze individual KPIs in depth.
KPI Selection
- Drop-down located at cell C3
- Select any KPI
- Dashboard updates automatically
Therefore, users can focus on one metric at a time.
KPI Information Displayed
The sheet shows:
- KPI Group
- Unit of KPI
- Type (Lower the Better / Upper the Better)
- KPI Formula
- KPI Definition
Because of this, users always understand what each KPI represents.
Trend Charts Included
The sheet provides:
- MTD Trend Chart
- YTD Trend Chart
- Actual vs Target vs Previous Year
These charts help teams:
- Identify seasonality
- Track improvement trends
- Detect performance decline early
Consequently, wineries can take corrective action quickly.
Click to buy Winemaking KPI Dashboard in Excel
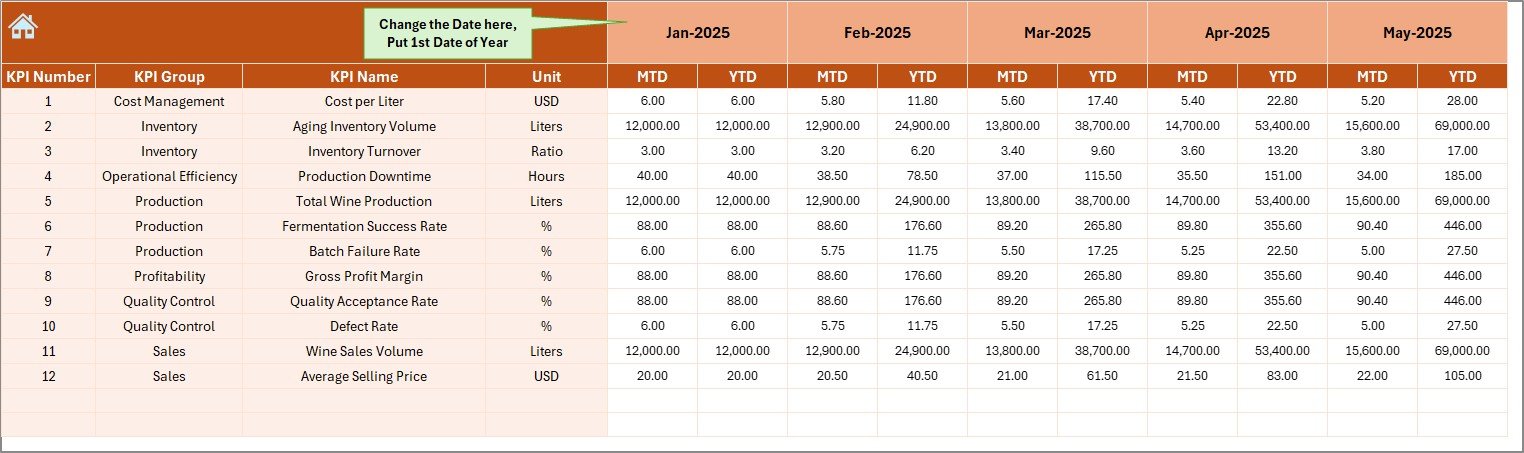
Actual Numbers Input Sheet – Data Entry Area
This sheet serves as the primary data entry location for current year performance.
What Users Must Enter
- Monthly MTD values
- Monthly YTD values
- KPI-wise actual numbers
Dynamic Month Control
- Located at cell E1
- Enter the first month of the year
- Dashboard updates automatically
Because of this structure, data entry remains simple and controlled.
Why This Sheet Is Important
Accurate actual data ensures:
- Reliable dashboard outputs
- Correct variance analysis
- Trustworthy decision-making
Therefore, teams should maintain this sheet carefully.
Click to buy Winemaking KPI Dashboard in Excel
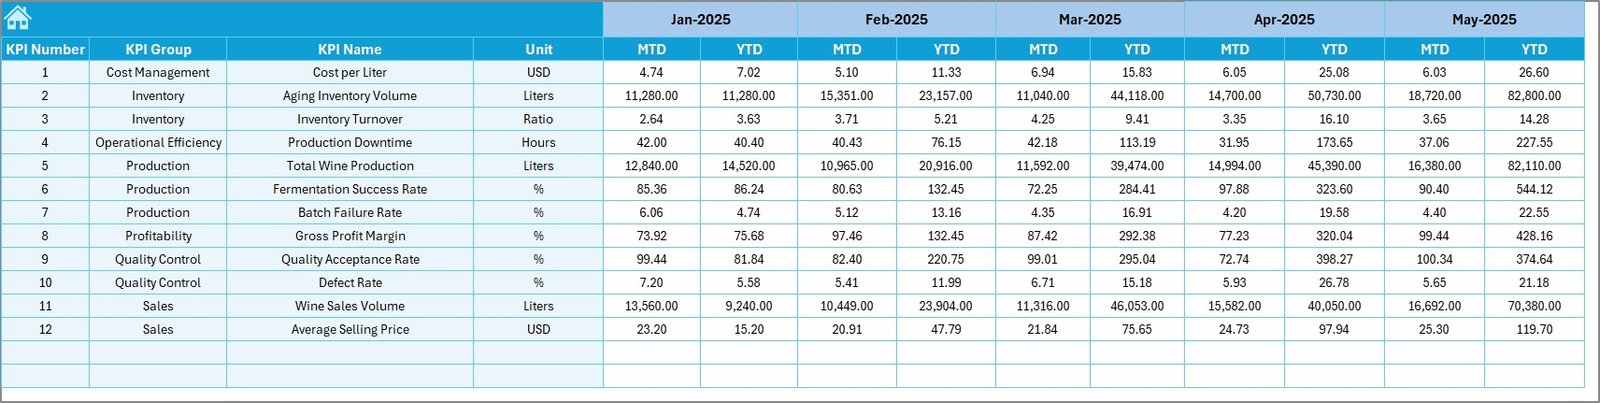
Target Sheet – Performance Benchmarks
The Target sheet stores the expected KPI values.
Required Inputs
Users must enter:
- Monthly MTD targets
- Monthly YTD targets
- KPI-wise target values
Why Targets Matter
Targets provide the benchmark for performance evaluation. Without them, teams cannot measure success properly.
With this sheet, wineries can:
- Set realistic goals
- Track achievement levels
- Improve accountability
- Drive performance culture
Click to buy Winemaking KPI Dashboard in Excel
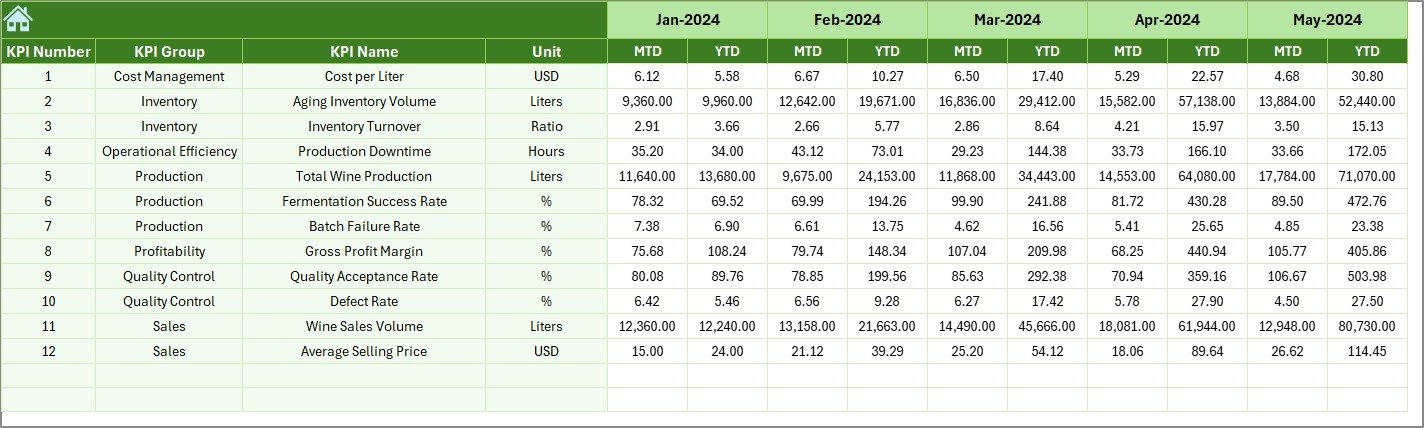
Previous Year Numbers Sheet – Historical Comparison
This sheet captures last year’s KPI data.
What Users Enter
- Previous year MTD values
- Previous year YTD values
- KPI-wise historical data
Why Historical Data Is Critical
Previous year comparison helps wineries:
- Identify growth trends
- Understand seasonality
- Benchmark performance
- Forecast future output
Therefore, this sheet plays a major role in strategic planning.
Click to buy Winemaking KPI Dashboard in Excel
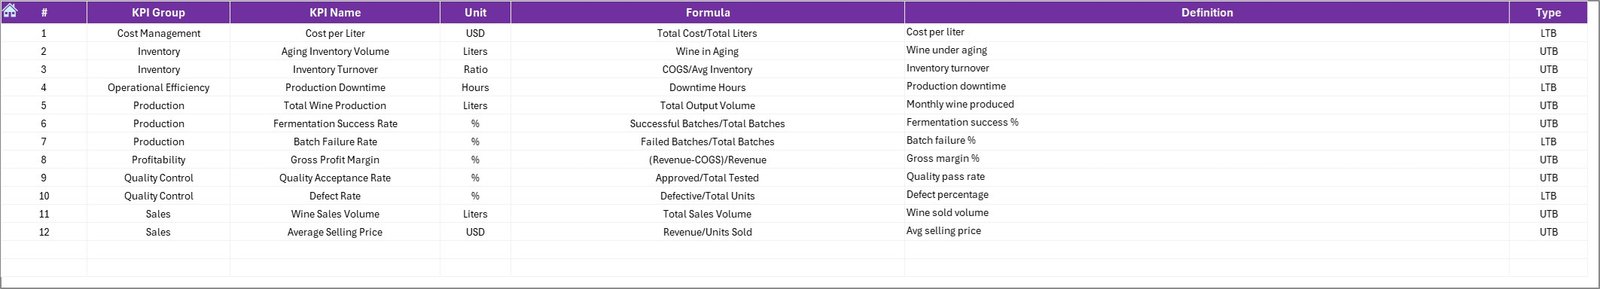
KPI Definition Sheet – The KPI Dictionary
This sheet acts as the master reference for all KPIs.
Required Fields
Users must enter:
- KPI Name
- KPI Group
- Unit
- Formula
- KPI Definition
Why This Sheet Is Essential
Because every KPI gets documented clearly, teams avoid confusion. Moreover, new users can understand the dashboard quickly.
This sheet ensures:
- Standardized KPI definitions
- Consistent calculations
- Better data governance
- Easier training
Important Winemaking KPIs to Track
To get maximum value from the dashboard, wineries should monitor the right KPIs.
Production KPIs
- Grape Crush Volume
- Fermentation Efficiency
- Yield per Ton
- Batch Completion Rate
- Production Loss %
Quality KPIs
- Quality Pass Rate
- Defect Rate
- Lab Test Compliance
- Aging Quality Score
- Customer Complaint Rate
Inventory KPIs
- Bulk Wine Inventory
- Bottled Stock Level
- Inventory Turnover
- Storage Utilization
- Aging Stock Value
Sales & Financial KPIs
- Revenue per Case
- Average Selling Price
- Gross Margin %
- Sales Growth %
- Order Fulfillment Rate
Because these KPIs cover the full winery lifecycle, they provide a complete performance picture.
Click to buy Winemaking KPI Dashboard in Excel
Advantages of Winemaking KPI Dashboard in Excel
Implementing this dashboard delivers several business benefits.
Improved Decision-Making
Because the dashboard provides real-time insights, managers can make faster and smarter decisions.
Complete Performance Visibility
All KPIs appear in one place. Therefore, teams no longer need multiple reports.
Time Savings
Automation reduces manual reporting work. As a result, teams focus more on analysis instead of data compilation.
Better Target Control
The dashboard clearly shows target vs actual gaps. Consequently, teams stay aligned with goals.
Trend Identification
With MTD and YTD charts, wineries can easily identify performance trends and seasonal patterns.
Early Problem Detection
Visual indicators highlight under-performance quickly. Therefore, teams can act before issues grow.
Cost-Effective Solution
Since the tool runs in Excel, organizations avoid expensive BI software costs.
Best Practices for the Winemaking KPI Dashboard in Excel
To get the best results, follow these proven practices.
Keep KPI Definitions Clear
Always document KPIs properly in the KPI Definition sheet. This step prevents confusion later.
Update Data Regularly
Enter actual numbers monthly without delay. Otherwise, the dashboard will not reflect reality.
Validate Data Before Upload
Always check:
- Missing values
- Wrong units
- Duplicate entries
Because clean data ensures accurate insights.
Use Realistic Targets
Do not set unrealistic goals. Instead, base targets on historical performance and capacity.
Review Trends Monthly
Schedule a monthly KPI review meeting. During the review:
- Analyze gaps
- Identify root causes
- Assign action items
Train Your Team
Ensure that all users understand:
- How to enter data
- How to read the dashboard
- What each KPI means
Proper training improves adoption significantly.
Maintain Version Control
Always keep backup copies of the dashboard. This practice protects your data.
Who Should Use This Dashboard?
The Winemaking KPI Dashboard in Excel suits many roles.
Ideal Users
- Winery Owners
- Production Managers
- Operations Teams
- Quality Managers
- Finance Teams
- Supply Chain Managers
Because the dashboard covers end-to-end performance, multiple departments can benefit.
How to Get Started Quickly?
Follow these simple steps.
- Open the Excel template
- Update the KPI Definition sheet
- Enter targets in the Target sheet
- Input previous year data
- Add current actual numbers
- Select the month on the Dashboard
- Review performance
Within minutes, your winery gains powerful insights.
Conclusion
Winemaking requires precision, consistency, and continuous monitoring. However, manual tracking methods no longer meet the needs of modern wineries.
Therefore, organizations must adopt a structured KPI monitoring system.
The Winemaking KPI Dashboard in Excel provides exactly that.
It centralizes performance data, highlights gaps, and enables faster decision-making. Moreover, its Excel-based design keeps implementation simple and cost-effective.
If your winery wants better visibility, stronger control, and smarter growth decisions, this dashboard becomes an essential tool.
Now is the right time to move from reactive reporting to proactive performance management.
Frequently Asked Questions with Answers
What is a Winemaking KPI Dashboard in Excel?
It is an Excel-based performance monitoring tool that tracks winery KPIs such as production, quality, inventory, and financial metrics in one interactive dashboard.
Do I need advanced Excel skills to use this dashboard?
No. The template uses simple drop-downs and structured sheets. Therefore, basic Excel knowledge works well for most users.
How often should I update the dashboard?
You should update the Actual Numbers sheet monthly. However, many wineries prefer weekly updates for better control.
Can I customize the KPIs?
Yes. You can easily add, remove, or modify KPIs using the KPI Definition sheet.
Is this dashboard suitable for small wineries?
Absolutely. In fact, small and mid-size wineries benefit the most because the solution remains cost-effective and easy to deploy.
Can this dashboard support multiple years of data?
Yes. You can extend the input sheets to include additional years if needed.
Visit our YouTube channel to learn step-by-step video tutorials
Click to buy Winemaking KPI Dashboard in Excel
Watch the step-by-step video tutorial: