Yoga centres help people improve their physical strength, emotional balance, and mental clarity. However, as yoga studios grow, managers struggle to understand daily operations, customer behavior, session performance, and financial results. Reports spread across multiple sheets create confusion. As a result, decision-making slows down, and opportunities slip away.
A Yoga Centres Dashboard in Excel solves this problem immediately. It brings every key performance indicator (KPI) into one clean, interactive, and ready-to-use tracker. With simple slicers, clear charts, and structured pages, yoga studios understand their performance faster and make better decisions every day.
In this detailed article, you will explore what this dashboard does, how each page works, why yoga centres need it, and how teams can use it to manage revenue, customer feedback, session attendance, and overall studio growth. You will also learn the advantages, best practices, and common questions that users ask before using this tool.
Click to Purchases Yoga Centres Dashboard in Excel
What Is a Yoga Centres Dashboard in Excel?
A Yoga Centres Dashboard in Excel gives yoga studios a complete view of their operations in one place. It tracks important metrics such as customer ratings, attendance behavior, revenue, session fees, membership performance, yoga style trends, and regional insights. It works as a ready-to-use Excel template that updates results instantly when new data comes in.
Managers no longer search across files. Trainers understand the performance of their sessions. Owners track financial outcomes and customer satisfaction clearly. Because everything stays structured, the entire team works with confidence.
This dashboard includes a Page Navigator on the left side that helps users switch between different analytical pages without confusion. You simply click a button and jump to Overview, Yoga Style, Region, Membership, or Monthly Analysis.
Why Do Yoga Centres Need a Dashboard in Excel?
Yoga studios collect data every day—session bookings, customer demographics, membership renewals, session fees, cancellations, and profits. Without a system, this information stays unused. When teams use a structured dashboard, they turn this data into insights.
Studios need this dashboard because:
-
They want clear visibility into revenue and cost.
-
They want to track customer satisfaction.
-
They want to understand which yoga styles perform well.
-
They want to manage membership trends.
-
They want to monitor seasonal changes in attendance and profit.
-
They want to improve decision-making with real facts.
Excel makes this easy because it is accessible, flexible, and familiar to most users.
Key Features of the Yoga Centres Dashboard in Excel
This dashboard comes with five analytical pages, each designed to answer important business questions. The Page Navigator on the left side lets users move between pages instantly.
Below is a detailed explanation of each page.
1. Overview Page: How Well Is the Yoga Centre Performing?
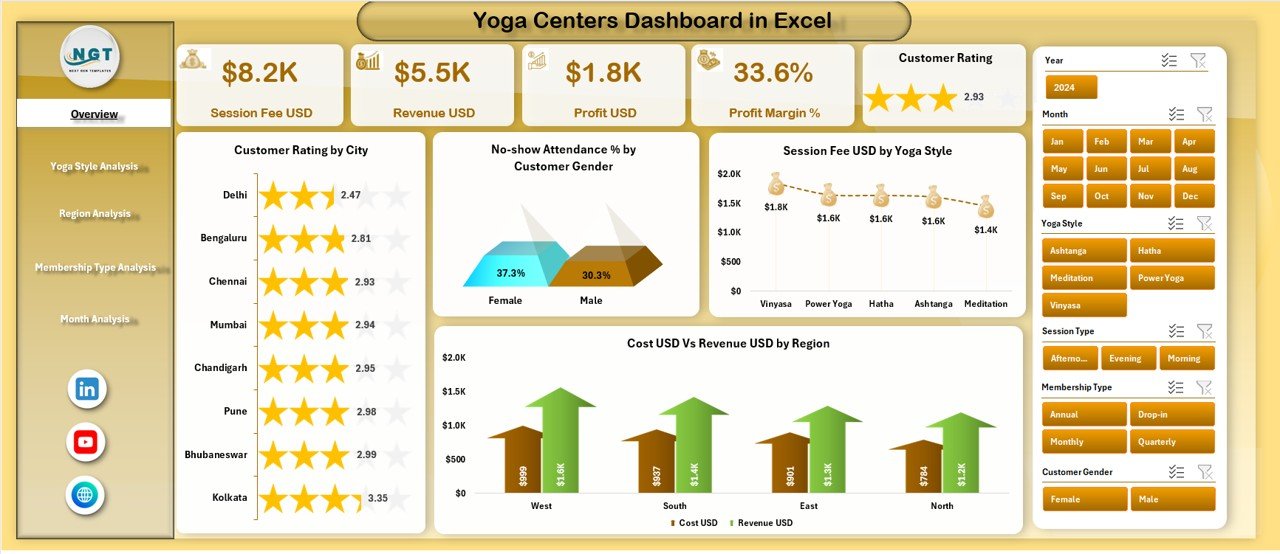
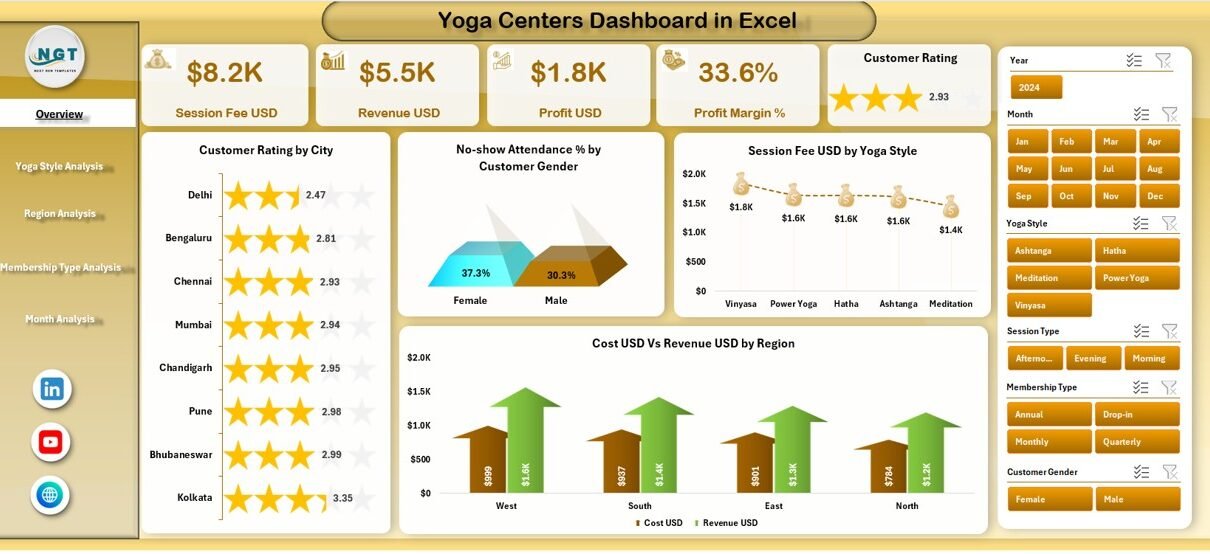
The Overview Page is the main page of the dashboard. It shows the most important KPIs at a glance so that managers understand the overall health of the yoga centre within seconds.
This page includes 5 key cards:
-
Total Cost (USD)
-
Revenue
-
Profit (USD)
-
Conversion Rate (%)
-
Profit Margin (%)
These cards tell the story of financial performance, customer conversions, and centre profitability.
You also get 4 powerful charts:
✔️ Customer Rating by City
This chart shows how customers from different cities rate your sessions. As a result, you can identify high-performing locations easily.
✔️ No-Show Attendance % by Customer Gender
This breakdown helps you understand attendance behavior across male and female customers.
✔️ Session Fee (USD) by Yoga Style
This chart reveals which yoga styles generate higher income.
✔️ Cost USD vs Revenue USD by Region
This comparison highlights profitable regions and regions that need improvement.
The Overview Page works as the command centre of the entire dashboard.
2. Yoga Style Analysis Page: Which Yoga Styles Drive Better Results?
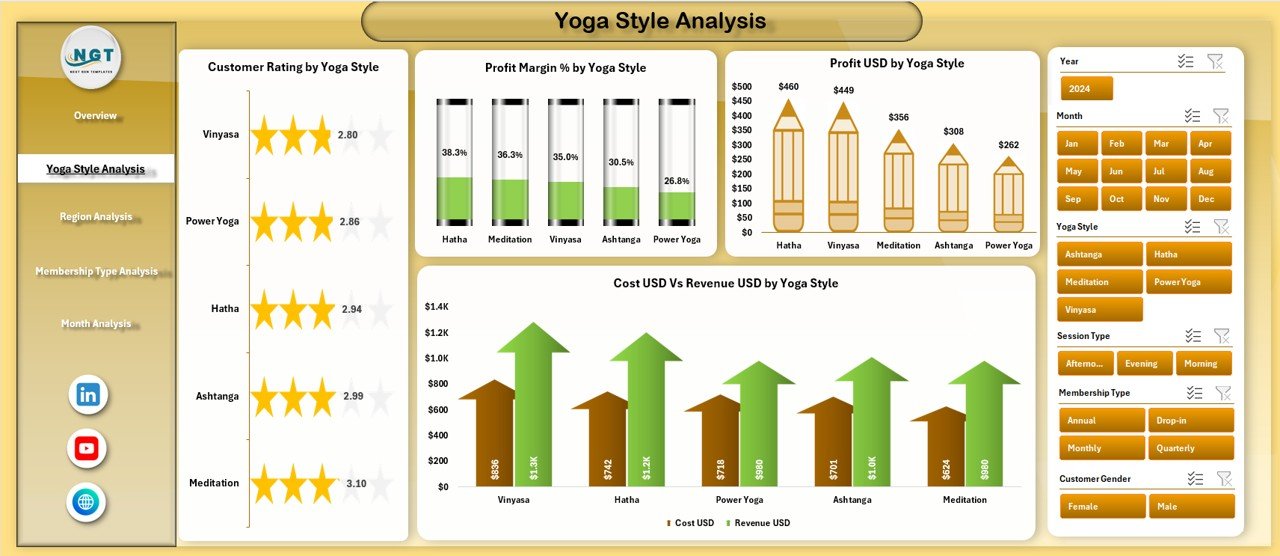
Different yoga styles attract different customer groups. Some styles generate high revenue, while others create higher customer satisfaction.
The Yoga Style Analysis Page helps managers compare all yoga styles quickly.
This page includes 4 major charts:
✔️ Customer Rating by Yoga Style
You see which styles bring the most satisfaction.
✔️ Profit Margin % by Yoga Type
This metric shows how well each yoga type performs financially.
✔️ Profit (USD) by Yoga Type
This helps teams understand where they earn the highest profit.
✔️ Cost USD vs Revenue USD by Yoga Type
You compare cost and revenue side-by-side to see profitability clearly.
This page allows studios to focus on high-performing yoga types and improve weaker ones.
3. Region Analysis Page: How Do Different Regions Perform?
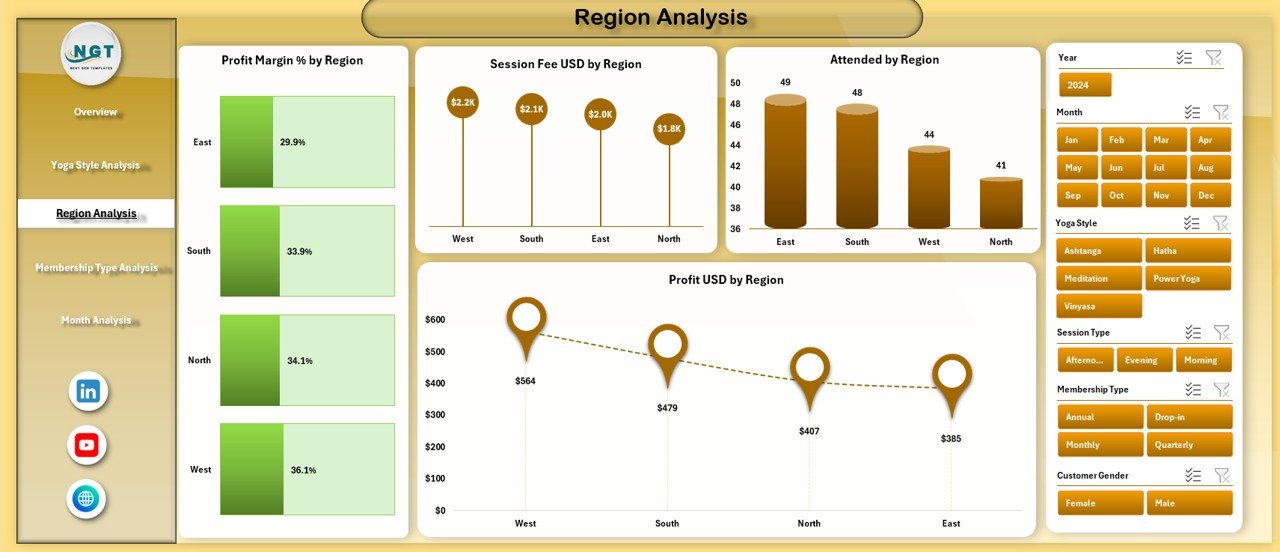
Yoga centres often operate in multiple regions. Each region performs differently due to customer demographics, local trends, and fee structures.
The Region Analysis Page gives a regional view of key metrics.
Click to Purchases Yoga Centres Dashboard in Excel
This page includes 4 analytical charts:
✔️ Profit Margin % by Region
This shows which regions manage their sessions efficiently.
✔️ Session Fee USD by Region
You understand how pricing varies across locations.
✔️ Attended Count by Region
This chart highlights regions with high or low participation.
✔️ Profit (USD) by Region
It becomes easy to identify the most profitable regions.
This page supports strategic planning, location expansion, and targeted improvement.
4. Membership Type Analysis Page: Which Memberships Perform the Best?
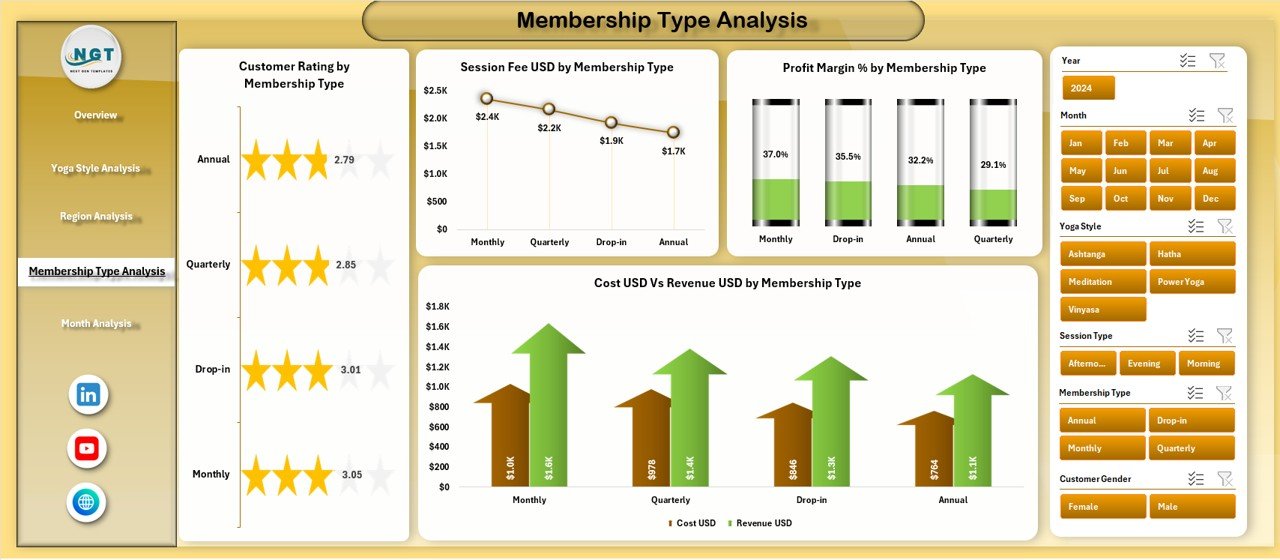
Membership programs drive long-term revenue. The Membership Type Analysis Page helps you understand how each membership type performs financially and operationally.
This page includes 4 detailed charts:
✔️ Customer Rating by Membership Type
This tells you which membership categories keep customers happy.
✔️ Session Fee USD by Membership Type
This reveals the revenue potential of each membership.
✔️ Profit Margin % by Membership Type
This highlights the most profitable membership structures.
✔️ Cost USD vs Revenue USD by Membership Type
You compare financial balance across memberships.
This page helps studios design smarter membership packages that meet customer needs while improving profitability.
5. Month Analysis Page: How Does Performance Change Every Month?
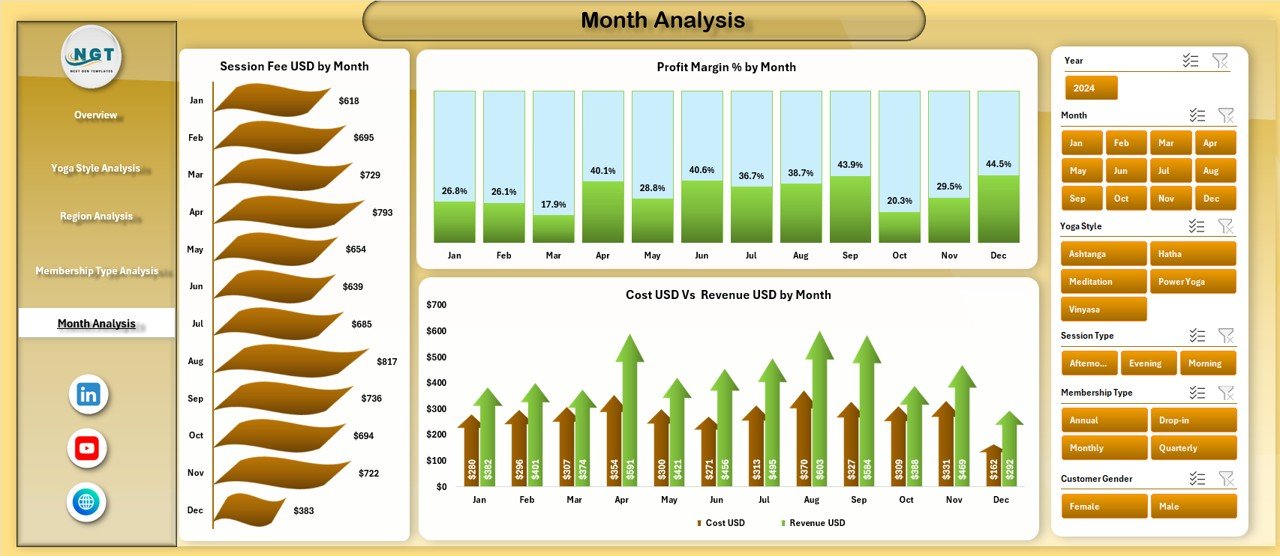
Every yoga centre shows seasonal patterns. Some months bring higher attendance, while others show higher costs. The Month Analysis Page helps you identify these trends.
This page includes 3 charts:
✔️ Session Fee USD by Month
You see how income changes monthly.
✔️ Profit Margin % by Month
You can track profitability throughout the year.
✔️ Cost USD vs Revenue USD by Month
You understand the difference between cost and revenue month-by-month.
This page helps you plan promotions, schedule sessions, and optimize budgets.
Support Sheets: Data Sheet & Other Backend Sheets
The dashboard connects to a structured Data Sheet. This sheet stores all raw values such as:
-
Customer details
-
Yoga style
-
Membership type
-
Attendance
-
Fees
-
Cost
-
Ratings
-
Regions
-
Month
When you add or update data in the Data Sheet, the dashboard updates instantly.
How Does a Yoga Centres Dashboard Improve Operations?
This dashboard answers real business questions:
✔️ Which yoga styles generate the highest profit?
✔️ Which regions perform the best?
✔️ Do customers prefer certain membership types?
✔️ When does attendance drop or increase?
✔️ Which customer groups have higher no-show percentages?
✔️ Which cities show the highest customer satisfaction?
Click to Purchases Yoga Centres Dashboard in Excel
The dashboard converts raw data into meaningful insights. Teams use these insights to improve training schedules, adjust membership pricing, create marketing campaigns, and enhance customer experiences.
Advantages of a Yoga Centres Dashboard in Excel
A dedicated dashboard offers many benefits. Here are some key advantages:
⭐ 1. Faster Decision-Making
The dashboard shows everything clearly, so managers act quickly.
⭐ 2. Better Understanding of Customer Behavior
Customer ratings, attendance patterns, and membership usage become clear.
⭐ 3. Stronger Financial Control
You monitor cost, revenue, and profit in real time.
⭐ 4. Improved Resource Allocation
You assign trainers, sessions, and budgets with clarity.
⭐ 5. Higher Studio Performance
When you understand what works, you repeat it. When you know what fails, you fix it.
⭐ 6. Easy Collaboration Across Teams
Everyone sees the same structured information.
⭐ 7. Stronger Ability to Forecast Trends
Monthly trends help with planning and budgeting.
⭐ 8. Saves Hours of Manual Reporting Time
The dashboard automates everything with clean visuals.
Best Practices for Using a Yoga Centres Dashboard in Excel
To get the best results from this dashboard, follow these practical guidelines:
✔️ 1. Update the Data Sheet Regularly
Daily or weekly updates ensure accurate insights.
✔️ 2. Use Clean and Structured Data
Avoid text errors, missing values, and inconsistent spellings.
✔️ 3. Review Trends, Not Just Daily Numbers
Monthly and regional analysis gives deeper clarity.
✔️ 4. Track Customer Ratings Often
This helps improve service quality.
✔️ 5. Compare Yoga Styles Periodically
Trending yoga styles may change. Stay updated.
✔️ 6. Use Insights When Designing Membership Plans
Create plans that match customer needs.
✔️ 7. Monitor No-Show Patterns
Reduce cancellations through reminders and incentives.
✔️ 8. Share Dashboard Insights with Trainers
This helps trainers adjust techniques and improve engagement.
✔️ 9. Create Yearly Targets Using Dashboard Results
Set achievable goals based on real data.
Conclusion
A Yoga Centres Dashboard in Excel gives studios a complete, smart, and simple way to track performance. It combines financial insights, customer behavior, regional trends, yoga style analysis, and membership performance into one structured tool. Because the dashboard updates automatically, teams save time and focus on what truly matters—offering great yoga experiences and growing their studio.
Whether you run a single yoga centre or multiple branches, this dashboard brings clarity, speed, and confidence to your decision-making process. With clear visuals, simple navigation, and detailed analysis, your studio works better every day.
Frequently Asked Questions (FAQs)
1. How does a Yoga Centres Dashboard in Excel help managers?
It helps managers understand performance faster, track financials, review customer ratings, and analyze trends across styles, regions, and membership types.
2. Can beginners use this dashboard easily?
Yes. The dashboard uses simple slicers, clear charts, and easy navigation. Anyone who knows basic Excel can use it.
3. Do I need advanced Excel skills to update the data?
No. You only need to enter data in the Data Sheet. The dashboard updates automatically.
4. Can I customize the charts and KPIs?
Yes. You can adjust charts, slicers, colors, and KPI definitions based on the needs of your yoga centre.
5. Does this dashboard support multiple yoga centres or branches?
Yes. The Region Analysis page helps you compare different yoga locations clearly.
6. Can I use this dashboard for financial planning?
Yes. The Overview, Month Analysis, and Yoga Style Analysis pages support budgeting and forecasting.
7. How often should I update the data?
Weekly updates work best for most studios, but active centres can update daily for more accuracy.
8. Does this dashboard help improve customer satisfaction?
Yes. Customer Rating charts highlight areas that need improvement.
Visit our YouTube channel to learn step-by-step video tutorials