Home>Blogs>Charts and Visualization>3D Container Pivot Chart with Slicer and Timeline>3D Container Chart -2
3D Container Chart -2
15
May 2019
332Comments Off on 3D Container Chart -2
PK
Meet PK, the founder of PK-AnExcelExpert.com! With over 15 years of experience in Data Visualization, Excel Automation, and dashboard creation. PK is a Microsoft Certified Professional who has a passion for all things in Excel. PK loves to explore new and innovative ways to use Excel and is always eager to share his knowledge with others. With an eye for detail and a commitment to excellence, PK has become a go-to expert in the world of Excel. Whether you're looking to create stunning visualizations or streamline your workflow with automation, PK has the skills and expertise to help you succeed. Join the many satisfied clients who have benefited from PK's services and see how he can take your Excel skills to the next level!
https://www.pk-anexcelexpert.com
Related Articles
Geothermal Energy KPI Dashboard in Power BI
The renewable energy sector continues to grow as organizations shift toward sustainable power generation. Among renewable sources, geothermal energy plays
Railway Cargo KPI Dashboard in Excel
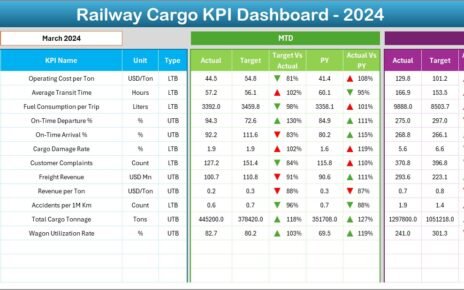
Railway cargo plays a vital role in national and international supply chains. From bulk commodities to containerized freight, railway cargo
Employee Onboarding Preparation Guide Checklist in Excel
Employee onboarding is one of the most critical processes for any organization, as it sets the stage for new hires


