4D Printing Dashboard in Power BI is a professionally designed, ready-to-use analytics template that empowers manufacturing professionals to track, analyze, and optimize their 4D printing operations directly in Microsoft Power BI. Unlike standard manufacturing dashboards, this template is purpose-built for the unique demands of 4D printing — where materials transform shape after production using stimuli like heat, moisture, or light. With 5 interactive dashboard pages, 15+ dynamic charts, and 5 high-level KPI cards, this Power BI template delivers a complete performance management system for additive manufacturing teams, R&D labs, and production facilities.
Whether you need to evaluate printing technology efficiency, compare material quality across suppliers, or present production profitability to stakeholders, the 4D Printing Dashboard in Power BI gives you everything in one place. Simply connect your data source, click Refresh, and the entire dashboard updates automatically — no complex DAX knowledge required.
📌 Click here to Purchase 4D Printing Dashboard in Power BI
Key Features of 4D Printing Dashboard in Power BI
This Power BI dashboard template is packed with features specifically designed for 4D printing operations management. It tracks 5 critical KPIs — Total Print Jobs, Total Material Cost, Net Profit, Avg Quality Score, and Transformation Success Rate — giving managers a complete view of operational health at a glance.
The dashboard includes 15+ professional charts that analyze profit margins by month, print jobs by priority, revenue by region, material costs by application sector, quality scores by material type, print duration by technology, and much more. Interactive slicers on every page allow users to filter data by month, region, priority, material type, client type, and printing technology for instant analysis.
Built using Microsoft Power BI Desktop, this dashboard delivers enterprise-grade analytics without requiring advanced technical expertise. Every visual updates dynamically when you refresh data, making it ideal for teams that need real-time performance monitoring.
If you are looking for more Power BI Dashboard Templates, explore our extensive collection designed for various industries and departments.
Dashboard Pages Explained
1. Overview Page
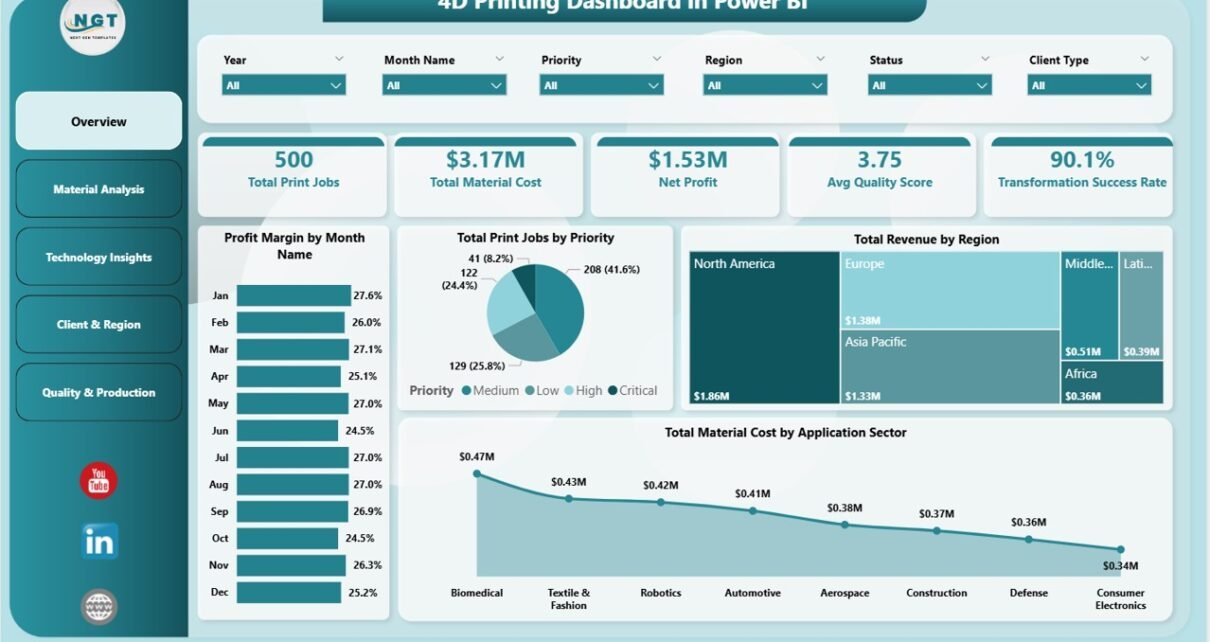
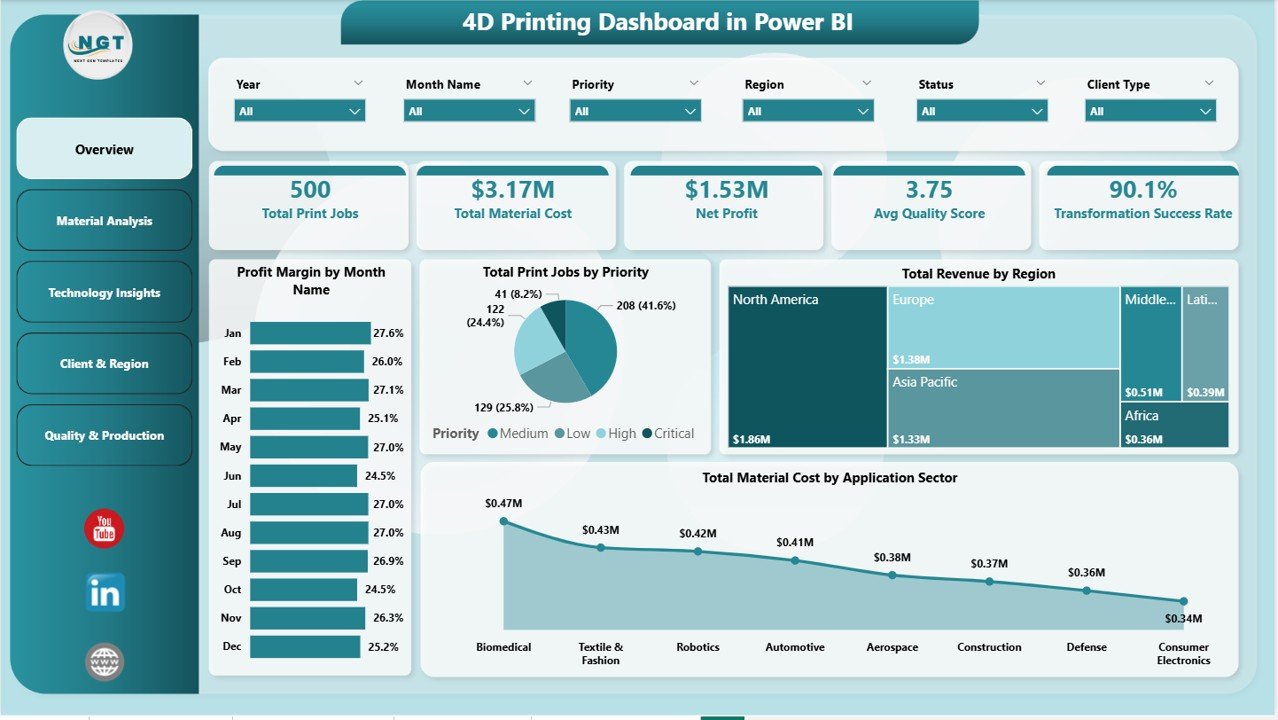
The Overview Page serves as the command center of the entire 4D printing operation. At the top, five powerful KPI cards display real-time metrics: Total Print Jobs, Total Material Cost, Net Profit, Avg Quality Score, and Transformation Success Rate. These give managers a quick snapshot of operational performance without drilling into details.
Below the KPI cards, four dynamic charts provide deeper analysis: Profit Margin by Month Name helps identify seasonal profitability patterns. Total Print Jobs by Priority shows the distribution of high, medium, and low priority jobs. Total Revenue by Region reveals geographic revenue concentration. Total Material Cost by Application Sector breaks down spending by end-use application. Multiple slicers allow instant filtering to see specific subsets of data quickly.
4D Printing Dashboard in Power BI
2. Material Analysis
The Material Analysis page dives deep into the raw materials used in 4D printing operations. Three specialized charts provide actionable insights: Avg Quality Score by Material Type helps production managers compare quality outputs across different materials like shape-memory polymers, hydrogels, and composites. Total Revenue by Printer Model identifies which machines generate the highest revenue, supporting capital investment decisions. Total Units Produced by Complexity Level reveals how production volumes distribute across simple, moderate, and complex print jobs.
This page is especially valuable for procurement teams and quality managers who need data-driven evidence for material sourcing and supplier evaluation decisions.
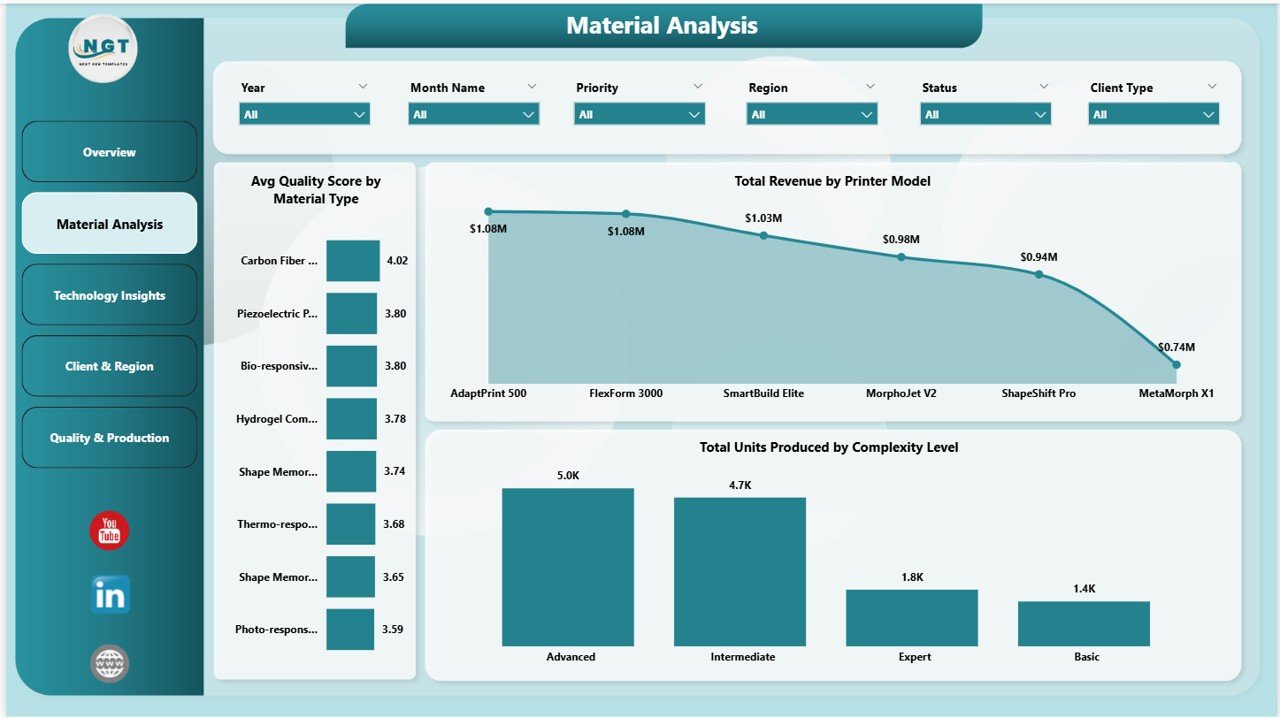
Material Analysis
3. Technology Insights
The Technology Insights page evaluates the performance of different 4D printing technologies. Avg Print Duration by Printing Technology helps identify which methods produce parts fastest. Total Units Produced by Printer Model shows output volume across machines. Total Revenue by Printing Technology reveals which technologies are the most commercially viable.
For R&D teams and technology directors, this page provides the evidence needed to decide which printing technologies to invest in, scale up, or phase out. Compare this with the Manufacturing Efficiency Dashboard in Power BI for broader manufacturing performance analysis.
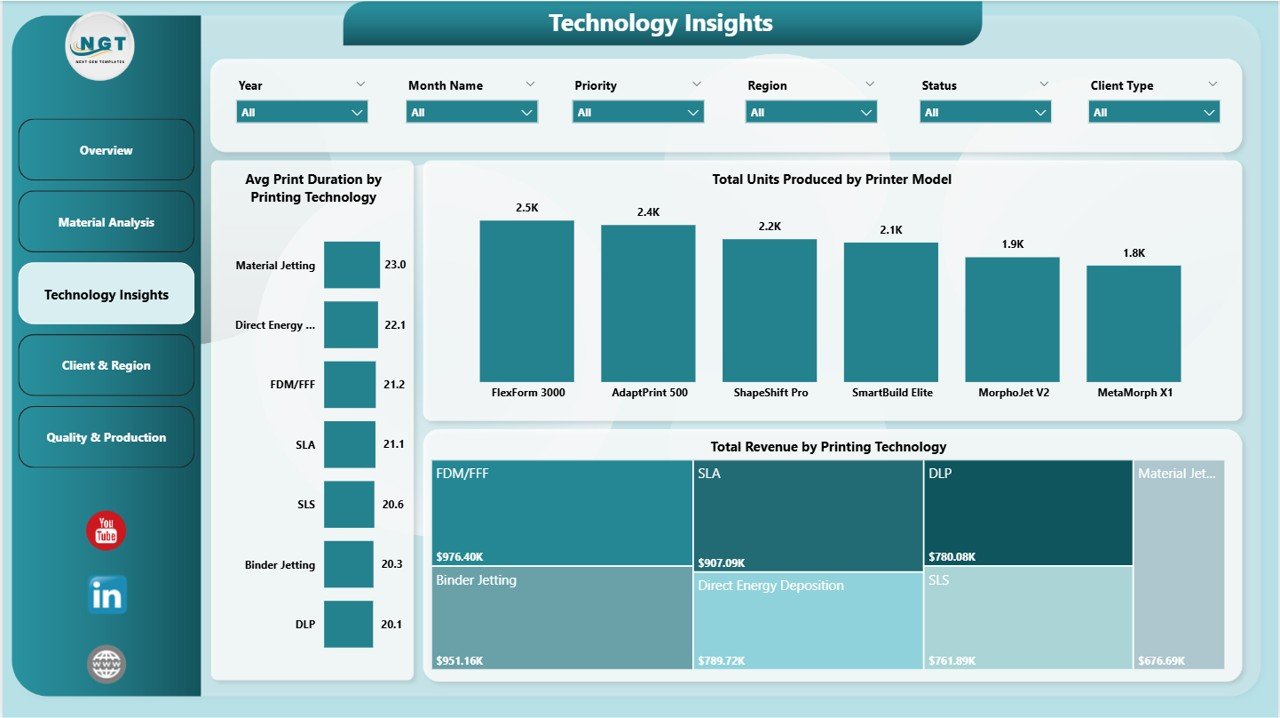
Technology Insights
4. Client and Region
The Client and Region page focuses on commercial and geographic performance. Total Revenue by Client Type segments income by customer category — whether enterprise, SMB, or individual clients. Total Material Cost by Region shows where material spending is concentrated geographically. Profit Margin by Client Type identifies which customer segments deliver the highest margins.
Sales teams and business development managers use this page to align their strategies with the most profitable segments and geographic markets. It also helps leadership identify regions where growth potential remains untapped.
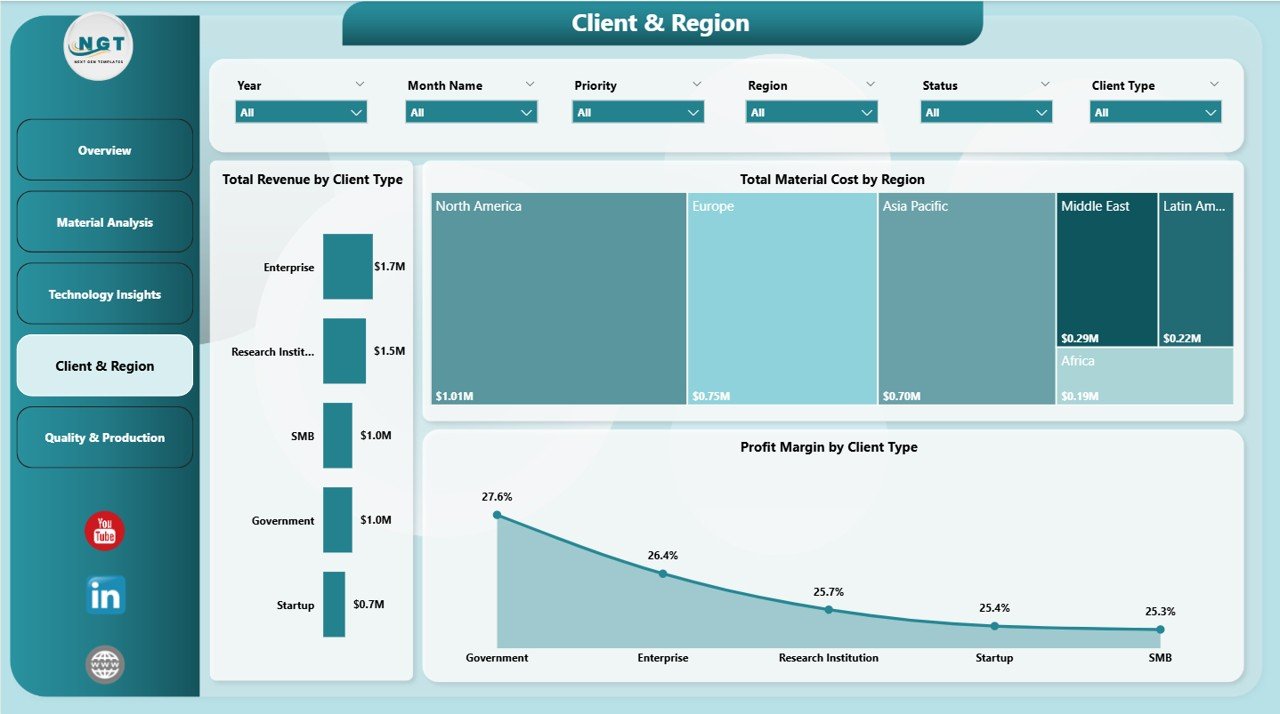
Client and Region
5. Quality and Production
The Quality and Production page tracks operational status and financial trends. Total Print Jobs by Status shows how many jobs are completed, in progress, or pending — critical for production scheduling. Total Revenue by Month Name reveals monthly revenue patterns for forecasting. Total Material Cost by Priority breaks down costs by job priority level to optimize resource allocation.
Production managers and operations directors rely on this page for daily monitoring of production pipelines and monthly financial performance reviews. For additional manufacturing KPI tracking, explore the Manufacturing KPI Dashboard in Power BI.
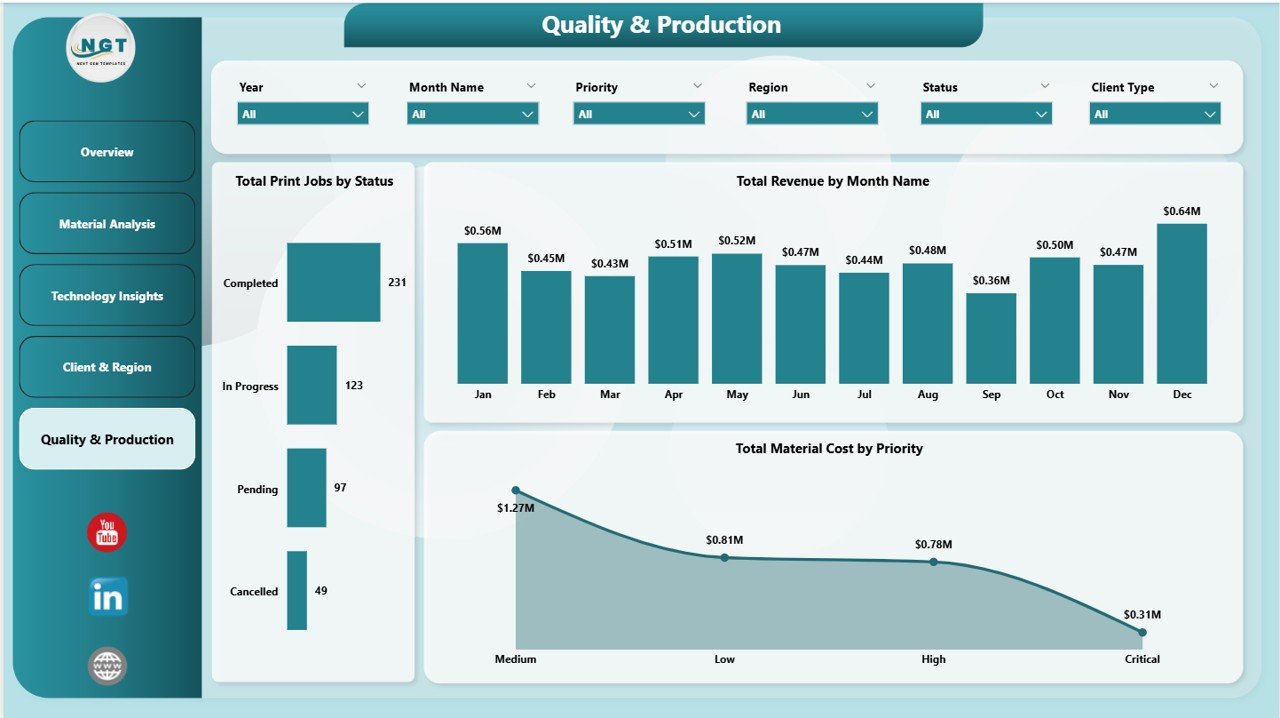
Quality and Production
Advantages of 4D Printing Dashboard in Power BI
The 4D Printing Dashboard in Power BI offers several significant advantages over traditional reporting methods. First, it centralizes all critical 4D printing metrics into one interactive platform, eliminating the need for scattered spreadsheets and manual report compilation. Second, Power BI’s dynamic filtering capability means managers can slice and dice data across multiple dimensions in seconds.
Third, the dashboard’s visual KPI cards with conditional formatting instantly highlight performance gaps, enabling faster corrective actions. Fourth, the 5-page analytical structure ensures comprehensive coverage — from executive overviews to granular material and technology analysis. Fifth, it requires no advanced technical skills; any team member with basic Power BI Desktop knowledge can operate and customize it. Finally, because it uses standard Power BI connectivity, you can integrate it with Excel files, SQL databases, Azure data sources, or cloud APIs for automated data refresh.
Opportunities for Improvement
While this dashboard covers the core needs of 4D printing analytics, there are some areas where organizations could extend its functionality. Adding a dedicated environmental sustainability page to track energy consumption and carbon footprint per print job would align with green manufacturing goals. Incorporating predictive analytics using Power BI’s AI visuals could help forecast material demands and quality trends. Integration with IoT sensor data from printers would enable truly real-time monitoring instead of periodic data refresh. Adding drill-through pages for individual print job details would support root cause analysis when quality issues arise.
Best Practices
To get the most out of the 4D Printing Dashboard in Power BI, follow these recommended practices. Update your source data regularly — weekly or daily for active production facilities — to keep insights current. Use the interactive slicers on each page to focus analysis on specific time periods, regions, or material types before drawing conclusions. Customize the KPI thresholds and conditional formatting colors to match your organization’s target benchmarks. Share the dashboard with cross-functional teams using Power BI Service for collaborative decision-making. Back up your .pbix file before making structural changes. Review the dashboard during weekly production meetings to align teams on priorities and performance gaps.
Explore Relevant Templates
📊 Manufacturing Efficiency Dashboard in Power BI — Track OEE, production output, downtime, and efficiency metrics with interactive Power BI visuals designed for manufacturing operations.
📈 Manufacturing KPI Dashboard in Power BI — Monitor key manufacturing performance indicators with MTD/YTD tracking, target comparison, and trend analysis.
🏭 Work Order Dashboard in Power BI — Manage maintenance work orders, track costs by department, and monitor asset performance in one centralized dashboard.
🔧 Manufacturing Operations KPI Dashboard in Power BI — Comprehensive operations KPI tracking for manufacturing facilities with dynamic visuals and data-driven insights.
📋 4D Printing Dashboard in Excel — Prefer Excel? Check out the Excel version of this dashboard with similar analytics capabilities built entirely in Microsoft Excel.
Frequently Asked Questions
What is a 4D Printing Dashboard in Power BI?
A 4D Printing Dashboard in Power BI is a ready-to-use analytics template that tracks KPIs like total print jobs, material costs, net profit, quality scores, and transformation success rates across 5 interactive pages. It is specifically designed for additive manufacturing operations involving shape-changing materials that respond to external stimuli.
How many dashboard pages does this template include?
This template includes 5 interactive dashboard pages: Overview, Material Analysis, Technology Insights, Client and Region, and Quality and Production. Each page contains dynamic charts, KPI cards, and slicers for real-time data filtering and analysis.
Do I need advanced Power BI skills to use this dashboard?
No. Simply replace the sample data with your own 4D printing data, click Refresh All in Power BI Desktop, and all charts and KPI cards update automatically. No complex DAX formulas or advanced coding knowledge is required to operate this dashboard.
What KPIs does the 4D Printing Dashboard track?
The dashboard tracks 5 high-level KPIs: Total Print Jobs, Total Material Cost, Net Profit, Avg Quality Score, and Transformation Success Rate. It also provides 15+ analytical charts covering profit margins, revenue by region, material costs by application sector, quality scores by material type, and production output by technology and printer model.
Can I customize this dashboard for my specific 4D printing operation?
Yes. The dashboard is fully customizable in Power BI Desktop. You can add or modify KPIs, change chart types, adjust slicers and filters, and connect to different data sources including Excel, SQL databases, Azure, and cloud APIs.
What is the best Power BI dashboard template for tracking 4D printing performance?
The 4D Printing Dashboard in Power BI from NextGenTemplates is the best ready-to-use template for tracking 4D printing performance. It covers material analysis, technology insights, client segmentation, regional performance, and production quality across 5 professionally designed dashboard pages with 15+ dynamic charts.
Conclusion
The 4D Printing Dashboard in Power BI is a powerful, comprehensive analytics solution for organizations operating in the 4D printing and additive manufacturing space. With 5 interactive pages, 5 KPI cards, 15+ charts, and dynamic slicers, it transforms raw operational data into actionable insights that drive smarter decisions, better cost control, and improved production quality.
Whether you are an operations manager tracking daily production, an R&D director evaluating technology performance, or an executive reviewing quarterly profitability, this dashboard provides the clarity and speed you need. Stop relying on scattered spreadsheets and start making data-driven decisions today.
📌 Click here to Purchase 4D Printing Dashboard in Power BI
🎥 Visit our YouTube channel for step-by-step video tutorials:
👉 Youtube.com/@PK-AnExcelExpert