In today’s fast-paced digital era, online education has become a core part of professional growth and organizational training. However, while institutions and businesses invest heavily in e-learning platforms, many still struggle to measure whether their digital learning initiatives are truly effective. That’s where the Digital Learning KPI Scorecard in Excel plays a vital role.
This ready-to-use Excel tool helps educators, L&D (Learning and Development) teams, and corporate training managers measure, track, and analyze key performance indicators (KPIs) related to digital learning performance — all in one visual, data-driven dashboard.
Let’s explore what makes this scorecard powerful, how it works, and how it can help you transform raw learning data into meaningful insights that drive better outcomes.
Click to Purchases Digital Learning KPI Scorecard in Excel
What Is a Digital Learning KPI Scorecard in Excel?
A Digital Learning KPI Scorecard is an analytical Excel tool designed to evaluate the performance and impact of digital education programs. It combines measurable KPIs — such as course completion rate, learner engagement, average test scores, and training ROI — into an interactive dashboard that highlights progress toward learning goals.
In simple terms, this scorecard converts complex learning data into an easy-to-understand, visual summary that helps you make informed decisions about your e-learning strategy. Whether you’re managing employee training, online certification programs, or virtual classrooms, this scorecard keeps everything organized, measurable, and comparable.
Click to Purchases Digital Learning KPI Scorecard in Excel
Key Components of the Digital Learning KPI Scorecard
This Excel-based scorecard template includes four main worksheets, each designed to simplify analysis and provide actionable insights.
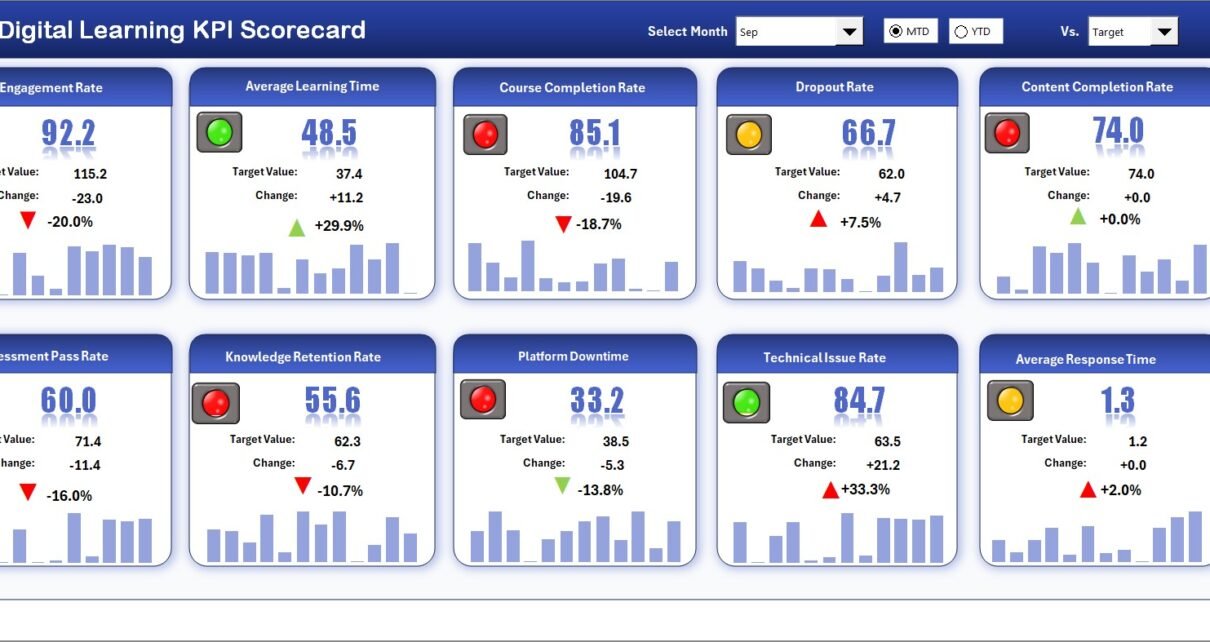
1️⃣ Scorecard Sheet (Main Interface)
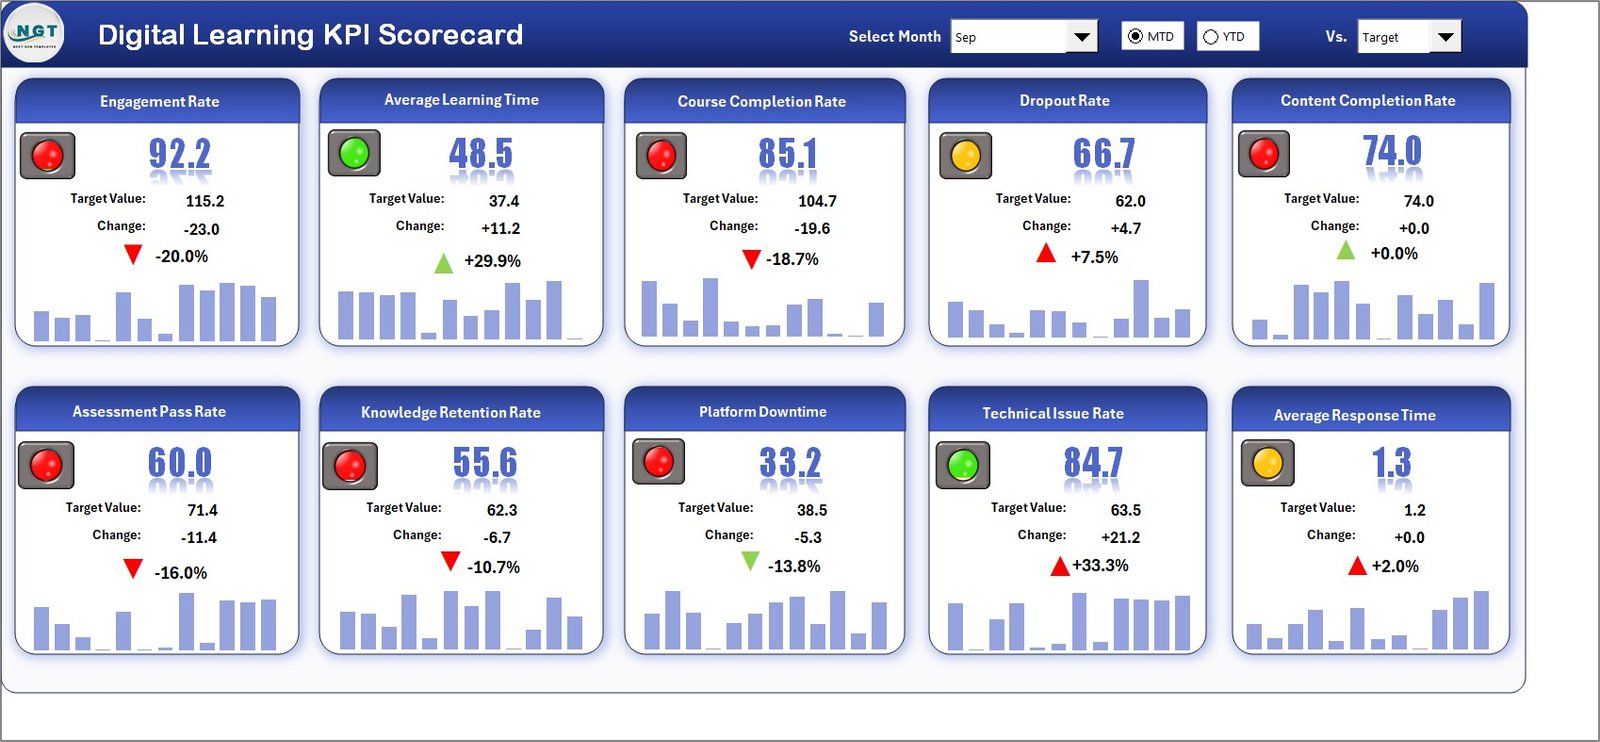
The Scorecard Sheet serves as the dashboard’s main control center. It’s the first page you see when you open the workbook, displaying KPI summaries, trends, and comparisons.
Key features include:
-
Dropdown Menus: Select a month and choose whether you want to view data for MTD (Month-to-Date) or YTD (Year-to-Date) analysis.
-
Actual vs Target Comparison: Monitor how your learning programs perform against established targets.
-
Color-Coded Indicators: Instantly identify areas of success or concern using green, yellow, and red icons.
-
Comprehensive KPI Overview: View all key metrics — including learner participation, engagement levels, course ratings, and completion ratios — in one table.
The sheet acts as a real-time performance summary, making it easy to assess your digital learning effectiveness without diving deep into data tables.
2️⃣ KPI Trend Sheet Tab
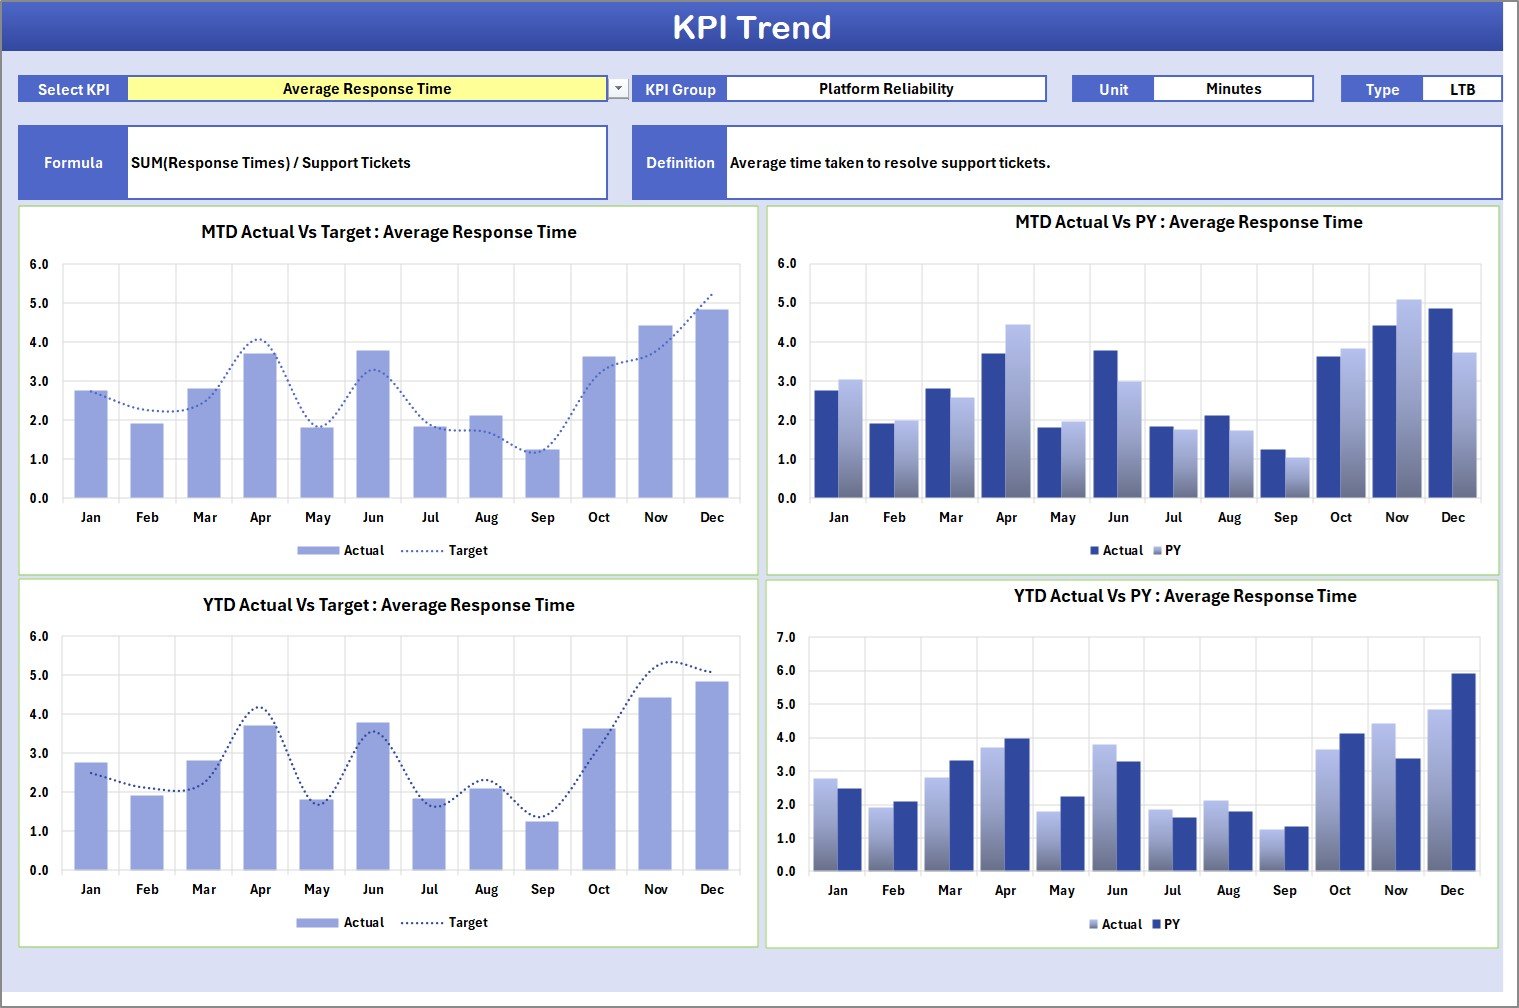
The KPI Trend Sheet provides detailed performance tracking for each KPI. It allows you to choose a specific KPI name from the dropdown menu (located in cell C3), and automatically generates dynamic visuals.
Highlights of this sheet:
-
Displays KPI Group, Unit, Formula, and Type (UTB: Upper the Better or LTB: Lower the Better).
-
Provides MTD and YTD charts comparing Actual, Target, and Previous Year (PY) values.
-
Offers a quick visual understanding of progress trends, enabling you to track improvement or detect dips in performance.
-
Helps you analyze which areas of your learning programs are driving results and which need more attention.
This makes it ideal for data-driven discussions with management or when presenting performance reviews.
3️⃣ Input Data Sheet
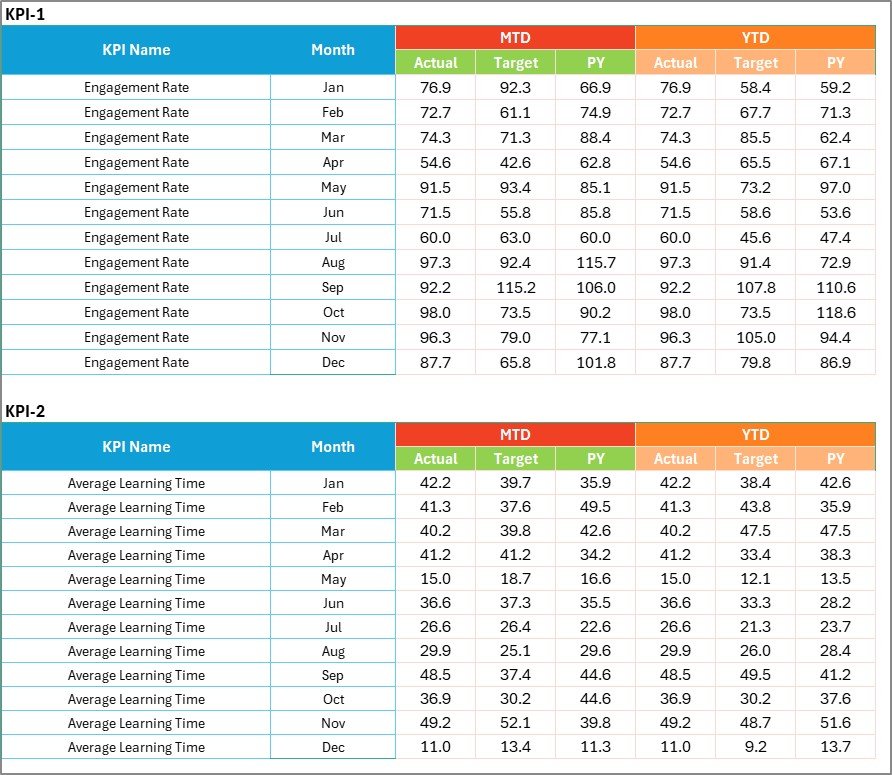
The Input Data Sheet acts as the database for all your KPI values. It’s simple to use, structured, and flexible.
Features include:
-
Data Entry: Add or update actuals, targets, and previous year numbers for every KPI.
-
Flexibility: Update your data anytime without changing the scorecard’s design or formulas.
-
Automatic Updates: Once you modify the input data, all linked charts and metrics refresh automatically.
This ensures your dashboard always stays current, giving you accurate insights without repetitive manual effort.
Click to Purchases Digital Learning KPI Scorecard in Excel
4️⃣ KPI Definition Sheet Tab

This sheet defines the foundation of your scorecard — the KPIs themselves.
You’ll find columns for:
-
KPI Name (e.g., Course Completion Rate, Average Quiz Score)
-
KPI Group (e.g., Engagement, Efficiency, Quality)
-
Unit of Measurement (%, Number, Hours, etc.)
-
Formula used to calculate the metric
-
KPI Definition explaining what it measures and why it matters
Having all KPI definitions in one place ensures consistency and transparency across departments or stakeholders who review the dashboard.
Common KPIs Tracked in the Digital Learning Scorecard
When you implement this Excel scorecard, you can track several performance indicators that reflect the success of your learning programs. Here are some of the most valuable KPIs:
-
Course Completion Rate (%): Tracks how many learners finish a course compared to those who started.
-
Average Quiz/Test Score: Measures learner knowledge retention.
-
Learner Engagement Level: Analyzes login frequency, time spent, and interaction rate.
-
Training Satisfaction Rating: Reflects learner feedback and perceived course quality.
-
Average Time to Completion: Shows how efficiently learners progress through content.
-
Cost per Learner: Calculates training cost efficiency.
-
Digital Learning ROI: Measures return on investment from online training programs.
-
Certification Success Rate: Indicates how many participants achieve certifications.
-
Active vs Inactive Learners: Highlights participation trends over time.
-
Course Feedback Score: Tracks post-training survey results.
Each of these KPIs can be visualized and compared against benchmarks or targets to ensure continuous improvement.
Click to Purchases Digital Learning KPI Scorecard in Excel
Why You Should Use Excel for Your Learning KPIs
While there are several LMS (Learning Management System) dashboards available, using Excel offers unique advantages for small and mid-sized organizations:
-
✅ Ease of Use: No coding or software installation needed.
-
✅ Full Customization: Add, delete, or modify KPIs and visuals based on your needs.
-
✅ Compatibility: Works across devices and versions of Excel.
-
✅ Instant Analysis: Use built-in formulas, pivot tables, and charts to perform ad-hoc analysis.
-
✅ Offline Access: Perfect for environments without continuous internet access.
Excel remains one of the most versatile tools for analytics and reporting — and when designed well, it delivers insights just as effectively as many expensive business-intelligence tools.
Click to Purchases Digital Learning KPI Scorecard in Excel
How to Use the Digital Learning KPI Scorecard
Follow these steps to start analyzing your e-learning performance immediately:
-
Open the Template: Launch the Excel file and review the available sheets.
-
Define Your KPIs: In the KPI Definition Sheet, list all metrics that are relevant to your training program.
-
Enter Your Data: Add monthly or weekly data for each KPI in the Input Data Sheet.
-
Select Analysis Type: Use dropdowns on the Scorecard Sheet to view MTD or YTD performance.
-
Review KPI Trends: Check the KPI Trend Sheet to analyze improvement or decline.
-
Interpret Visuals: Use traffic-light indicators and trend lines to understand where to take action.
Within minutes, you’ll have a full picture of your digital learning ecosystem’s health and performance.
Advantages of the Digital Learning KPI Scorecard
The benefits of implementing this Excel scorecard go far beyond basic reporting. It empowers educators, managers, and HR leaders to make better, data-driven decisions.
🎯 1. Centralized Learning Insights
Instead of collecting data from multiple spreadsheets or reports, the scorecard provides one unified view of all learning performance metrics. You can instantly see where your training efforts are paying off and where adjustments are needed.
📊 2. Real-Time Monitoring
The automated dashboard allows you to review progress instantly. As soon as you enter new data, the visuals and KPI cards update automatically, giving you live insights into learning efficiency.
📈 3. Enhanced Decision-Making
By comparing Actual vs Target and Current Year vs Previous Year values, you can make evidence-based decisions instead of relying on guesswork. This is especially valuable when justifying training budgets or strategy changes.
👥 4. Increased Accountability
Each KPI clearly defines expectations. When results fall below targets, teams can identify causes quickly and take corrective actions, ensuring accountability across departments.
💡 5. Continuous Improvement
The trend charts reveal whether performance is improving over time. This visibility encourages ongoing learning optimization and ensures long-term success for both learners and administrators.
Best Practices for Using the Digital Learning KPI Scorecard
To get the most value out of your Excel dashboard, follow these best practices:
1. Choose Relevant KPIs
Select KPIs that align with your learning goals. For instance, if your focus is employee upskilling, track completion rates, assessment scores, and engagement metrics.
2. Maintain Data Accuracy
Ensure all entries in the Input Data Sheet are correct. Small errors can distort charts and insights, so use data validation and consistent units of measurement.
3. Review Trends Regularly
Check your KPI trends every month to identify changes early. Timely reviews allow you to act fast if engagement drops or targets are missed.
4. Simplify Visualization
Keep your dashboard clean and uncluttered. Use color codes, simple charts, and concise text. A minimal design helps users quickly understand results.
5. Automate Where Possible
Use Excel formulas or macros to reduce manual input. For example, link your LMS export to automatically update key columns like completion rates or test scores.
6. Share Results with Stakeholders
Use the Scorecard Sheet for presentations. It helps communicate progress with leadership teams, ensuring everyone stays aligned with training objectives.
7. Update KPI Definitions Annually
Learning priorities evolve. Review and update your KPI definitions yearly to ensure they reflect your organization’s current training strategy.
Click to Purchases Digital Learning KPI Scorecard in Excel
Real-World Applications of the Digital Learning KPI Scorecard
The versatility of this tool makes it useful in multiple environments:
-
Corporate L&D Departments: Track employee training completion, e-learning effectiveness, and skill improvement.
-
Educational Institutions: Measure student engagement, performance, and satisfaction in online courses.
-
Consultants and Trainers: Showcase measurable outcomes to clients through data-driven dashboards.
-
Government and NGOs: Monitor training initiatives, outreach program participation, and digital literacy campaigns.
Regardless of your sector, the scorecard adapts to your goals and ensures that every digital learning activity is backed by measurable performance indicators.
How This Scorecard Enhances Learning ROI
One of the biggest challenges in digital education is proving the value of your training programs. With the KPI Scorecard, you can quantify ROI in clear numbers.
By comparing Training Cost vs Performance Improvement, organizations can demonstrate the financial impact of learning initiatives. For example:
-
A 10% improvement in average test scores may translate into higher productivity.
-
A reduced time-to-completion can mean faster onboarding and cost savings.
These metrics help justify investments in digital learning technologies and highlight the importance of continuous education.
Conclusion
The Digital Learning KPI Scorecard in Excel is more than just a data sheet — it’s a performance-driven roadmap for optimizing learning outcomes. By turning your data into insights, it bridges the gap between learning goals and measurable achievements.
It empowers decision-makers to monitor progress, compare results, and ensure that every training effort contributes to organizational growth. Whether you’re an educator, HR professional, or training consultant, this Excel scorecard offers a simple yet powerful way to manage digital learning performance effectively.
So, if you want to track your learners’ progress, analyze trends, and improve your online education strategy — start using the Digital Learning KPI Scorecard today.
Click to Purchases Digital Learning KPI Scorecard in Excel
Frequently Asked Questions (FAQs)
1. What is a Digital Learning KPI Scorecard?
It’s an Excel-based tool that tracks and visualizes key metrics related to digital education programs, helping you evaluate performance and improve learning outcomes.
2. How many KPIs can I track in this scorecard?
You can track as many KPIs as needed. The template is fully customizable, so you can add or remove KPIs based on your learning objectives.
3. Is it suitable for both schools and corporate training?
Yes. It’s designed for flexibility, making it suitable for educational institutions, HR departments, and training consultants alike.
4. Can I modify the KPIs and charts?
Absolutely. You can edit KPI names, formulas, and visuals to match your unique requirements without affecting the core functionality.
5. How often should I update the data?
For best results, update your data monthly or quarterly depending on how frequently your learning programs run.
6. Does this scorecard work with all Excel versions?
Yes. It’s compatible with Microsoft Excel 2016 and later versions, as well as Office 365.
7. Can I analyze performance by region or department?
Yes. You can add filters and pivot tables to categorize data by region, department, or course type easily.
8. Do I need advanced Excel skills to use it?
No. The dashboard is user-friendly and ready to use out of the box. Basic Excel knowledge is enough to start analyzing results.
Click to Purchases Digital Learning KPI Scorecard in Excel
Visit our YouTube channel to learn step-by-step video tutorials