In the fast-moving world of online fashion retail, every sale, discount, and return provides valuable insight into customer behavior and business performance. However, managing these data points manually can become overwhelming. That’s why the Fashion E-commerce Dashboard in Excel is the perfect solution.
This ready-to-use Excel dashboard allows fashion brands and e-commerce businesses to monitor performance, analyze trends, and make data-driven decisions — all within a simple, interactive interface.
Click to Purchases Fashion E-commerce Dashboard in Excel
What Is a Fashion E-commerce Dashboard in Excel?
A Fashion E-commerce Dashboard in Excel is a pre-built data analysis tool designed to consolidate your key e-commerce metrics into one organized, visual file. It helps business owners track sales, profit, discount percentages, return rates, delivery status, and customer satisfaction in real time.
By using this Excel dashboard, you can stop guessing and start making decisions backed by numbers. The dashboard uses automated charts, slicers, and dropdowns to help you explore performance by brand, payment method, or region — without needing any complex software or coding skills.
Dashboard Structure and Key Features
This Excel dashboard includes five analytical pages, a support sheet, and a data sheet, giving you complete visibility into your e-commerce operations.
Click to Purchases Fashion E-commerce Dashboard in Excel
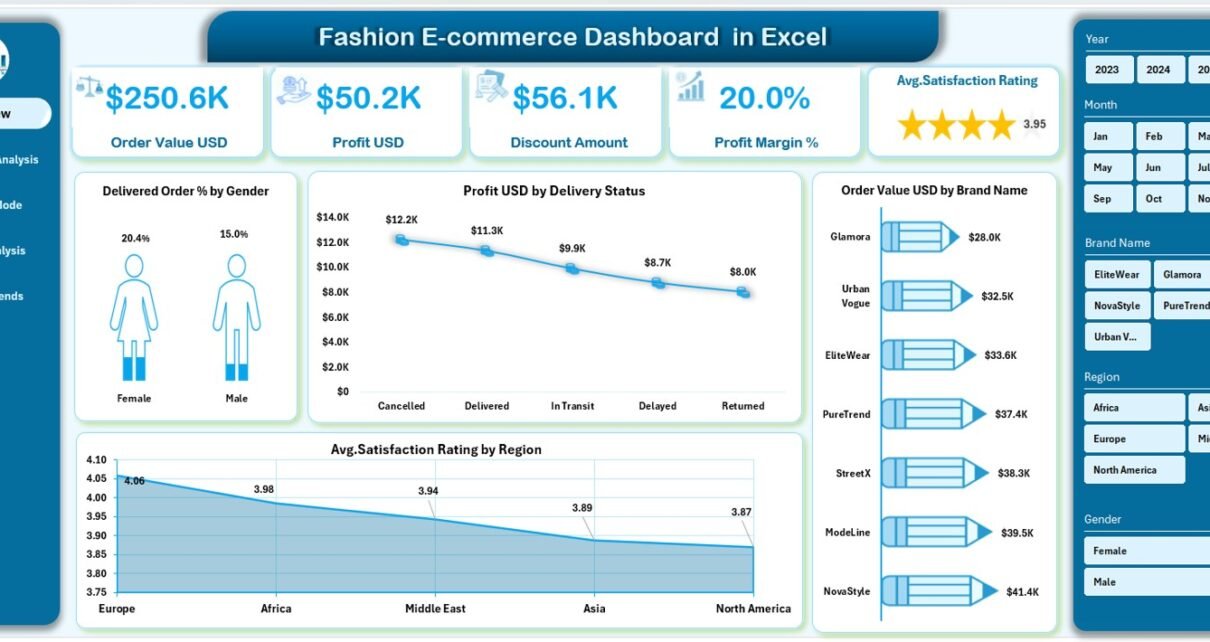
1️⃣ Overview Page
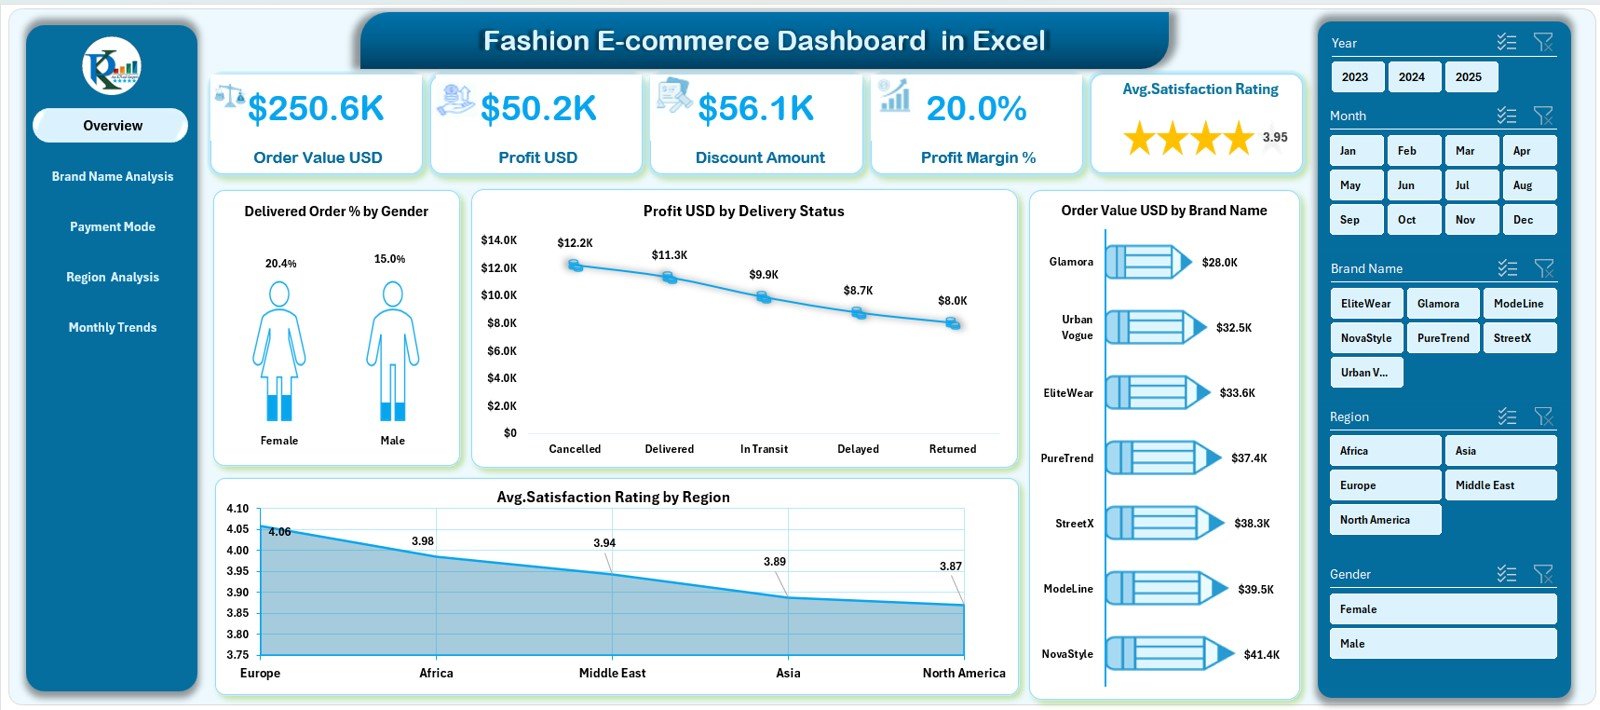
The Overview Page is the main hub of the dashboard. It displays essential KPIs, performance charts, and a clean visual layout for instant insights.
Highlights:
-
Page Navigator (Left Side): Quick buttons to jump between analytical pages.
-
KPI Cards (Top Section): Show Total Orders, Total Revenue, Profit (USD), Average Order Value, and Customer Satisfaction.
-
Charts Displayed:
-
Delivered Orders (%) by Gender
-
Profit (USD) by Delivery Status
-
Order Value (USD) by Brand Name
-
Average Satisfaction Rating by Region
-
This section delivers a complete overview of performance — perfect for senior leaders who need to evaluate results at a glance.
2️⃣ Brand Name Analysis Page
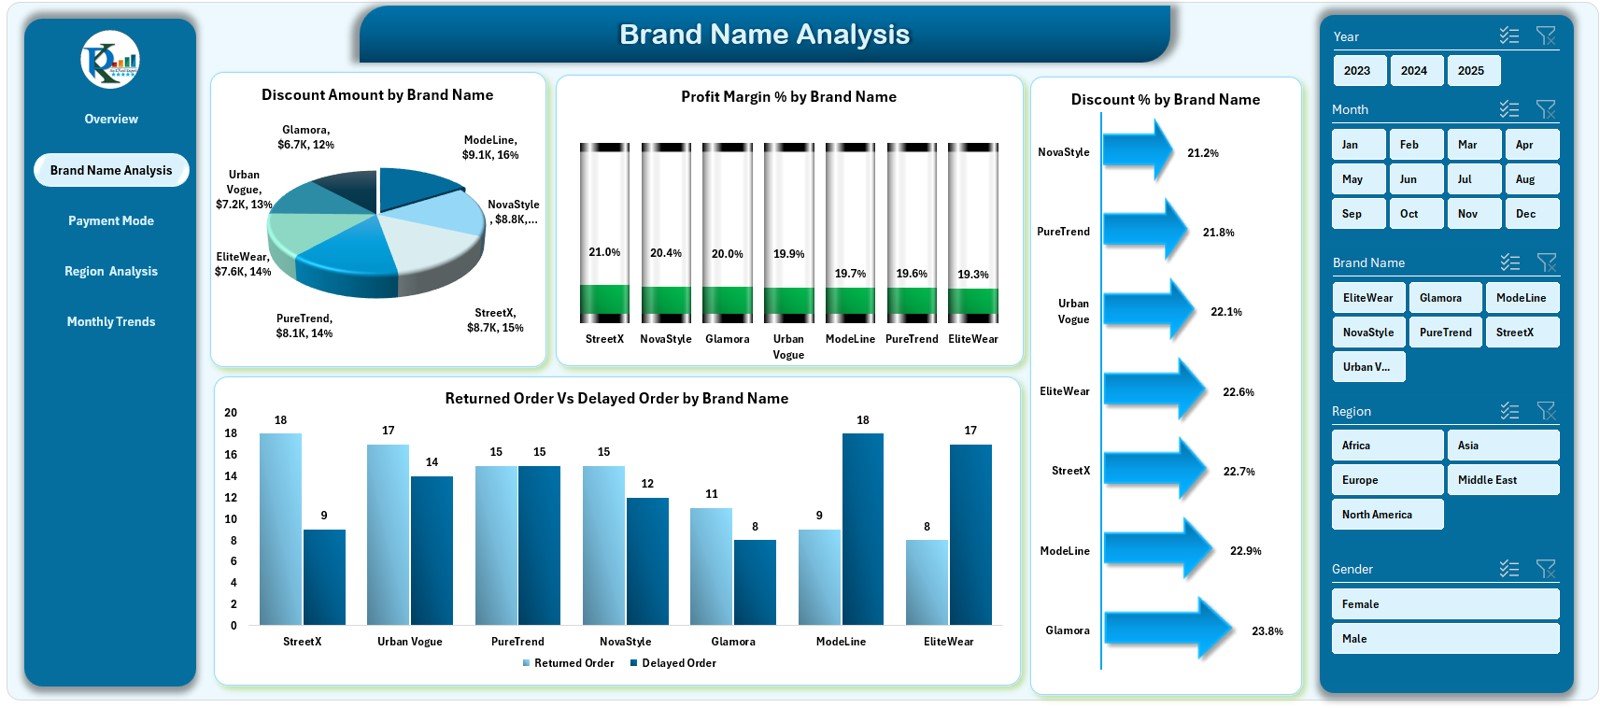
The Brand Name Analysis Page helps analyze the profitability, discounts, and performance of different brands.
Charts Included:
-
Order Discount Amount by Brand Name
-
Profit Margin (%) by Brand Name
-
Discount (%) by Brand Name
-
Returned vs Delayed Orders by Brand Name
This allows managers to identify the best-performing brands and detect those affecting margins or facing frequent returns.
Click to Purchases Fashion E-commerce Dashboard in Excel
3️⃣ Payment Mode Analysis Page
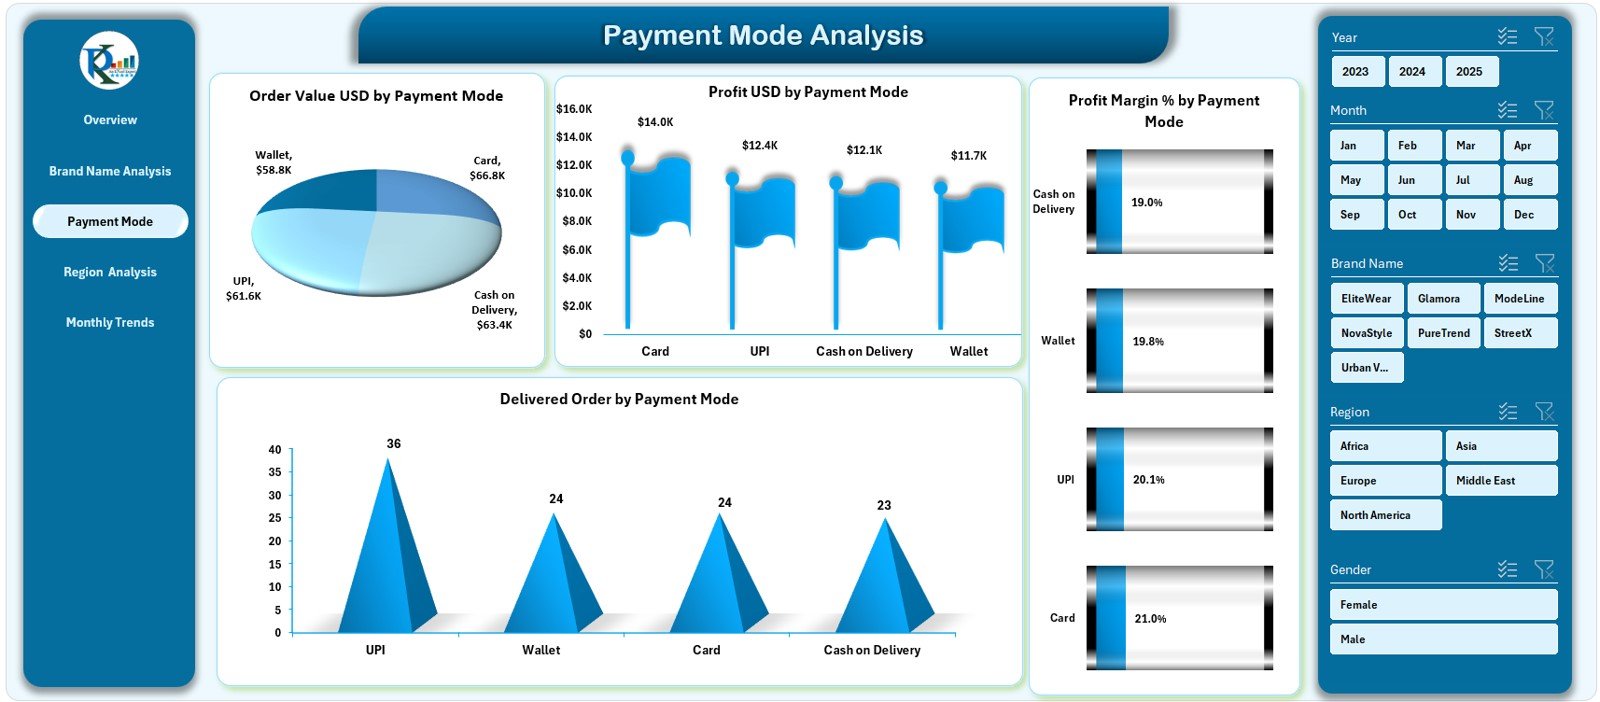
Payment preferences provide insights into customer trust and purchase behavior.
Charts Displayed:
-
Order Value (USD) by Payment Mode
-
Profit (USD) by Payment Mode
-
Profit Margin (%) by Payment Mode
-
Delivered Orders by Payment Mode
By studying these visuals, you can determine which payment methods generate higher profit or fewer delivery issues.
4️⃣ Region Analysis Page
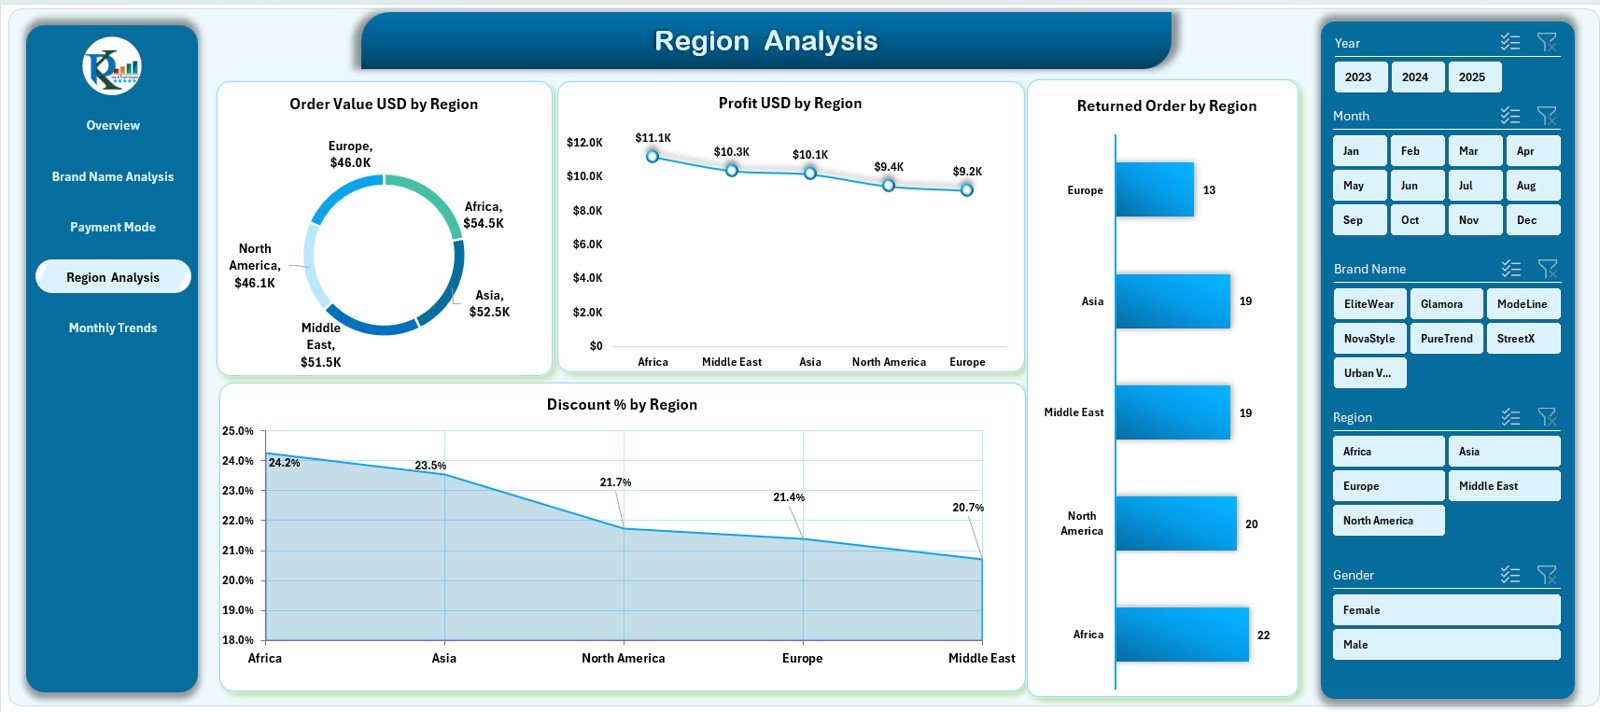
Understanding how performance differs by location is vital in fashion e-commerce.
Charts Included:
-
Order Value (USD) by Region
-
Profit (USD) by Region
-
Returned Orders by Region
-
Discount (%) by Region
These insights help optimize marketing campaigns, logistics, and inventory allocation for each region.
5️⃣ Monthly Trends Page
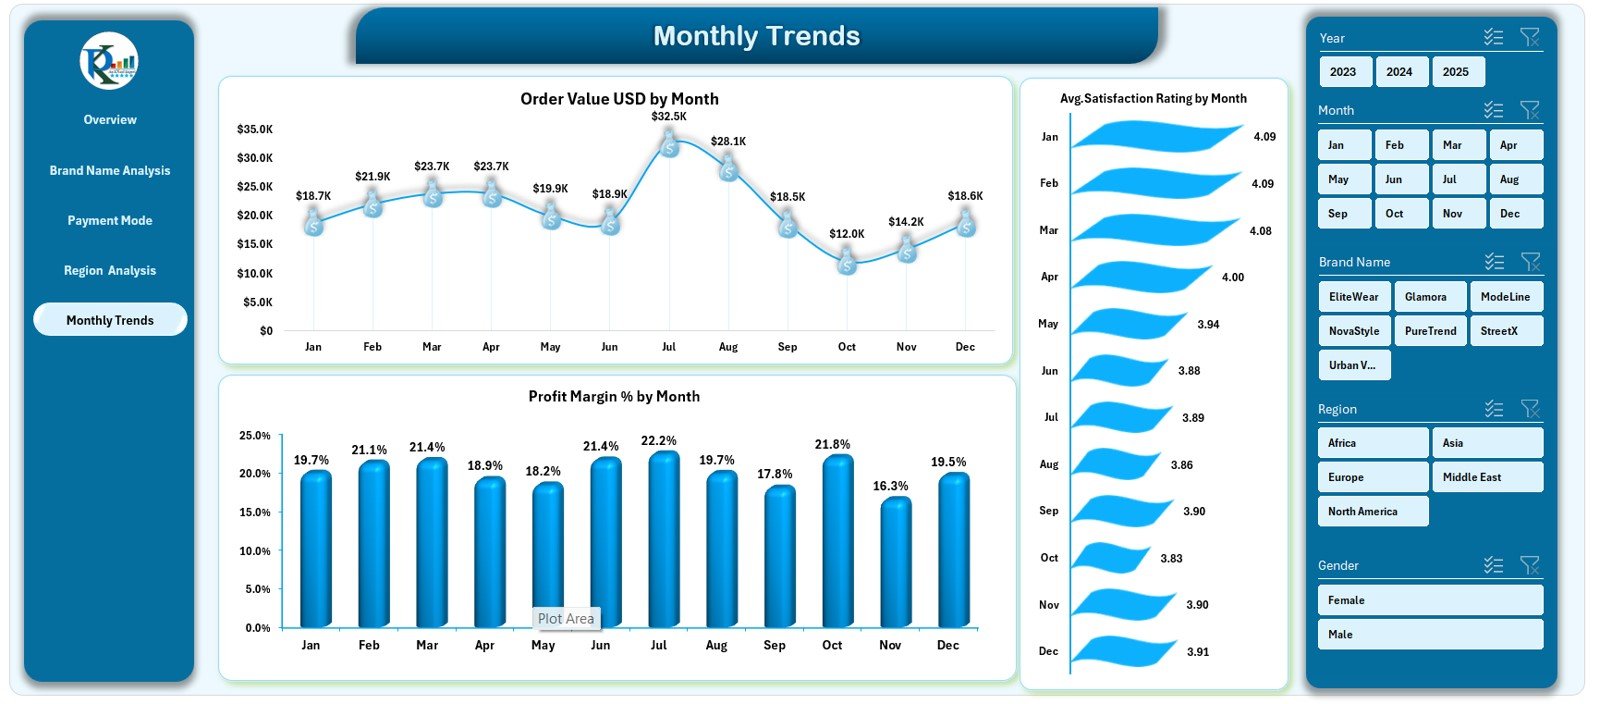
The Monthly Trends Page visualizes sales and satisfaction patterns throughout the year.
Charts Displayed:
-
Order Value (USD) by Month
-
Average Satisfaction Rating by Month
-
Profit Margin (%) by Month
This page helps detect seasonal trends and evaluate the impact of marketing campaigns or festive promotions.
Click to Purchases Fashion E-commerce Dashboard in Excel
Support Sheet and Data Sheet
-
Support Sheet: Contains reference tables, dropdowns, and helper values that drive dashboard functionality.
-
Data Sheet: The backbone of the dashboard. It stores your raw e-commerce data including order date, brand, payment mode, delivery status, region, profit, and satisfaction rating.
Updating this sheet automatically refreshes the entire dashboard.
Core KPIs Tracked in the Dashboard
The Fashion E-commerce Dashboard tracks all the critical KPIs needed for fashion analytics:
-
🛍️ Total Orders
-
💰 Total Revenue (USD)
-
📈 Profit (USD) & Profit Margin (%)
-
🎯 Average Order Value (USD)
-
👕 Delivered Orders (%) by Gender
-
📦 Returned & Delayed Orders
-
🏷️ Discounts Amount & %
-
💳 Payment Mode Performance
-
🌍 Regional Profitability
-
😊 Customer Satisfaction Score
-
📅 Monthly Trends in Sales & Ratings
These KPIs give a complete view of sales health, customer engagement, and financial performance.
Why Use Excel for Fashion E-commerce Analytics
Excel remains one of the most powerful tools for quick, flexible, and low-cost analytics. Here’s why it’s ideal for e-commerce professionals:
-
✅ No Additional Software: Everything runs directly in Excel.
-
✅ Ease of Use: No coding or advanced BI knowledge required.
-
✅ Interactive Design: Slicers, charts, and navigation simplify analysis.
-
✅ Affordable and Accessible: Perfect for startups and small retailers.
-
✅ Fully Customizable: Add KPIs or change visuals anytime.
For teams that want professional-level insights without expensive tools, this Excel dashboard delivers exceptional value.
How to Use the Fashion E-commerce Dashboard
You can set up and analyze your data in just a few steps:
-
Open the Dashboard File — Start on the Overview Page.
-
Enter Data — Paste all order details in the Data Sheet.
-
View KPIs — The dashboard automatically calculates metrics.
-
Filter Data — Use slicers for Month, Brand, Gender, or Region.
-
Explore Pages — Navigate to Brand, Payment, or Region analysis pages.
-
Check Monthly Trends — Identify seasonal performance peaks and dips.
The dashboard updates instantly whenever you refresh your data.
Click to Purchases Fashion E-commerce Dashboard in Excel
Advantages of the Fashion E-commerce Dashboard in Excel
1️⃣ Unified Business View
All performance data—orders, profits, returns, and discounts—comes together in one place.
2️⃣ Real-Time Analysis
As soon as you input or update your data, visuals and metrics refresh automatically.
3️⃣ Deeper Brand Insights
Compare profit margins and discount impact across multiple fashion brands.
4️⃣ Smarter Decision-Making
Visual trends reveal which regions, payment modes, or campaigns deliver the best results.
5️⃣ Time-Saving Automation
Built-in formulas and conditional formatting eliminate repetitive reporting work.
6️⃣ Customizable Interface
Adjust KPIs, visuals, or color themes to match your brand’s style.
Best Practices for Using the Dashboard
To get maximum value from your dashboard, follow these best practices:
1. Maintain Clean Data
Use consistent labels for brands, payment modes, and regions to ensure accuracy.
2. Update Data Regularly
Refresh your dataset weekly or monthly for up-to-date insights.
3. Focus on Actionable Metrics
Prioritize KPIs that influence business growth—profit, satisfaction, and return rate.
4. Leverage the Trend Charts
Review monthly charts to identify growth patterns or declining periods.
5. Optimize Discounts
Compare brand-level discounts with profit margins to find the right balance.
6. Monitor Delivery and Returns
High return rates may indicate sizing or quality issues that need addressing.
Click to Purchases Fashion E-commerce Dashboard in Excel
Who Can Benefit from This Dashboard
This Excel dashboard benefits multiple roles across the fashion retail ecosystem:
-
E-commerce Managers: Get an overview of sales, profit, and customer feedback.
-
Marketing Teams: Track campaign ROI and promotional effectiveness.
-
Operations Managers: Monitor return rates and regional delivery issues.
-
Finance Teams: Analyze discounts, margins, and revenue breakdowns.
-
Brand Partners: Evaluate brand-wise profitability and order trends.
In short, anyone who manages or monitors online fashion performance will find this dashboard invaluable.
Conclusion
The Fashion E-commerce Dashboard in Excel simplifies data analysis for modern retailers.
It organizes your order, payment, and regional performance into clear visuals that help you make faster, smarter business decisions. Whether you’re running a single boutique or a multi-brand store, this dashboard saves time, enhances visibility, and supports profitable growth.
If you want to transform your raw e-commerce data into actionable insights — this Excel dashboard is your perfect starting point.
Frequently Asked Questions (FAQs)
1. What is the Fashion E-commerce Dashboard in Excel?
It’s an interactive Excel tool that tracks sales, profits, discounts, returns, and customer satisfaction for online fashion retailers.
2. How many analysis pages does it have?
It includes five main pages — Overview, Brand, Payment, Region, and Monthly Trends.
3. Can I use it for multiple brands?
Yes. The dashboard supports multiple brands and compares their performance visually.
4. Do I need to code to use it?
No coding required. Everything works through Excel formulas and slicers.
5. How often should I update data?
You can update weekly or monthly depending on sales volume.
6. What kind of insights can I get?
You can track profits by brand, region, or payment mode and monitor monthly growth trends.
7. Is it compatible with all Excel versions?
Yes, it works with Excel 2016 or later versions, including Office 365.
8. Can I modify the charts or colors?
Absolutely. You can edit visuals to match your business theme.
Click to Purchases Fashion E-commerce Dashboard in Excel
Visit our YouTube channel to learn step-by-step video tutorials