In the modern education landscape, data-driven decision-making has become vital for managing schools effectively. Principals, administrators, and education boards now rely on data to measure progress, evaluate teacher performance, analyze student outcomes, and manage operational efficiency. The Secondary Schools KPI Dashboard in Power BI serves as a powerful tool that simplifies this process.
This dashboard provides an interactive, visual, and easy-to-understand overview of school performance, empowering educators to make informed decisions at every level.
Click to Purchases Secondary Schools KPI Dashboard in Power BI
🧠 What Is a Secondary Schools KPI Dashboard in Power BI?
A Secondary Schools KPI Dashboard in Power BI is a ready-to-use, data analytics solution built specifically for schools and educational institutions. It connects to your data (stored in Excel or other sources) and transforms it into an insightful dashboard showing key performance indicators (KPIs) across multiple areas such as academics, attendance, finances, and teacher performance.
This Power BI dashboard helps you:
-
Track and visualize student performance and attendance.
-
Compare current vs previous year performance.
-
Analyze KPI trends across departments or grades.
-
Identify improvement areas instantly with visual cues.
-
Monitor targets vs actual performance for both MTD (Month-to-Date) and YTD (Year-to-Date) values.
It acts as a single source of truth for all performance data — enabling better accountability and continuous improvement.
Click to Purchases Secondary Schools KPI Dashboard in Power BI
📊 Key Features of the Secondary Schools KPI Dashboard
This Power BI template contains three primary analytical pages, each serving a distinct purpose.
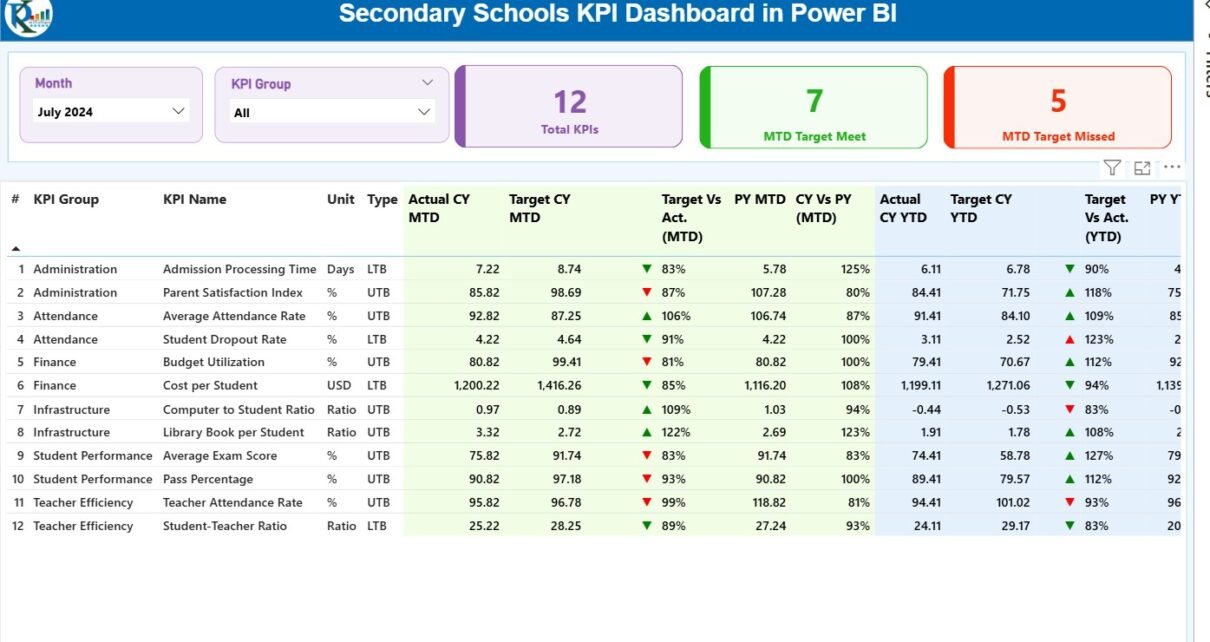
1️⃣ Summary Page – The Main Performance Hub
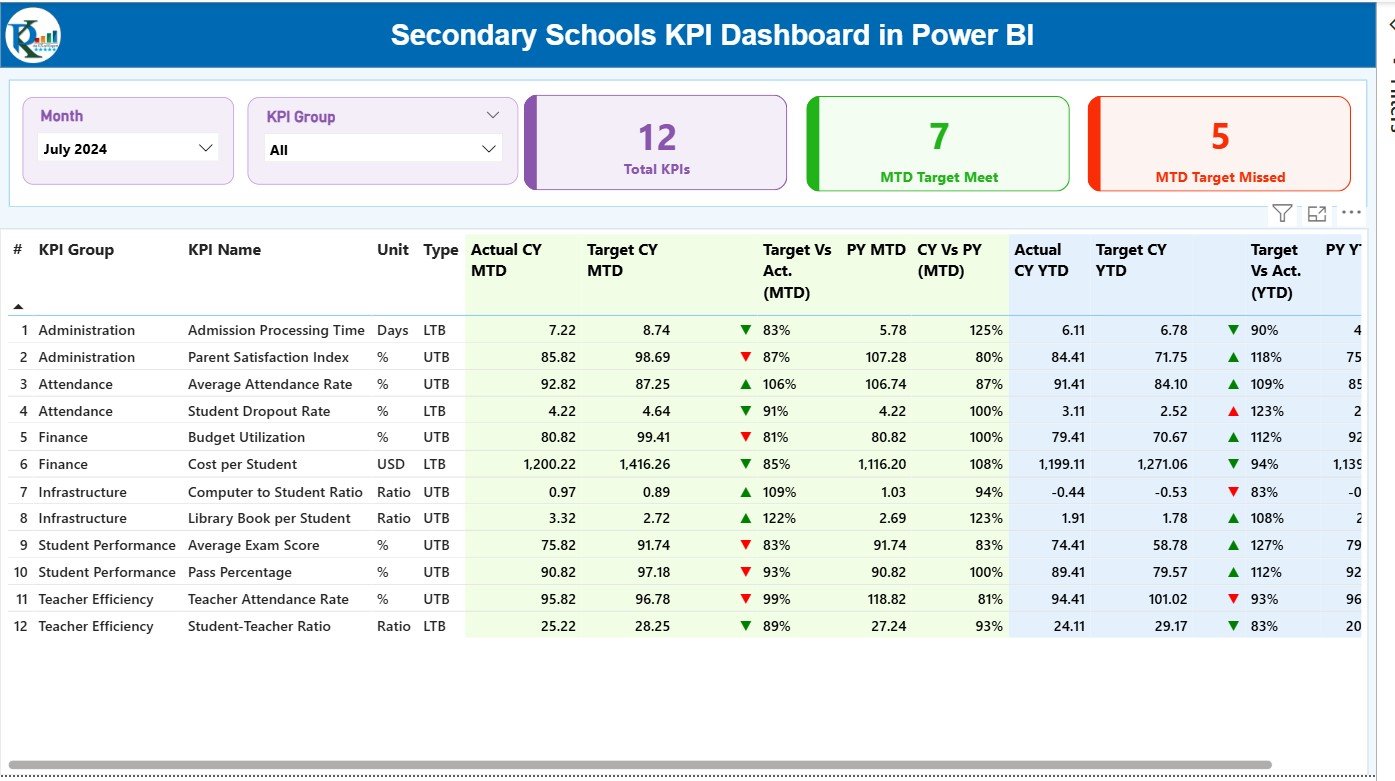
The Summary Page provides an overview of all KPIs with detailed breakdowns and dynamic visuals. It’s the main analytical hub for monitoring overall performance.
Key Components:
-
🗓 Month & KPI Group Slicers: Easily filter the data by month or KPI category for a focused view.
-
🧮 KPI Cards: Show key metrics such as:
-
Total KPIs Count
-
MTD Target Met
-
MTD Target Missed
-
-
📋 Detailed Table View: Displays all essential data fields, including:
-
KPI Number
-
KPI Group
-
KPI Name
-
Unit of Measurement
-
Type (LTB – Lower the Better or UTB – Upper the Better)
-
Actual CY MTD & Target CY MTD
-
MTD Icons (Green ▲ or Red ▼)
-
Target vs Actual (MTD %)
-
PY MTD & CY vs PY (MTD %)
-
Actual CY YTD & Target CY YTD
-
YTD Icons (Green ▲ or Red ▼)
-
Target vs Actual (YTD %)
-
PY YTD & CY vs PY (YTD %)
-
This structure enables school administrators to assess whether current results meet both short-term and long-term targets. For instance, if student attendance drops compared to last year, you can immediately investigate contributing factors.
Click to Purchases Secondary Schools KPI Dashboard in Power BI
2️⃣ KPI Trend Page – Understand the Story Behind the Numbers
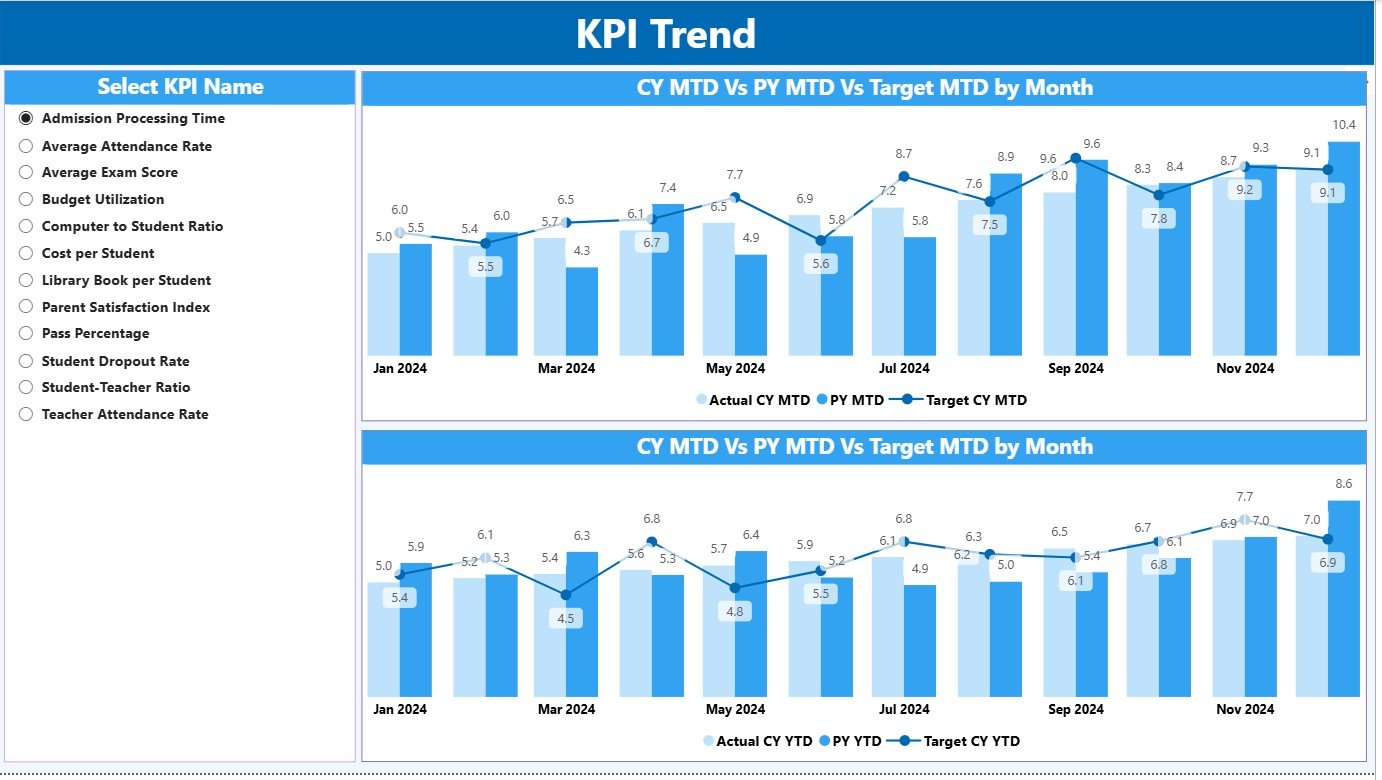
The KPI Trend Page offers dynamic trend analysis using combo charts that plot Actual, Target, and Previous Year values for both MTD and YTD.
Page Highlights:
-
🎯 Interactive Slicer: Select a KPI (e.g., “Average Exam Score” or “Teacher Attendance %”) from the slicer to visualize its performance.
-
📈 Trend Charts: View month-by-month comparison between actual and target data.
-
🔄 Performance Patterns: Identify seasonal or behavioral trends, helping administrators forecast results and plan interventions early.
This page turns raw numbers into actionable visuals — ensuring data isn’t just collected but truly understood.
Click to Purchases Secondary Schools KPI Dashboard in Power BI
3️⃣ KPI Definition Page – The Reference Hub
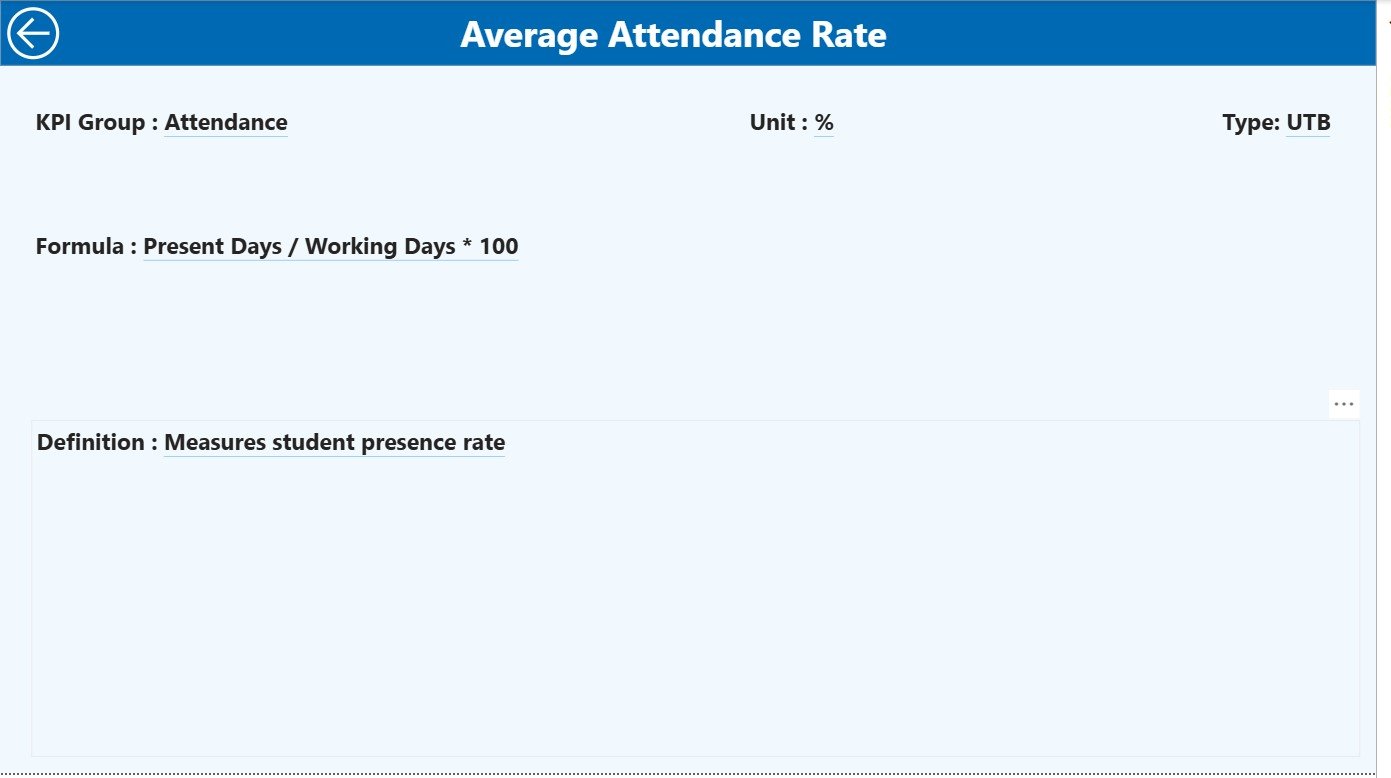
The KPI Definition Page acts as a drill-through page (hidden by default) that users can access from the summary view. It contains in-depth details about every KPI such as:
-
KPI Formula
-
Definition
-
Unit
-
Type (UTB/LTB)
To return to the Summary Page, simply click the “Back” button on the top-left corner.
This ensures that every stakeholder knows exactly how each KPI is calculated — eliminating confusion and ensuring consistency in performance reporting.
📂 Excel Data Source and Structure
The dashboard uses a structured Excel file as its data source. It includes three key worksheets for organized data entry:
📑 1. Input_Actual Sheet Tab
Enter all actual numbers for KPIs by:
-
KPI Name
-
Month (use the first day of each month)
-
MTD Number
-
YTD Number
📑 2. Input_Target Sheet Tab
Fill in the target numbers for the same structure:
-
KPI Name
-
Month
-
MTD Target
-
YTD Target
📑 3. KPI Definition Sheet Tab
List every KPI’s attributes:
-
KPI Number
-
KPI Group
-
KPI Name
-
Unit
-
Formula
-
Definition
-
Type (LTB or UTB)
Once the data is updated, Power BI automatically refreshes visuals and analytics across all pages — ensuring your school’s performance report is always up-to-date.
🧩 Key Performance Indicators (KPIs) for Secondary Schools
Here are some commonly included KPIs in the Secondary Schools KPI Dashboard:
🎓 Academic KPIs
-
Average Exam Score (%)
-
Pass Rate (%)
-
Top Performer Count
-
Average GPA by Class
🧑🏫 Teacher KPIs
-
Teacher Attendance Rate (%)
-
Lesson Plan Completion (%)
-
Student Feedback Score (1–5)
-
Training Hours per Teacher
🧍 Student KPIs
-
Attendance Rate (%)
-
Disciplinary Cases
-
Homework Submission %
-
Participation in Extracurricular Activities
💰 Financial KPIs
-
Fee Collection Rate (%)
-
Operational Cost per Student (USD)
-
Resource Utilization %
-
Scholarship Fund Distribution %
🏫 Administrative KPIs
-
Parent Meeting Attendance (%)
-
Staff-to-Student Ratio
-
Facility Maintenance Requests
-
Technology Utilization Rate
Each KPI offers measurable insights into academic performance, financial management, and operational efficiency — essential for informed school leadership.
Click to Purchases Secondary Schools KPI Dashboard in Power BI
🌟 Advantages of Secondary Schools KPI Dashboard in Power BI
Using Power BI for KPI monitoring provides numerous advantages over manual reporting systems.
✅ 1. Real-Time Insights
Get instant updates as soon as data changes in Excel. Power BI automatically reflects new numbers in charts and tables.
✅ 2. Enhanced Decision-Making
Analyze actual vs target data with visual cues, helping you take timely actions when performance drops.
✅ 3. Intuitive Visualization
Color-coded icons, slicers, and interactive charts make data interpretation fast and engaging.
✅ 4. Centralized Reporting
Access all KPI details, trends, and definitions from one dashboard — no need to manage multiple reports.
✅ 5. Improved Accountability
Teachers, departments, and administrators can track their KPIs transparently, promoting responsibility and improvement.
✅ 6. Historical Comparison
Easily compare current performance with previous year results using built-in MTD and YTD comparison features.
✅ 7. Cost-Efficient Implementation
No need for expensive BI software — Power BI integrates seamlessly with Excel and works with your existing data.
💡 How to Use the Secondary Schools KPI Dashboard
Follow these steps to make the most of this dashboard:
-
Prepare the Excel Data File – Fill in all KPI definitions, actuals, and targets as per your school’s records.
-
Open Power BI Desktop – Import the Excel file and refresh the data connection.
-
Navigate the Dashboard Pages – Use slicers to select months, KPIs, or categories.
-
Drill Through KPI Details – From the summary table, right-click on a KPI and go to the KPI Definition page for more info.
-
Export Reports – Share monthly or yearly reports directly as PDFs or interactive Power BI links.
Within minutes, you can analyze and present school performance without manual effort.
Click to Purchases Secondary Schools KPI Dashboard in Power BI
🧭 Best Practices for Using the KPI Dashboard
To ensure accuracy and reliability, follow these proven practices:
🎯 1. Keep KPIs Simple and Actionable
Avoid overloading the dashboard with too many metrics. Focus on those that directly influence school success.
🕒 2. Update Data Monthly
Ensure all actuals and targets are updated regularly to maintain report accuracy.
🧮 3. Standardize KPI Definitions
Use consistent formulas and definitions to ensure uniform understanding across departments.
📊 4. Use Color Indicators Effectively
Green for achieved, red for missed, and yellow for near-target — simple color codes make results easy to read.
🧠 5. Review Trends, Not Just Numbers
Look for consistent improvements or declines instead of focusing on a single month’s performance.
🤝 6. Involve Stakeholders
Share results with teachers, coordinators, and administrators for collective improvement.
💾 7. Maintain Backups
Keep periodic backups of your Excel source files to preserve historical data.
🔍 Tips to Customize Your Power BI Dashboard
-
Add filters for Class, Department, or Subject.
-
Include additional visuals like stacked bars for student categories or donut charts for fee collection.
-
Use Power BI’s Publish to Web or SharePoint Integration to make reports accessible to management.
-
Enable Role-Level Security (RLS) so teachers can view only relevant data.
-
Automate data refresh using Power BI Service for real-time updates.
🧾 Common Challenges and How to Overcome Them
⚠️ Challenge 1: Inconsistent Data Entry
Solution: Implement Excel validation lists to prevent typos and errors.
⚠️ Challenge 2: Misaligned Targets
Solution: Review target-setting criteria with all departments to ensure fairness and accuracy.
⚠️ Challenge 3: Misinterpretation of Results
Solution: Use the KPI Definition Page for reference so everyone understands the same metric logic.
Click to Purchases Secondary Schools KPI Dashboard in Power BI
🏫 Who Can Benefit from This Dashboard?
The Secondary Schools KPI Dashboard in Power BI is designed for:
-
Principals and Administrators – For strategic oversight and performance evaluation.
-
Teachers and Heads of Departments – To track academic and attendance KPIs.
-
Finance and HR Teams – To monitor cost, fee collection, and staffing efficiency.
-
Education Boards – For comparing school performance across multiple institutions.
Whether you manage one school or an entire district, this tool enhances your ability to make informed, data-backed decisions.
🏁 Conclusion
The Secondary Schools KPI Dashboard in Power BI transforms traditional school reporting into a smart, interactive, and data-driven system. It empowers school leaders to visualize KPIs, identify performance gaps, and create actionable plans for improvement.
With clear visuals, trend analysis, and automatic updates, this dashboard bridges the gap between raw data and strategic decision-making — ensuring your school continues to achieve excellence year after year.
❓ Frequently Asked Questions (FAQs)
1. What is the purpose of a Secondary Schools KPI Dashboard?
It measures academic, operational, and financial performance through interactive Power BI visuals, helping administrators make better decisions.
2. Can I use my own data source?
Yes, the dashboard works with Excel and can be connected to databases or cloud services for automatic data refresh.
3. Does it require advanced Power BI knowledge?
Not at all. The template is beginner-friendly and requires only basic Power BI skills to operate.
4. How do I refresh data after updating Excel?
Simply click “Refresh” in Power BI Desktop, and all charts and visuals update instantly.
5. Can I customize the KPIs?
Absolutely. You can add, modify, or remove KPIs in the Excel source file and refresh the Power BI model.
6. How often should I update my KPI data?
It’s best to update data monthly or quarterly, depending on how frequently you review performance.
7. Is this dashboard suitable for non-technical users?
Yes, the intuitive layout, slicers, and cards make it easy for anyone to navigate and interpret results.
Click to Purchases Secondary Schools KPI Dashboard in Power BI
Visit our YouTube channel to learn step-by-step video tutorials