Logistics leaders work every day to reduce delivery delays, control shipping costs, and improve customer satisfaction. But when shipment data sits in multiple systems or scattered spreadsheets, decision-makers cannot see what is happening in real time. They spend hours searching, calculating, and updating reports instead of making strategic moves.
A Shipping Dashboard in Power BI solves this problem. It consolidates all shipping, freight, cost, and delivery information into one visual and interactive platform. Leaders gain instant insights, identify trends, and take quick action to improve supply chain performance.
In this article, you will learn everything about the Shipping Dashboard in Power BI—its structure, features, benefits, best practices, and how it helps logistics teams make smarter decisions. You will also see how each dashboard page works and why it creates a strong advantage for operations.
Click to Purchases Shipping Dashboard in Power BI
What Is a Shipping Dashboard in Power BI?
A Shipping Dashboard in Power BI is a visual reporting solution that tracks key metrics related to transportation, freight cost, delivery performance, customer satisfaction, shipment mode, regions, and more. Because Power BI uses interactive visuals, slicers, and drill-down features, users explore data with ease and understand the insights faster.
Logistics teams use this dashboard to monitor trends, compare costs, identify bottlenecks, evaluate carrier performance, track regional behavior, and analyze shipping modes. Since Power BI updates data with a single click, leaders can always work with fresh and accurate information.
📊 Key Features of the Shipping Dashboard in Power BI
This dashboard contains five powerful pages, each designed to support a different area of shipping and logistics analysis.
1️⃣ Overview Page
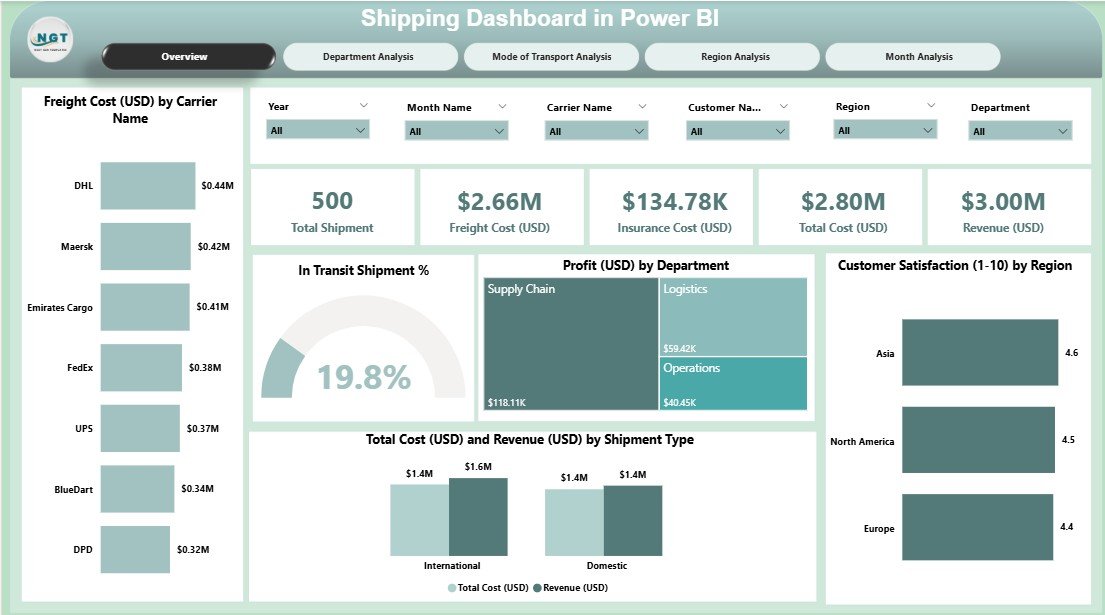
The Overview Page works as the main control center of the entire dashboard. Users select a Month and KPI Group using slicers, and the whole dashboard updates instantly.
This page includes:
✔ Five KPI Cards
These cards display the most critical KPIs for quick decision-making.
✔ Five Analytical Charts
-
Freight Cost (USD) by Carrier
-
In Transit Shipment %
-
Profit (USD) by Department
-
Customer Satisfaction by Region
-
Total Cost (USD) and Revenue (USD) by Shipment Type
Click to Purchases Shipping Dashboard in Power BI
These visuals help leaders compare performance across carriers, departments, and regions. They also highlight whether shipping operations are profitable or not.
2️⃣ Department Analysis Page
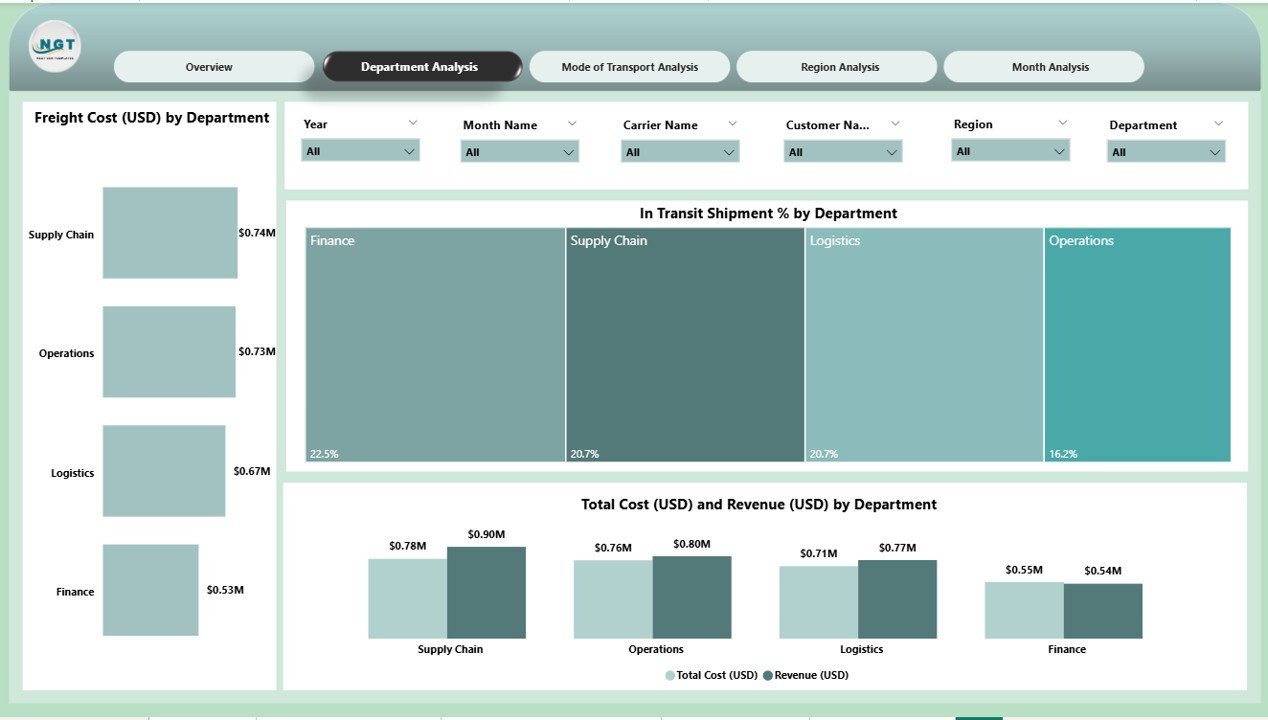
The Department Analysis Page helps operations managers understand how each department performs. Because every department handles different products, delivery volumes, and cost centers, this page becomes essential.
This page includes:
-
Freight Cost (USD) by Department
-
In Transit Shipment % by Department
-
Total Cost (USD) and Revenue (USD) by Department
Users compare departments and quickly find high-cost areas, delays, or performance gaps.
3️⃣ Mode of Transport Analysis Page
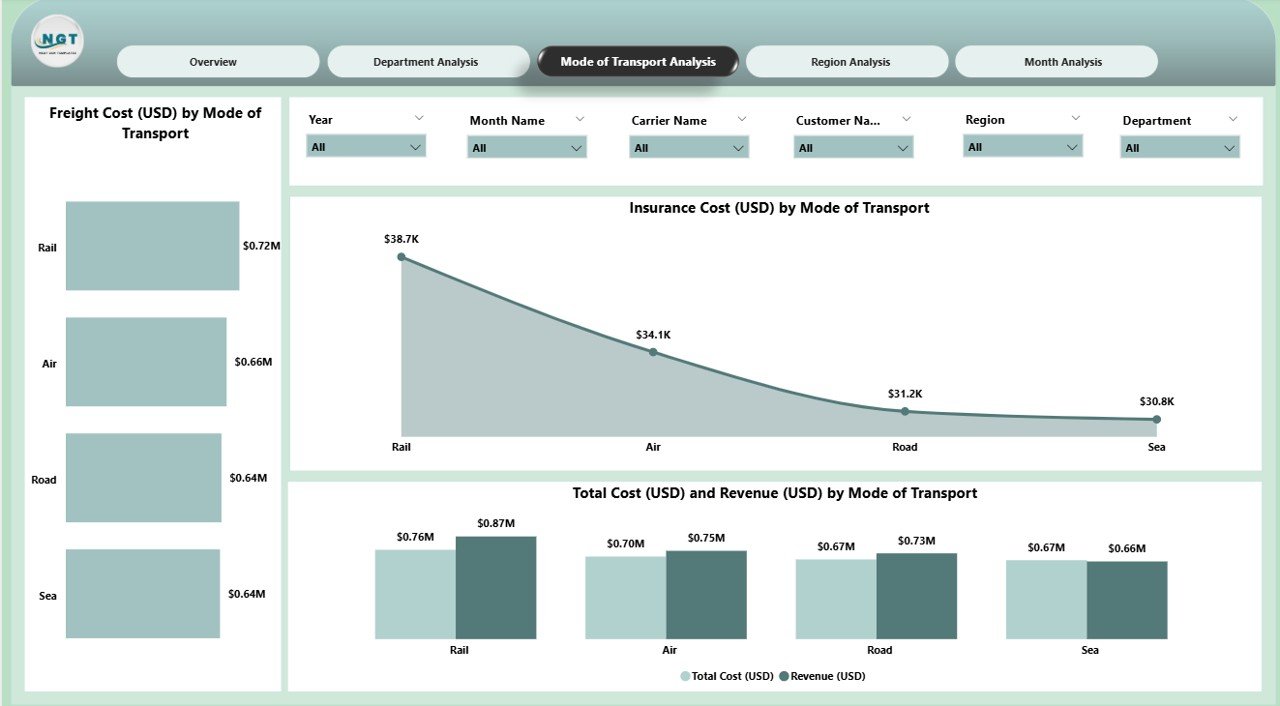
This section focuses on the effectiveness of different transportation modes. Teams often use various modes such as Air, Road, Rail, and Sea, and this page shows which mode drives cost, revenue, and insurance impact.
This page includes:
-
Freight Cost (USD) by Mode of Transport
-
Insurance Cost (USD) by Mode of Transport
-
Total Cost (USD) and Revenue (USD) by Mode of Transport
Decision-makers adjust shipping strategies and choose the most cost-efficient modes after viewing this page.
4️⃣ Region Analysis Page
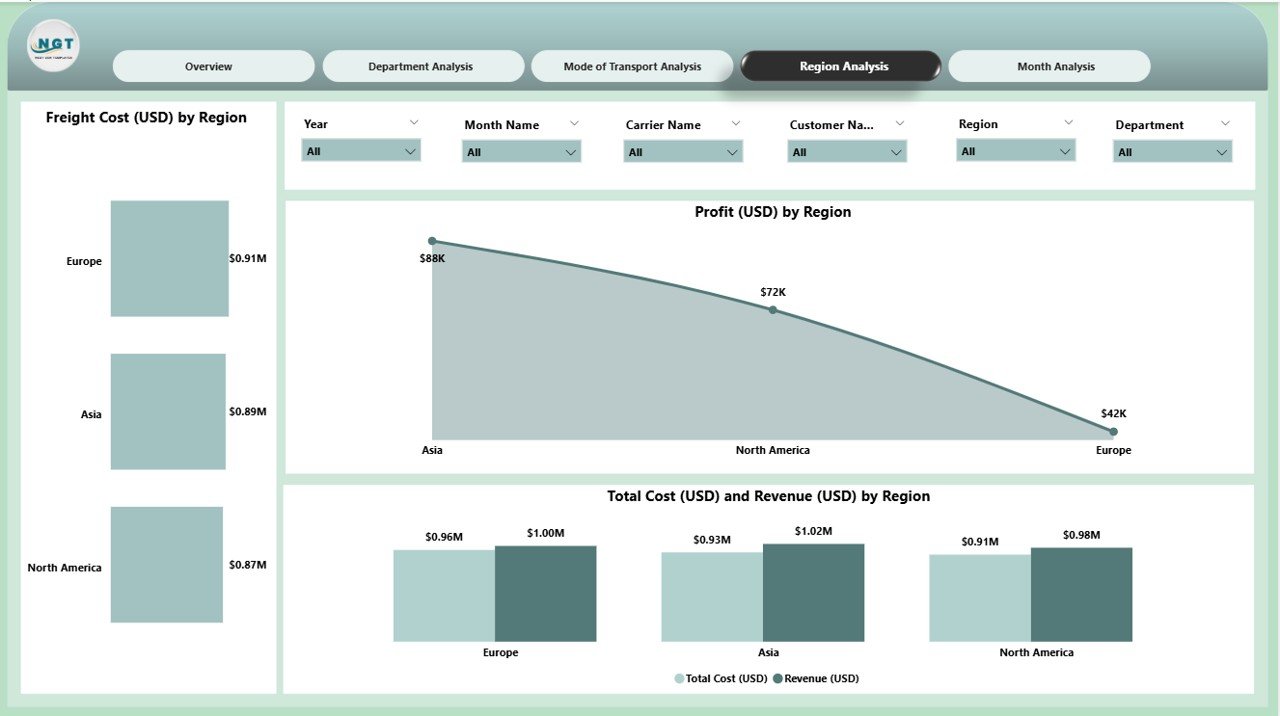
The Region Analysis Page highlights geographic performance variations. Because every region has different demand, carrier networks, and customer expectations, regional insights become extremely important.
This page includes:
-
Freight Cost (USD) by Region
-
Profit (USD) by Region
-
Total Cost (USD) and Revenue (USD) by Region
Users quickly identify high-profit regions, loss-making regions, and potential growth opportunities.
Click to Purchases Shipping Dashboard in Power BI
5️⃣ Monthly Trends Page
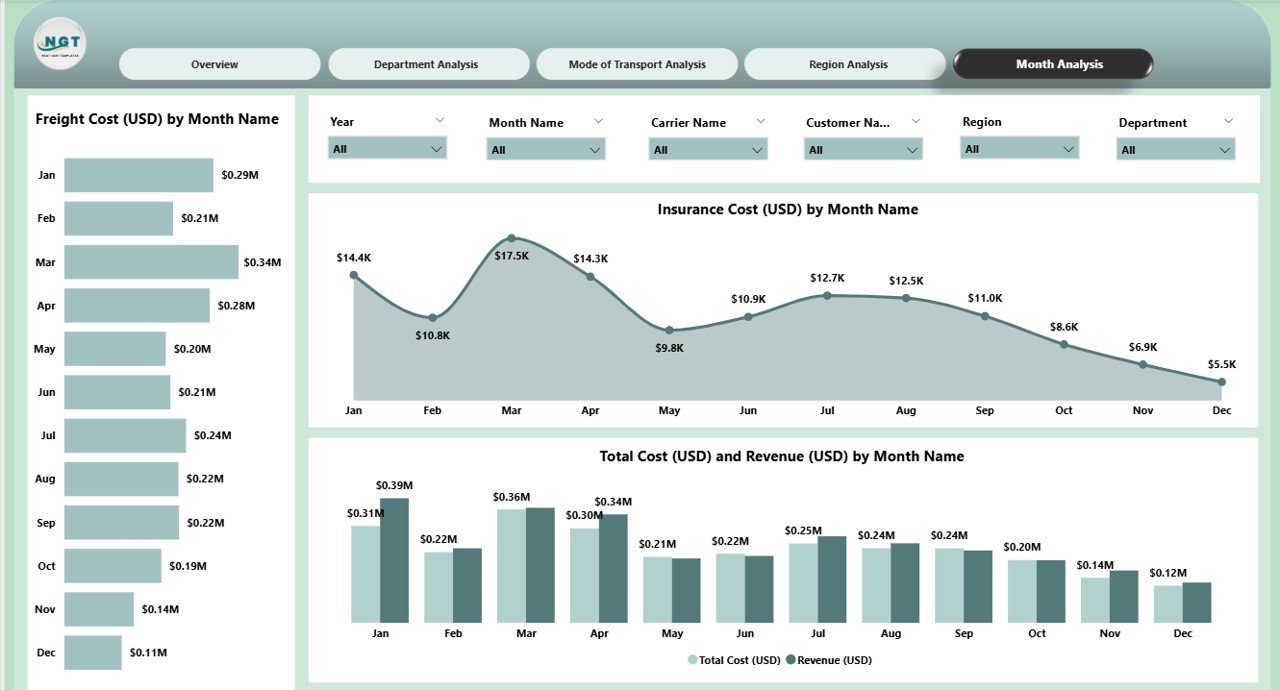
The Monthly Trends Page shows how shipping performance changes over time. Leaders track seasonal patterns, cost fluctuations, and revenue growth.
This page includes:
-
Freight Cost (USD) by Month
-
Insurance Cost (USD) by Month
-
Total Cost (USD) and Revenue (USD) by Month
Teams plan budgets, forecast future shipping costs, and prepare preventive strategies.
Why Do Companies Need a Shipping Dashboard in Power BI?
Shipping operations involve multiple components—carriers, routes, delivery partners, freight contracts, insurance policies, packaging cost, and customer feedback. A Single-Excel report cannot capture all these elements in a structured format.
A Shipping Dashboard in Power BI brings all the data together, connects them, and delivers actionable insights instantly.
Companies need this dashboard because it:
-
Improves visibility across the entire supply chain
-
Helps track cost trends and optimize spending
-
Reduces delays by identifying bottlenecks
-
Enhances customer satisfaction through better delivery insights
-
Supports data-driven decision-making
-
Speeds up reporting and reduces manual work
How Does the Shipping Dashboard in Power BI Help Logistics Teams?
It improves decision-making through:
🔹 Real-time Freight Performance
Freight cost visibility across carriers and shipment modes helps teams choose the best partner.
🔹 Delivery Speed Monitoring
In Transit Shipment % shows delivery delays early.
🔹 Cost and Revenue Comparison
Visual comparisons reveal profit gaps.
🔹 Region-wise Insights
Teams understand customer satisfaction and cost behavior by geography.
🔹 Data-driven Planning
Monthly trends allow better budgeting and forecasting.
-
Vendor negotiations
🌟 Advantages of a Shipping Dashboard in Power BI
A Shipping Dashboard delivers several business advantages:
✔ 1. Better Cost Control
Companies track where money goes and which area consumes more freight cost.
✔ 2. Faster Decisions
Interactive visuals show insights instantly, so leaders respond quickly.
✔ 3. Increased Delivery Efficiency
Teams identify delays early and fix issues before they impact customers.
✔ 4. Higher Customer Satisfaction
Region-wise satisfaction tracking supports improvement planning.
✔ 5. Improved Profitability
Revenue and cost comparisons reveal high-profit and low-profit areas.
✔ 6. Complete Visibility
All shipping data appears in one place, which reduces dependency on multiple reports.
🏆 Best Practices for Using the Shipping Dashboard in Power BI
Follow these best practices to improve accuracy and insights:
🔹 1. Keep Data Clean and Updated
When data stays accurate, dashboard insights stay reliable. Clean your data sheet regularly.
🔹 2. Use Clear Naming Conventions
Use simple and meaningful names for departments, regions, and modes of transport.
🔹 3. Track KPIs Consistently
Define KPI calculations and follow the same logic every month.
🔹 4. Review Monthly Trends
Monthly trend analysis helps forecast upcoming expenses and revenue.
🔹 5. Compare Departments Frequently
Department analysis identifies strengths and weaknesses quickly.
🔹 6. Optimize Transport Modes
Study freight and insurance cost by mode to save money.
🔹 7. Monitor Regional Behavior
Customer satisfaction and cost behavior change from region to region. Review these insights regularly.
🔹 8. Use Slicers for Better Insights
Slicers make analysis more flexible and faster.
Click to Purchases Shipping Dashboard in Power BI
Conclusion
The Shipping Dashboard in Power BI is a powerful tool for logistics teams. It delivers real-time insights, reduces manual reporting efforts, and helps leaders make smarter decisions. Because it covers freight cost, revenue, transport modes, customer satisfaction, and regional insights, companies gain complete visibility into their shipping performance.
When teams use the dashboard consistently, they increase efficiency, reduce cost, and serve customers better. Power BI brings all shipping data into one interactive platform, which makes decision-making easier and faster.
❓ Frequently Asked Questions (FAQs)
1. What is a Shipping Dashboard in Power BI?
It is an interactive reporting solution that tracks freight cost, delivery performance, shipment modes, regions, and customer satisfaction.
2. Who can use this dashboard?
Logistics teams, warehouse managers, supply chain leaders, finance teams, and senior management.
3. Why should companies use this dashboard?
It improves visibility, reduces cost, increases efficiency, and supports better decisions.
4. Can this dashboard track region-wise performance?
Yes, the Region Analysis Page shows cost, profit, and satisfaction by region.
5. Does it help in forecasting?
Yes, the Monthly Trends Page highlights past trends to support future planning.
6. Can small businesses use it?
Yes. Even small logistics teams benefit from real-time insights and improved control.
Visit our YouTube channel to learn step-by-step video tutorials
Click to Purchases Shipping Dashboard in Power BI