Remote work has become a standard operating model for companies around the world. Teams now collaborate from different locations, time zones, and work environments. Because of this shift, organizations need a structured and reliable way to measure productivity, track operational efficiency, and ensure remote employees perform at their best.
A Remote Work KPI Dashboard in Power BI helps teams track the right metrics, understand performance patterns, and improve decision-making. It brings all remote work data into one interactive, real-time dashboard that managers can use daily. Since the dashboard runs on automation and dynamic slicers, leaders stay informed and can guide their teams with more confidence.
In this detailed article, you will explore everything about this dashboard—its structure, features, advantages, best practices, and how organizations can use it to get the most out of their remote workforce.
Click to Purchases Remote Work KPI Dashboard in Power BI
What Is a Remote Work KPI Dashboard in Power BI?
A Remote Work KPI Dashboard in Power BI is an interactive reporting tool designed to monitor productivity, work quality, collaboration, and engagement of remote teams. It collects data from Excel files and transforms it into charts, tables, and KPIs that give real-time insights.
Instead of relying on manual reporting or scattered spreadsheets, this dashboard offers a single, automated source of truth. Managers can measure performance across months, compare progress with targets, and view year-to-date performance without doing calculations manually.
Because the dashboard uses dynamic slicers, conditional formatting, and drill-through features, it becomes a powerful tool for HR teams, project managers, and department heads.
Why Do Businesses Need a Remote Work KPI Dashboard?
Remote work brings flexibility and increased satisfaction. However, it also creates challenges like unclear priorities, difficulty tracking productivity, and lack of visibility.
A remote work KPI dashboard solves these challenges because it:
-
Brings all remote work metrics into a single Power BI report
-
Helps managers track performance with accuracy
-
Reduces time spent preparing weekly or monthly reports
-
Supports data-driven decision-making
-
Makes goal tracking simple and transparent
Since remote work is here to stay, teams need this type of dashboard to maintain performance clarity.
Key Features of the Remote Work KPI Dashboard in Power BI
This dashboard contains three main pages, each designed to give a different type of insight. All data comes from a connected Excel file, making it easy for anyone to update or expand.
Let’s explore each page in detail.
1. Summary Page
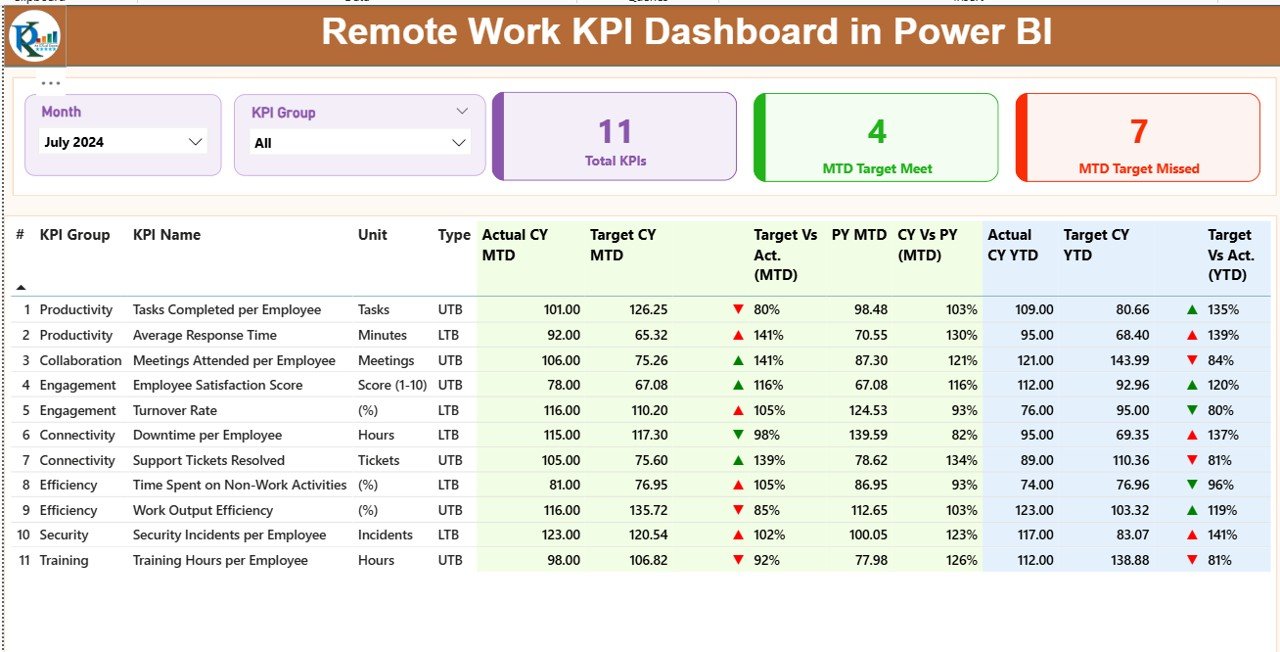
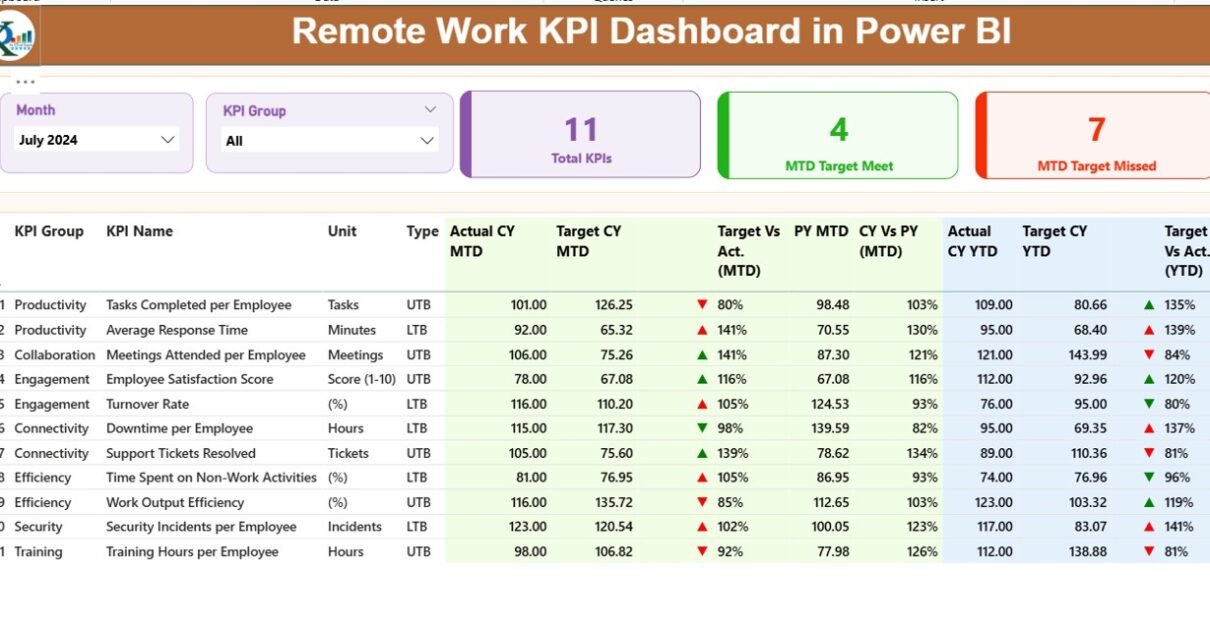
The Summary Page is the heart of the Remote Work KPI Dashboard. It gives a high-level picture of all KPIs across all remote work categories.
Key Elements on This Page:
✔ Month Slicer
Users can select any month from the slicer. As soon as they select a month, the full dashboard refreshes instantly.
✔ KPI Group Slicer
This allows filtering KPIs based on categories such as:
-
Productivity
-
Collaboration
-
Time Management
-
Attendance
-
Quality
-
Customer Support
-
Compliance
✔ Performance Cards
Three performance cards appear on the top:
-
Total KPI Count
-
MTD Target Met
-
MTD Target Missed
These cards help managers understand performance at a glance.
✔ Detailed KPI Table
Below the cards, a detailed table shows all KPI-specific information such as:
-
KPI Number
-
KPI Group
-
KPI Name
-
Unit
-
Type (UTB – Upper the Better, LTB – Lower the Better)
-
Actual CY MTD
-
Target CY MTD
-
MTD Indicator with ▼ ▲ icons (red/green)
-
Target vs Actual % (MTD)
-
Previous Year MTD
-
CY vs PY MTD %
-
Actual CY YTD
-
Target CY YTD
-
YTD Indicator
-
Target vs Actual % (YTD)
-
Previous Year YTD
-
CY vs PY YTD %
Because the table uses conditional formatting, the dashboard highlights performance visually.
Click to Purchases Remote Work KPI Dashboard in Power BI
2. KPI Trend Page
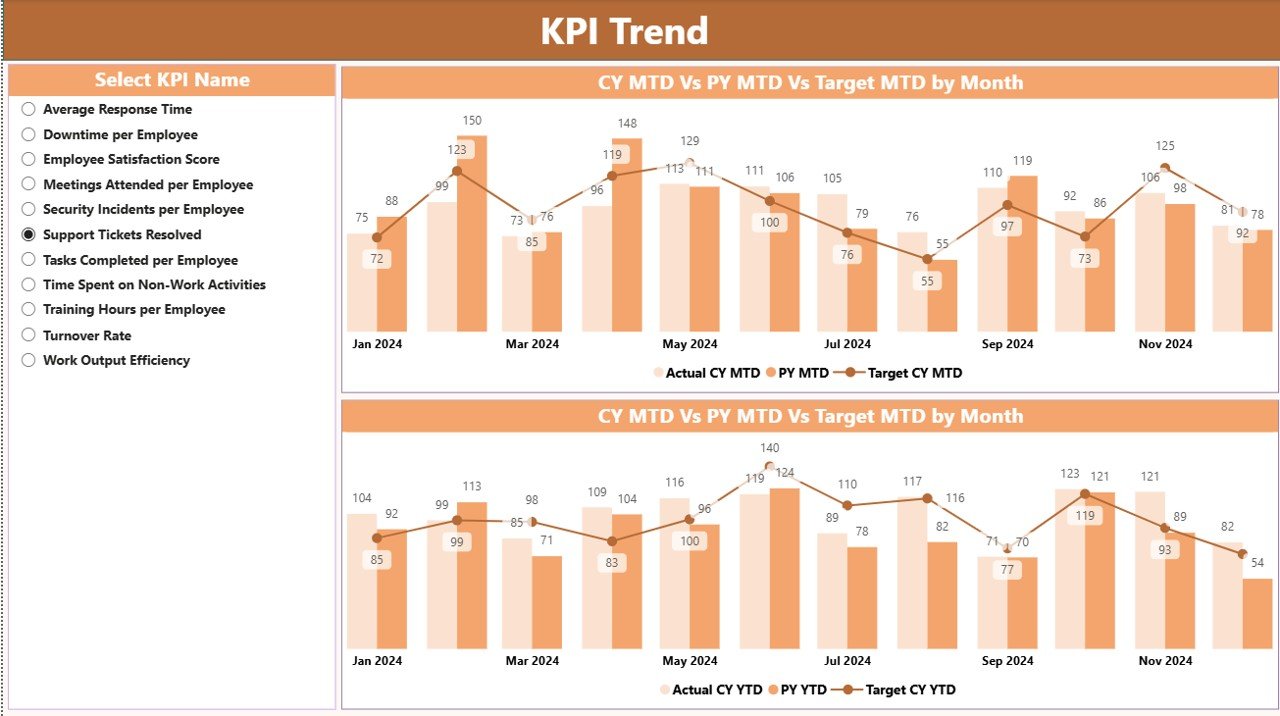
The KPI Trend Page helps organizations study performance patterns over time.
✔ KPI Selection Slicer
Users can select a KPI name from the slicer. Once selected, all trend visuals update automatically.
✔ Two Combo Charts
The page contains two powerful combo charts:
-
MTD Trend Chart
-
YTD Trend Chart
These charts show:
-
Current Year Actual
-
Previous Year Actual
-
Current Year Target
These visuals help managers understand:
-
Whether performance is improving
-
How KPIs move month by month
-
When employees reach or miss targets
This level of visibility becomes important when managing remote teams.
3. KPI Definition Page
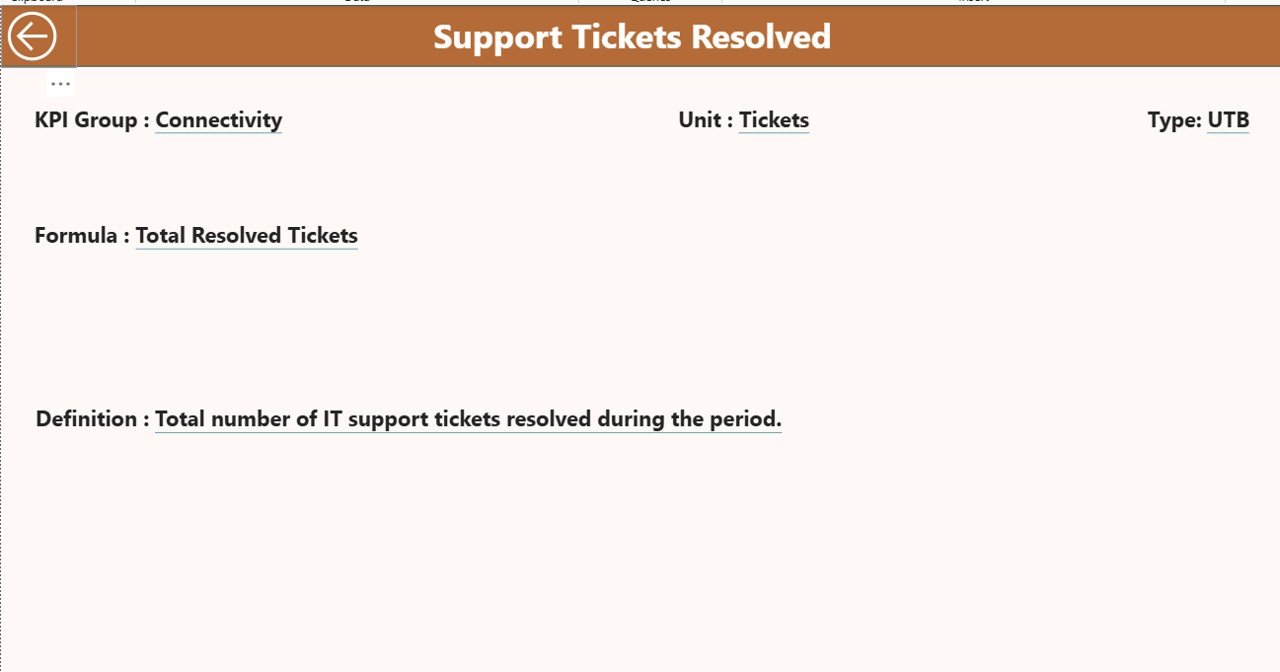
This page is hidden and works as a drill-through page.
✔ What You See on This Page
When users right-click any KPI from the Summary Page and select Drill Through, they see the:
-
KPI Number
-
KPI Group
-
KPI Name
-
Unit
-
Formula
-
KPI Definition
-
Type (LTB/UTB)
This page gives clarity about how KPIs work and how calculations happen.
✔ Back Button
A back button at the top left corner makes navigation easy.
Excel Data Source Structure
The dashboard connects to an Excel file that contains three worksheets:
1. Input_Actual Sheet
This sheet stores the actual performance values for each KPI:
-
KPI Name
-
Month (use the first date of the month)
-
MTD Values
-
YTD Values
Example:
| KPI Name | Month | MTD | YTD |
|---|
2. Input_Target Sheet
This sheet stores all target numbers for each KPI:
-
KPI Name
-
Month
-
MTD Target
-
YTD Target
Because the dashboard uses automated calculations, updating this sheet keeps the dashboard fresh.
3. KPI Definition Sheet
This sheet stores the structural details of each KPI:
-
KPI Number
-
KPI Group
-
KPI Name
-
Unit
-
Formula
-
Definition
-
Type (UTB/LTB)
These definitions help users understand KPI logic.
What KPIs Should You Track in a Remote Work Environment?
A Remote Work KPI Dashboard becomes more powerful when you track meaningful KPIs such as:
Productivity KPIs
-
Tasks completed per week
-
Task accuracy rate
-
Work output quality
Attendance & Time Management
-
Logged-in hours
-
Meeting attendance rate
-
Time taken to finish tasks
Collaboration KPIs
-
Emails responded within SLA
-
Team meeting activity
-
Collaboration tool usage
Customer Service KPIs
-
Customer response time
-
Support tickets closed
-
Customer satisfaction (CSAT)
Employee Engagement
-
Participation in reviews
-
Feedback submission count
-
Skill development hours
With Power BI, you can track all these KPIs with dynamic visuals.
⭐ Advantages of a Remote Work KPI Dashboard in Power BI
A Remote Work KPI Dashboard gives many benefits to organizations, managers, and employees. Let’s explore them.
1. Better Visibility Across Remote Teams
Managers can track performance in real-time. This helps them make decisions faster.
2. Improves Productivity
Since employees know what KPIs matter, they stay aligned with organizational goals.
3. Reduces Manual Reporting
Power BI refreshes data automatically. Teams do not spend time creating monthly reports.
4. Helps Compare Performance
The dashboard shows CY vs PY comparisons. This helps managers see:
-
Improvement trends
-
Declines
-
Seasonal patterns
5. Supports Data-Driven Decision Making
With accurate numbers and trend visuals, organizations make smarter decisions.
6. Enhances Transparency
All employees see clear expectations and performance metrics.
7. Strengthens Accountability
When KPIs show actual vs target performance, accountability improves naturally.
⭐ Best Practices for Using the Remote Work KPI Dashboard
To get the most value from this Power BI dashboard, follow these best practices.
✔ Define KPIs Clearly
Use simple KPIs that employees can understand easily. Avoid complicated formulas.
✔ Update Excel Data Regularly
Updating the Input_Actual and Input_Target sheets consistently keeps your dashboard accurate.
✔ Use Basic and Relevant KPIs Only
Focus on the KPIs that truly measure remote work effectiveness.
✔ Encourage Teams to Review Performance Weekly
Regular reviews help teams improve quickly.
✔ Use the Drill-Through Page for Clarity
The KPI definition page helps employees understand how each KPI works.
✔ Keep Targets Realistic
Set achievable monthly and yearly targets to maintain motivation.
✔ Use Slicers for Better Analysis
Filters help managers understand performance at different levels.
How Does This Dashboard Help Different Departments?
HR Department
Tracks attendance, engagement, and workforce productivity.
Operations Team
Monitors task completion rate, quality, and deadlines.
Customer Service
Uses KPIs like CSAT, ticket closure rates, and SLA.
Project Managers
Track project development, delays, and assign responsibilities.
How to Use the Remote Work KPI Dashboard Effectively
Here is a simple process teams can follow:
Step 1: Select the Month
Use the slicer to choose the month you want to analyze.
Step 2: Review Summary Page
Check all key metrics such as:
-
MTD performance
-
YTD performance
-
KPI trends
-
Target status
Step 3: Go to KPI Trend Page
Study how KPI performance moves across months.
Step 4: Use Drill-Through Option
Understand KPI definitions and formulas.
Step 5: Refresh Dashboard After Updating Excel File
Power BI updates data automatically when the Excel source changes.
Conclusion
Remote work has changed how teams operate. Companies now need strong tools to monitor performance, improve productivity, and maintain collaboration. A Remote Work KPI Dashboard in Power BI gives managers complete visibility across their remote teams. It tracks KPIs, compares performance trends, and highlights areas needing improvement.
With this dashboard, organizations can create a transparent environment where employees know exactly what matters. Because everything runs on automation, teams save time and make smarter decisions. This dashboard is essential for every organization that wants to build a strong, efficient, and high-performing remote workforce.
Frequently Asked Questions (FAQs)
1. What is a Remote Work KPI Dashboard?
It is a Power BI dashboard that tracks remote team performance across productivity, collaboration, time management, and quality KPIs.
2. Why should companies use this dashboard?
Companies use it to get real-time visibility, compare performance trends, reduce reporting time, and improve productivity.
3. How does the dashboard get data?
It connects to an Excel file that stores actual numbers, targets, and KPI definitions.
4. Can I add new KPIs to the dashboard?
Yes. You can add new KPIs easily by updating the Excel definition and data sheets.
5. How often should I update the Excel data?
It is best to update data weekly or monthly for accurate insights.
6. Does this dashboard support drill-through?
Yes. You can drill through to view KPI details, formulas, and definitions.
7. Can this dashboard track team productivity trends?
Yes. The KPI Trend page shows month-wise trends for MTD and YTD performance.
Visit our YouTube channel to learn step-by-step video tutorials