A Hedge Funds KPI Dashboard in Power BI is a ready-to-use, interactive reporting system designed to measure key investment performance indicators across multiple funds. It gives you a clear view of monthly and year-to-date performance, risk exposure, growth metrics, and fund-level analytics.
Because it runs inside Power BI, you do not need additional software. You only need clean data and Power BI Desktop or Power BI Service. The dashboard connects with Excel sheets or databases and provides dynamic reports with slicers, charts, KPIs, and drill-through features.
This dashboard includes everything that a hedge fund team needs to track performance and take quick action—performance scorecards, trend charts, risk insights, target comparisons, and performance improvement indicators.
Click to Purchases Hedge Funds KPI Dashboard in Power BI
Why Do Hedge Funds Need a KPI Dashboard in Power BI?
Hedge funds run with high pressure and strict deadlines. Investors expect transparency, regulators want reliable data, and fund managers need accurate performance numbers. A KPI dashboard solves all these challenges.
With this dashboard, hedge funds can:
-
Track real-time fund performance
-
Monitor risks and volatility levels
-
Compare current performance with targets
-
Analyze historical trends
-
Improve reporting accuracy
-
Share insights across departments
-
Maintain transparency with clients
The dashboard brings the entire investment story together in one place.
Click to Purchases Hedge Funds KPI Dashboard in Power BI
Key Features of the Hedge Funds KPI Dashboard in Power BI
This Hedge Funds KPI Dashboard contains three powerful pages, each designed for fast decision-making and deep analysis.
1. Summary Page – Your Main Control Center

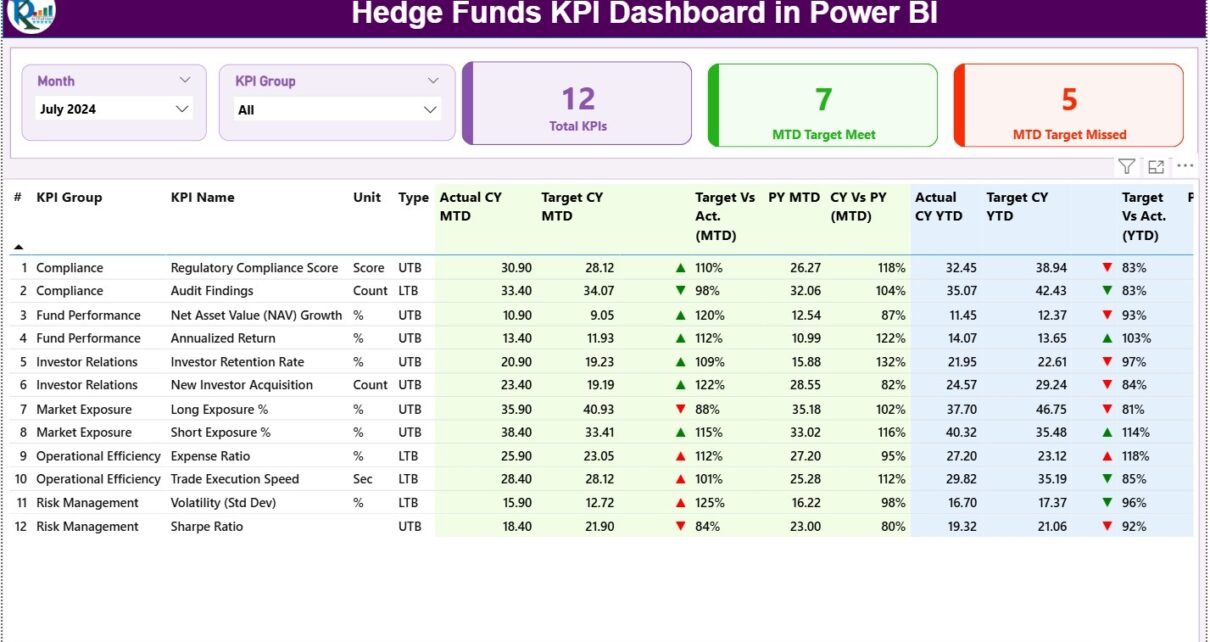
The Summary Page works as the main page of the dashboard. Here you get a complete snapshot of all hedge fund KPIs in one simple screen. This page includes slicers, cards, status indicators, and a detailed KPI table.
✔ Month Slicer
You can select any month to view performance for that specific period.
✔ KPI Group Slicer
You can filter KPIs by category such as:
-
Profitability KPIs
-
Risk KPIs
-
Liquidity KPIs
-
Operational Efficiency KPIs
-
Client & Strategy KPIs
These slicers allow you to switch between KPI groups quickly.
✔ Power BI Cards Display the Most Important Numbers
The dashboard shows three powerful KPI cards on the top:
-
Total KPIs Count
-
MTD Target Met Count
-
MTD Target Missed Count
These cards show a quick summary of overall performance for the selected month.
✔ Detailed KPI Performance Table
The detailed table displays all KPI-level information. It includes:
-
KPI Number – The unique sequence number
-
KPI Group – Performance, Risk, Liquidity, AUM Growth, etc.
-
KPI Name – The exact metric name
-
Unit – Percentage, USD, Ratio, Days, etc.
-
Type – UTB (Upper the Better) or LTB (Lower the Better)
Below this basic information, the dashboard shows complete performance evaluation.
✔ MTD (Month-to-Date) Performance
The table shows:
-
Actual CY MTD – Current year MTD actual value
-
Target CY MTD – Target value for the same period
-
MTD Icon – ▲ or ▼ icons in green or red
-
Target vs Actual (MTD) – Percentage using
Actual MTD / Target MTD -
PY MTD – Previous year MTD value
-
CY vs PY (MTD) – Growth comparison using
CY MTD / PY MTD
These values help you understand how each KPI performs compared to targets and previous year data.
✔ YTD (Year-to-Date) Performance
The dashboard shows:
-
Actual CY YTD
-
Target CY YTD
-
YTD Icon (▲/▼)
-
Target vs Actual (YTD) using
Actual YTD / Target YTD -
PY YTD
-
CY vs PY (YTD)
This helps you track long-term performance trends.
Click to Purchases Hedge Funds KPI Dashboard in Power BI
2. KPI Trend Page – Understand the Full Performance Journey

The KPI Trend page allows you to understand how performance changes over time. This page contains two combo charts:
✔ MTD Trend Chart
Shows:
-
Current Year MTD
-
Previous Year MTD
-
MTD Targets
This helps you understand short-term monthly performance patterns.
✔ YTD Trend Chart
Shows:
-
Current Year YTD
-
Previous Year YTD
-
YTD Targets
This trend section shows long-term performance direction.
✔ KPI Name Slicer
You can select any KPI from the slicer to view its trend alone.
This helps you isolate metrics such as:
-
AUM Growth (%)
-
Sharpe Ratio
-
Net Return (%)
-
Market Risk Exposure
-
Drawdown %
-
Portfolio Liquidity Levels
-
Client Redemption Ratio
The trend charts help you see if the KPI is improving or declining.
Click to Purchases Hedge Funds KPI Dashboard in Power BI
3. KPI Definition Page – Complete KPI Documentation

This is a drill-through page. It stays hidden but becomes available when you right-click and drill through from the summary page.
Here you can see:
-
KPI Number
-
KPI Group
-
KPI Name
-
Unit
-
Formula
-
Definition
-
Type (UTB / LTB)
This page helps analysts and team members understand the exact KPI meaning and calculation logic.
You can return to the main page by clicking the Back button at the top-left corner.
How the Excel Data Source Works
The entire dashboard uses an Excel file as the source. It contains three worksheets.
1. Input_Actual Sheet
You must enter:
-
KPI Name
-
Month (use the 1st day of the month)
-
Actual MTD value
-
Actual YTD value
This sheet stores the real performance values.
2. Input_Target Sheet
You must enter:
-
KPI Name
-
Month
-
Target MTD value
-
Target YTD value
Targets help you compare if the KPIs are meeting expectations.
3. KPI Definition Sheet
This sheet contains:
-
KPI Number
-
KPI Group
-
KPI Name
-
Unit
-
Formula
-
Definition
-
Type (UTB or LTB)
This sheet works as the master data for the dashboard.
Click to Purchases Hedge Funds KPI Dashboard in Power BI
Advantages of Hedge Funds KPI Dashboard in Power BI
A Hedge Funds KPI Dashboard in Power BI offers many advantages that transform how investment teams work. Below are the most important benefits:
1. You Get Real-Time Visibility of Fund Performance
The dashboard updates in seconds and always provides fresh insights. This helps fund managers take quick decisions based on accurate data.
2. It Reduces Dependence on Manual Reporting
Excel-based reports take hours to build. Power BI automates the entire reporting process.
3. It Improves Investment Transparency
Investors appreciate clear reporting. This dashboard shows everything—returns, risk, volatility, performance, and targets.
4. It Helps You Monitor Risks Faster
Hedge funds face many risks such as:
-
Market volatility
-
Investment concentration
-
Liquidity constraints
-
Strategy failures
The dashboard shows these risks in real time.
5. It Improves Collaboration and Reporting
Power BI dashboards can be shared with:
-
Fund managers
-
Analysts
-
Compliance teams
-
Senior management
Everyone can access the same version of truth.
6. It Supports Data-Driven Decision Making
With real-time charts, trends, and comparisons, decision-making becomes easier and more accurate.
Click to Purchases Hedge Funds KPI Dashboard in Power BI
Best Practices for Using the Hedge Funds KPI Dashboard in Power BI
If you want to get maximum value from this dashboard, follow these best practices:
1. Keep Your Data Clean and Structured
Always enter data correctly in the Excel sheets:
-
Use correct Months
-
Maintain MTD and YTD logic
-
Update KPIs regularly
Clean data ensures accurate results.
2. Maintain a Clear KPI Definition Sheet
Every KPI must have:
-
Clear meaning
-
Proper formula
-
KPI type (UTB/LTB)
-
Correct unit
This ensures the entire team understands the KPIs the same way.
3. Refresh the Dashboard Regularly
Refresh data monthly or weekly so the insights remain accurate.
4. Use Slicers for Deeper Insights
Filters help you drill down into performance across:
-
Funds
-
Strategies
-
Regions
-
Time periods
Slicers unlock deeper insights.
5. Review Trend Charts Before Making Decisions
The trend charts show whether performance is stable, rising, or falling. Use these charts before changing strategies.
6. Compare Current vs Previous Year Regularly
The CY vs PY comparison helps you track fund growth and identify performance fluctuations.
7. Share the Dashboard Across the Investment Team
Give access to analysts, managers, and compliance teams so everyone works with the same numbers.
How This Dashboard Helps You Improve Hedge Fund Performance
The Hedge Funds KPI Dashboard in Power BI helps investment teams in many ways:
-
You can track long-term fund performance.
-
You can monitor risks and reduce unwanted exposure.
-
You can improve fund strategies with real-time insights.
-
You can enhance investor reporting with better visuals.
-
You can understand the impact of market conditions.
-
You can compare performance across multiple KPIs.
With this dashboard, hedge funds become more disciplined and more transparent.
Conclusion
The Hedge Funds KPI Dashboard in Power BI is one of the most powerful reporting tools for investment teams. It helps hedge funds track performance, compare targets, monitor risks, and analyze trends using a clean and interactive interface. Because of its smart slicers, combo charts, KPI cards, and drill-through features, the dashboard makes data easier to understand and more actionable.
With the right data, strong KPI definitions, and regular updates, hedge funds can use this dashboard to build stronger investment strategies and deliver better results for investors.
Frequently Asked Questions (FAQs)
1. What is a Hedge Funds KPI Dashboard in Power BI?
It is an interactive reporting tool that tracks key performance indicators for hedge funds using Power BI charts, tables, slicers, and trend analysis.
2. Why should hedge funds use KPI dashboards?
These dashboards help investment teams track performance, risks, market exposure, fund growth, and strategy effectiveness in a simple and visual way.
3. What KPIs can I track using this dashboard?
You can track KPIs such as:
-
Net Returns (%)
-
Sharpe Ratio
-
AUM Growth
-
Profitability KPIs
-
Liquidity KPIs
-
Risk KPIs
-
Benchmark Comparisons
4. Does the dashboard work with Excel data?
Yes, the dashboard uses three Excel sheets: Actuals, Targets, and KPI Definitions. You only need to keep them updated.
5. Can I customize KPIs in the dashboard?
Yes, you can add or remove KPIs by updating the KPI Definition sheet and refreshing Power BI.
6. Who can use this dashboard?
This dashboard is useful for:
-
Fund managers
-
Investment analysts
-
Compliance professionals
-
Portfolio managers
-
Risk analysts
7. Do I need coding knowledge to use this dashboard?
No, you only need basic Power BI knowledge. The dashboard runs with simple Excel data and power BI visuals.
Click to Purchases Hedge Funds KPI Dashboard in Power BI
Visit our YouTube channel to learn step-by-step video tutorials
Watch the step-by-step video tutorial: