Academic publishing requires accuracy, speed, and visibility. Editors, researchers, reviewers, and publication managers handle large volumes of data every month. They track manuscript submissions, review timelines, acceptance ratios, proofreading quality, publication delays, and journal performance. Because the process involves many steps and teams, manual reporting becomes slow and confusing.
An Academic Publishing KPI Dashboard in Excel offers a simple and smart way to manage all publishing KPIs in one place. Since the dashboard works in Excel, teams can update it easily without technical skills. It gives full control over MTD (Month-to-Date), YTD (Year-to-Date), Targets, Previous Year numbers, and performance trends.
In this detailed guide, you will explore how the dashboard works, its worksheets, key features, advantages, best practices, and important FAQs.
Click to Purchases Academic Publishing KPI Dashboard in Excel
What Is an Academic Publishing KPI Dashboard in Excel?
An Academic Publishing KPI Dashboard in Excel is a ready-to-use template that helps publication teams track key performance indicators for academic journals and research papers. It shows all major metrics such as submission count, acceptance rate, review duration, publication timeline, article processing workload, and overall productivity.
Because the dashboard uses simple dropdowns and automated formulas, you can switch between months, review MTD and YTD numbers, analyze trends, and compare current performance with last year—all with one click.
This dashboard improves decision-making and helps academic publishing teams work with better accuracy and speed.
Complete Structure of the Academic Publishing KPI Dashboard
This Excel dashboard includes 7 worksheets, each designed for a specific purpose:
-
Home Sheet
-
Dashboard Sheet
-
KPI Trend Sheet
-
Actual Numbers Input Sheet
-
Target Sheet
-
Previous Year Numbers Sheet
-
KPI Definition Sheet
Let’s explore each sheet in detail.
1. Home Sheet – Your Navigation Index

The Home Sheet works as the index page. It includes six navigation buttons that help you jump to other sheets instantly. This improves the user experience and makes the dashboard easy to use, especially for beginners.
You can move to the Dashboard, KPI Trend, Actual Input, Target Sheet, Previous Year Sheet, and KPI Definition sheet with one click.
Click to Purchases Academic Publishing KPI Dashboard in Excel
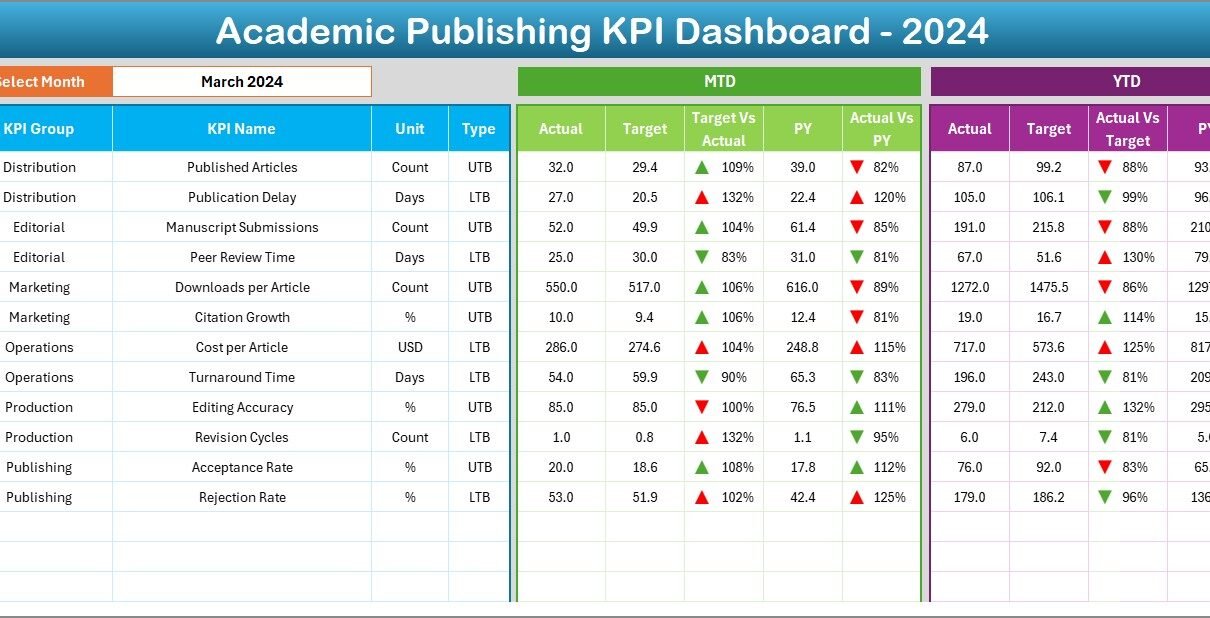
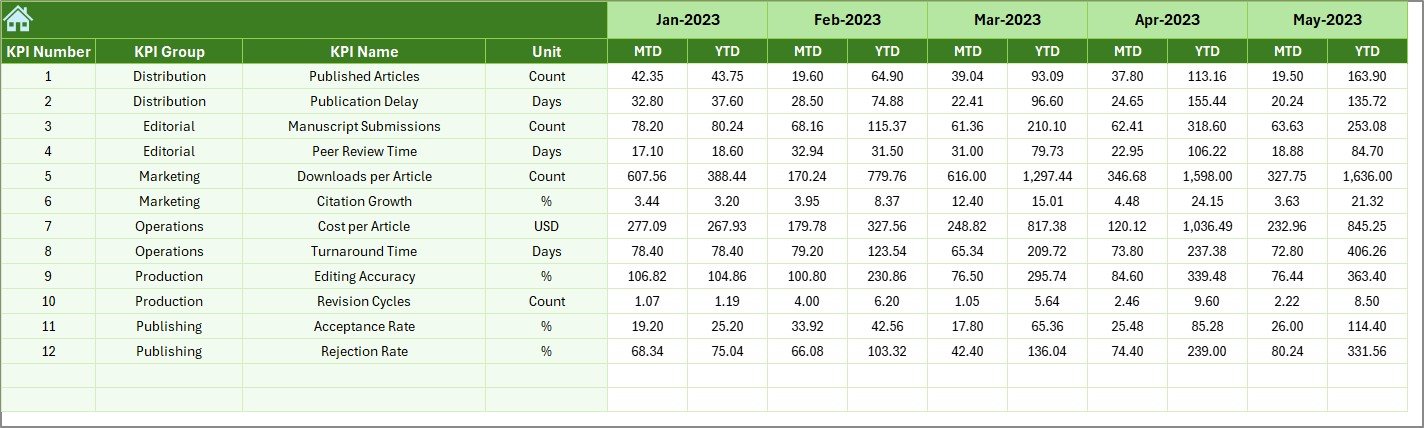
2. Dashboard Sheet – The Main Performance View
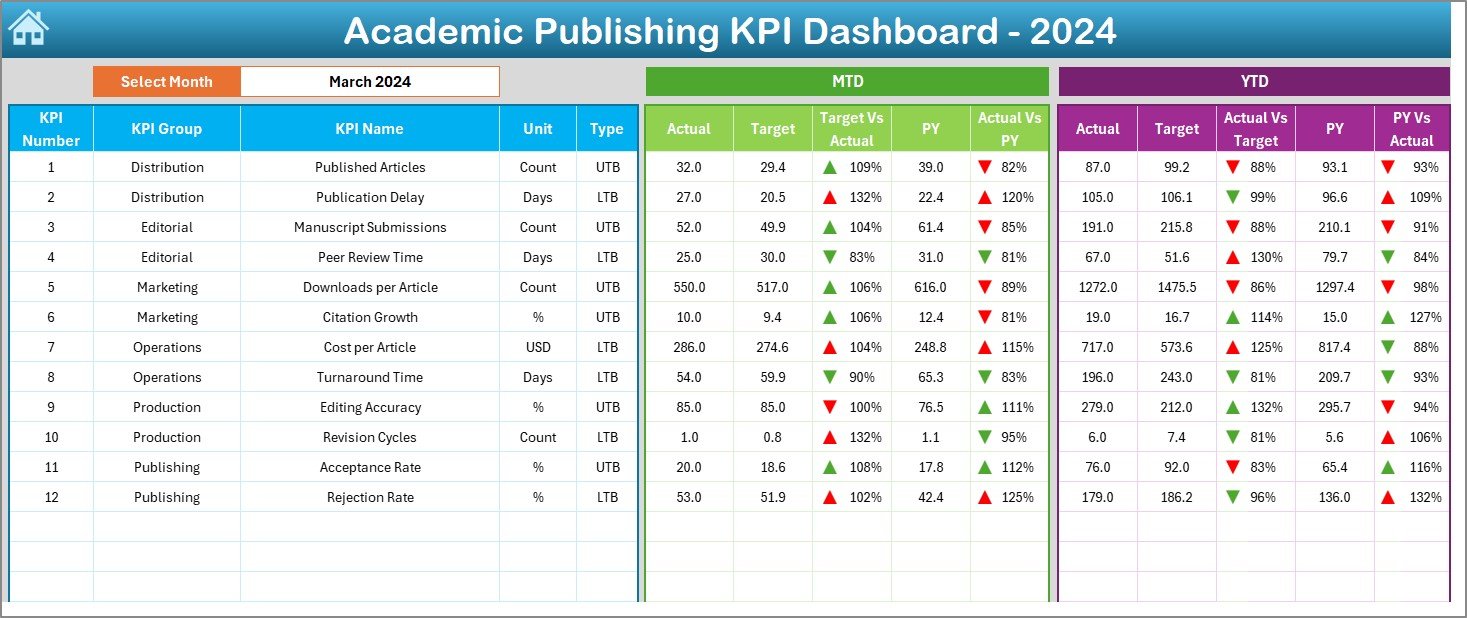
The Dashboard sheet gives you a complete view of all KPIs. You select the Month from the dropdown in cell D3, and the entire dashboard updates automatically.
Here you can see:
✔ MTD Actual, MTD Target, PY MTD
This shows the month-wise numbers for each KPI.
✔ Target vs Actual (MTD)
You also see the comparison with arrows:
-
▲ Green – performance improving
-
▼ Red – performance below target
✔ PY vs CY (MTD)
This comparison shows whether you improved from the previous year.
✔ YTD Actual, YTD Target, PY YTD
This helps you track long-term performance.
✔ Target vs Actual (YTD)
This percentage tells you how close you are to your publishing goals.
Conditional formatting arrows make it easier to interpret performance at a glance.
This sheet becomes the core of your academic publishing performance monitoring.
3. KPI Trend Sheet – Visual Insights and Trends
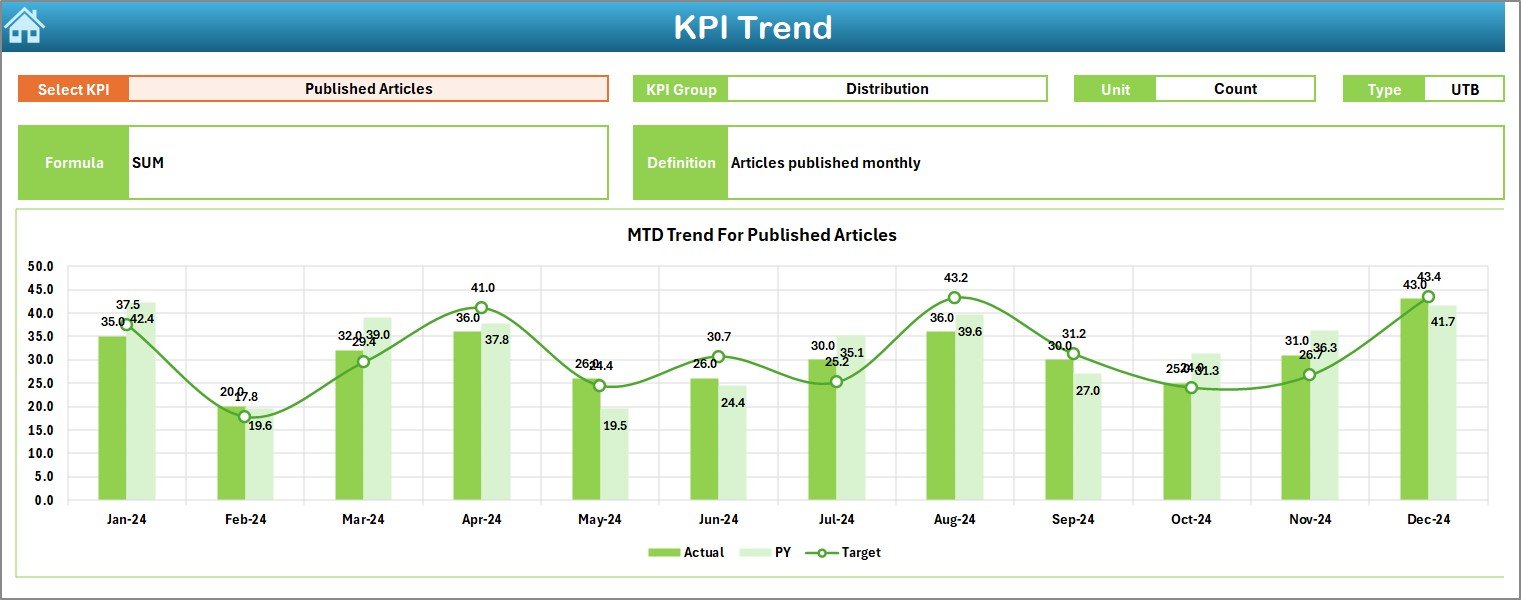
The KPI Trend sheet provides deep analytical insights. You select the KPI Name from the dropdown in cell C3, and the sheet displays:
-
KPI Group
-
Unit
-
KPI Type (Lower the Better or Upper the Better)
-
KPI Formula
-
KPI Definition
You also see two trend charts:
✔ MTD Trend Chart
Shows Actual, Target, and Previous Year performance monthwise.
✔ YTD Trend Chart
Shows cumulative performance throughout the year.
These charts help publication managers:
-
Identify delays
-
Track improvements
-
Study performance fluctuations
-
Review KPI behavior across months
This sheet is extremely helpful during monthly review meetings.
Click to Purchases Academic Publishing KPI Dashboard in Excel
4. Actual Numbers Input Sheet – Enter Actual KPI Values
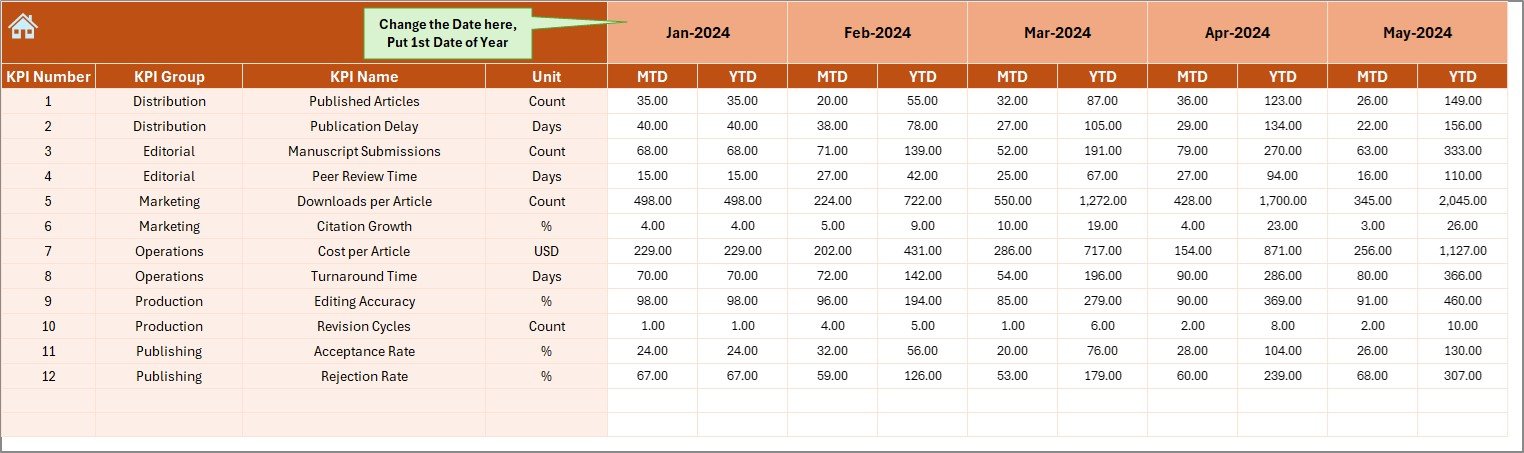
This sheet stores all actual KPI numbers. You enter:
-
MTD values
-
YTD values
-
Month (starting from the date in E1)
You can change the first month of the year by updating cell E1. The dashboard automatically adjusts the whole timeline.
5. Target Sheet – Enter Monthly Target Values
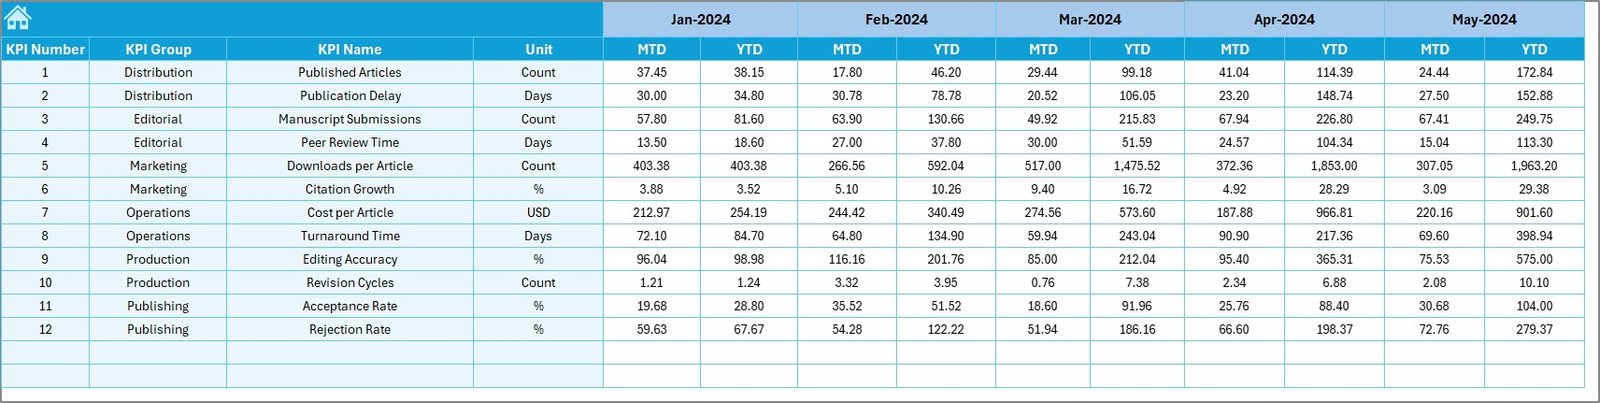
This sheet helps you set publishing targets for each KPI. You enter:
-
Monthly MTD targets
-
Monthly YTD targets
-
KPI Name
-
KPI Group
You can revise targets anytime based on publishing requirements, journal goals, or workload.
6. Previous Year Numbers Sheet – PY Data for Comparison
This sheet stores all previous year MTD and YTD values. It mirrors the format of the Actual Numbers sheet.
This enables:
-
CY vs PY comparison
-
Better understanding of performance
-
Year-on-year growth analysis
This comparison is essential for academic publishing teams who want to evaluate progress over time.
Click to Purchases Academic Publishing KPI Dashboard in Excel
7. KPI Definition Sheet – Details of Each KPI
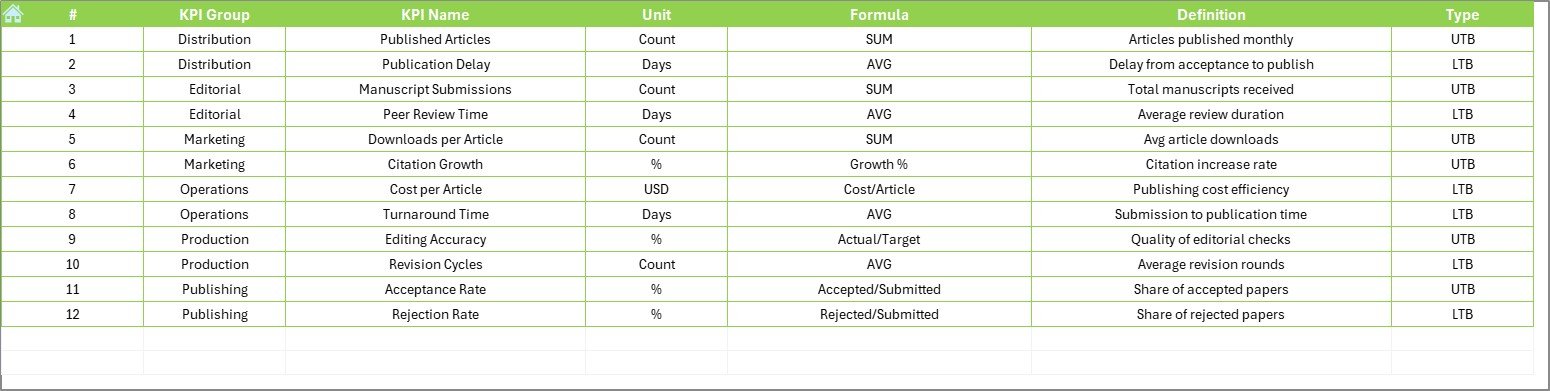
This sheet includes:
-
KPI Name
-
KPI Group
-
Unit
-
Formula
-
KPI Definition
Clear definitions help teams understand how KPIs work, especially new staff, editors, or interns.
You can also add more KPIs anytime without changing the structure of the dashboard.
Why Do Academic Publishing Teams Need a KPI Dashboard?
Academic publishing involves multiple touchpoints:
-
Manuscript submission
-
Peer review
-
Revision cycles
-
Editing
-
Proofreading
-
Acceptance
-
Layout
-
Final Publication
A delay in one step affects the entire publication schedule.
A KPI dashboard helps teams:
-
Monitor every step
-
Track workload
-
Identify bottlenecks
-
Improve review timelines
-
Ensure quality
-
Maintain journal standards
-
Meet publication deadlines
When teams use a centralized dashboard, they align better and make decisions faster.
Click to Purchases Academic Publishing KPI Dashboard in Excel
Advantages of Academic Publishing KPI Dashboard in Excel
This dashboard brings many strong benefits to publishing teams. Here are the key advantages:
1. Complete Visibility
You see all KPIs in one place, which helps you make accurate decisions.
2. Faster Performance Tracking
You can switch between months and compare Actual vs Target instantly.
3. Easy to Update
You enter data in simple Excel tables without technical skills.
4. Year-on-Year Comparison
You always know whether performance improves or drops.
5. Clear Trend Analysis
Charts show patterns that help you understand behavior across months.
6. Supports All Academic Publishing KPIs
You can track:
-
Submission Volume
-
Acceptance Rate
-
Rejection Rate
-
Review Turnaround Time
-
Proofreading Accuracy
-
Publication Delay
-
Editor Workload
-
Citation Growth
7. Smart Use of Conditional Formatting
Up and Down arrows help you interpret KPI status quickly.
8. User-Friendly Navigation
The Home page buttons save time and improve usability.
Click to Purchases Academic Publishing KPI Dashboard in Excel
Best Practices for Using This KPI Dashboard
You can improve your publishing operations by following these best practices:
1. Update Actual and Target Data Monthly
Regular updates keep the dashboard accurate.
2. Use Clean Excel Data
Avoid merged cells or formatting errors. Keep data plain and simple.
3. Maintain Clear KPI Definitions
Short and simple definitions help new users understand KPIs quickly.
4. Review Trend Charts Frequently
Trend charts reveal early warnings or performance gaps.
5. Conduct Monthly KPI Meetings
Use the Dashboard and Trend sheets for monthly review discussions.
6. Refresh Conditional Formatting as Needed
Maintain consistent color codes for better clarity.
7. Add New KPIs as Publishing Processes Grow
The dashboard structure supports easy customization.
Conclusion
The Academic Publishing KPI Dashboard in Excel offers a powerful, user-friendly, and efficient way to track publishing performance. It simplifies review cycles, improves transparency, and helps teams work with clear targets. By monitoring MTD and YTD values, comparing with last year, and analyzing trends, publishing managers gain full control over productivity and quality.
This dashboard is ideal for academic journals, research publishers, editorial teams, and university publications. Since it works in Excel, anyone can use it without training.
A clear and reliable KPI dashboard always improves decision-making—and this template helps your team move toward consistent, high-quality publishing.
Click to Purchases Academic Publishing KPI Dashboard in Excel
Frequently Asked Questions (FAQs)
1. What is an Academic Publishing KPI Dashboard?
It is a reporting tool that tracks the performance of academic publishing activities using measurable KPIs.
2. Does this dashboard work for all types of journals?
Yes, you can customize KPIs for any academic discipline.
3. Do I need Power BI for this dashboard?
No. This dashboard works entirely in Excel.
4. Can I add more KPIs later?
Yes, you can add more KPIs in the KPI Definition sheet anytime.
5. Does the dashboard support trend analysis?
Yes. The KPI Trend sheet shows both MTD and YTD trend charts.
6. Can multiple team members use the dashboard?
Yes. Any user with Excel can update or view it.
7. How often should I update the data?
You should update it every month or every publishing cycle.
8. Does it show Previous Year comparison?
Yes. The dashboard compares both MTD and YTD values with previous year data.
Click to Purchases Academic Publishing KPI Dashboard in Excel
Visit our YouTube channel to learn step-by-step video tutorials