The freight forwarding industry changes faster than ever before. With rising customer expectations, global shipment complexities, and increasing cost pressures, logistics companies need instant visibility into their operations. A Digital Freight Forwarders Dashboard in Excel delivers that visibility in a simple, structured, and powerful way.
This dashboard helps logistics teams monitor cost, revenue, margins, shipment performance, speed of delivery, customer segments, and much more. Because it operates inside Excel, companies enjoy flexibility and a familiar interface without needing expensive software.
In this article, you will learn everything about this dashboard—how it works, why it matters, and how each page supports smarter logistics decision-making. You also get advantages, best practices, and frequently asked questions at the end.
Click to Purchases Digital Freight Forwarders Dashboard in Excel
What Is a Digital Freight Forwarders Dashboard in Excel?
A Digital Freight Forwarders Dashboard in Excel is a ready-to-use analytical template that tracks all important KPIs related to freight forwarding operations. It shows performance across customer segments, shipment modes, service types, and monthly trends.
This dashboard displays:
-
Total cost
-
Revenue
-
Gross margin
-
Freight charges
-
Delivered shipment %
-
Customer behavior
-
Mode-wise shipments
-
Service type analysis
-
Monthly operational patterns
Since Excel allows slicers, charts, formulas, and dynamic visuals, this dashboard works smoothly while staying easy for users at any level.
How the Dashboard Is Structured: All 5 Analytical Pages
This dashboard contains 5 powerful analytical pages, each with a left-side page navigator for smooth navigation. Below is the detailed walkthrough.
1. Overview Page – The Main Dashboard
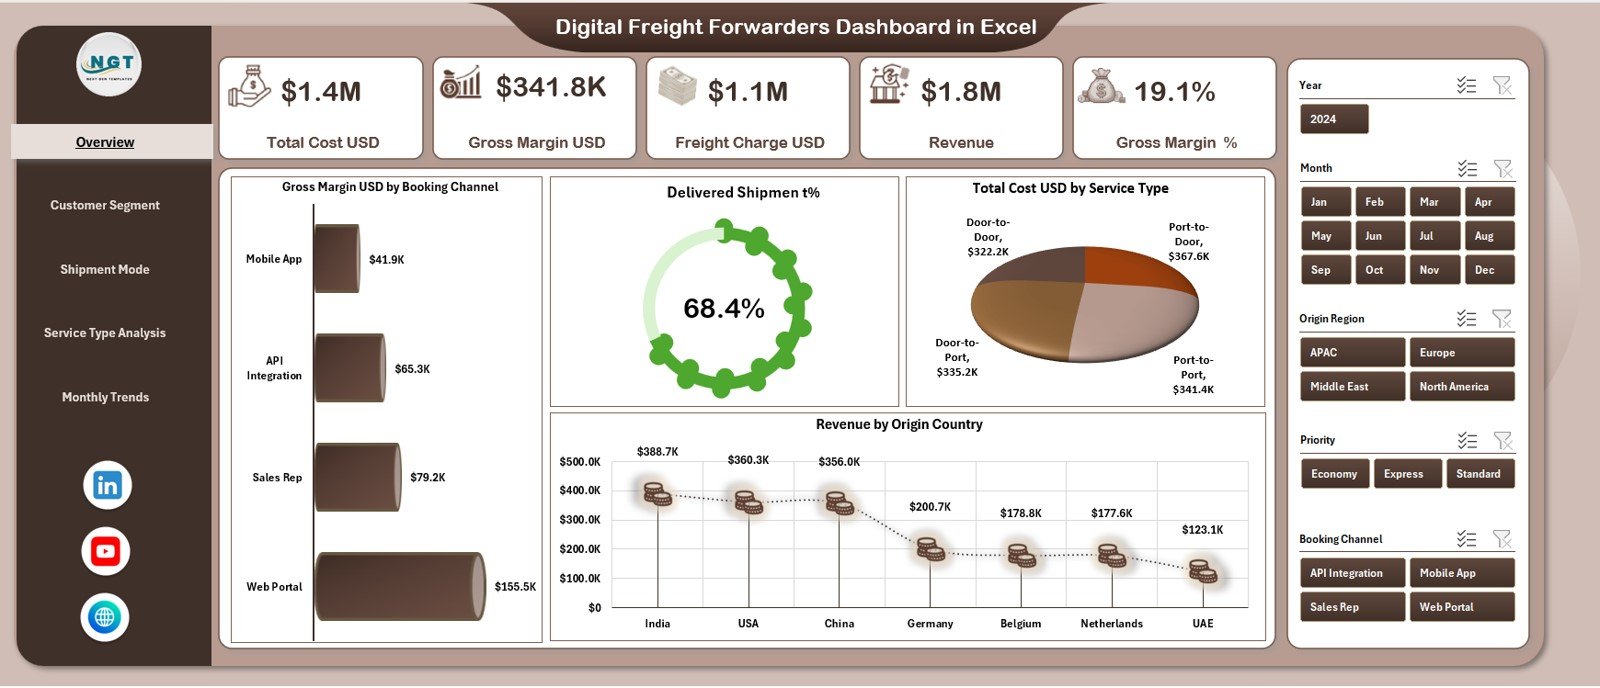
The Overview Page is the heart of the dashboard. This page shows the most critical KPIs that logistics companies track daily.
Five KPI Cards
On the top section, you see five summary cards:
-
Total Cost (USD)
-
Gross Margin (USD)
-
Freight Charge (USD)
-
Revenue (USD)
-
Gross Margin %
These cards help you understand the health of the business instantly.
Four Core Charts
This page also displays four essential charts:
-
Gross Margin USD by Booking Channel
-
Delivered Shipment %
-
Total Cost USD by Service Type
-
Revenue by Origin Country
These visuals show how revenue flows, where costs rise, and how efficiently goods move across regions.
Because these visuals appear together, users gain a complete view of operational and financial performance in seconds.
Click to Purchases Digital Freight Forwarders Dashboard in Excel
2. Customer Segment Analysis – Understand Customer Profitability
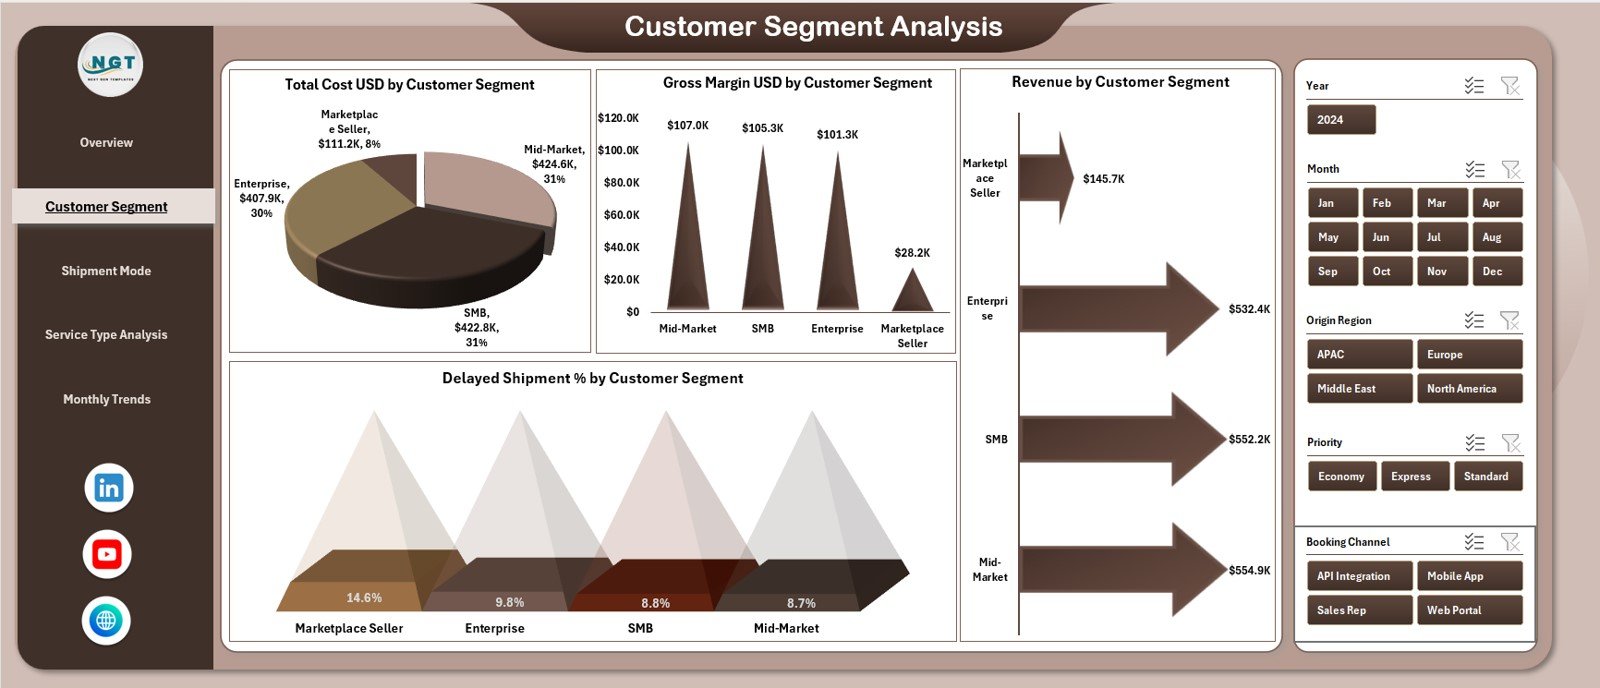
The Customer Segment Analysis page helps freight forwarders understand which customer groups contribute most to profit and where inefficiencies occur.
Four Customer-Focused Charts
This page displays:
-
Total Cost USD by Customer Segment
-
Gross Margin USD by Customer Segment
-
Revenue by Customer Segment
-
Delayed Shipment % by Customer Segment
With these visuals, companies answer important questions:
-
Which customers bring higher revenue?
-
Which customer segments create higher delivery risks?
-
Which groups have higher margin potential?
-
Where should forwarders allocate resources?
When teams understand these patterns, they design better pricing, service levels, and customer communication strategies.
Click to Purchases Digital Freight Forwarders Dashboard in Excel
3. Shipment Mode Analysis – Compare Air, Sea, Road & Rail
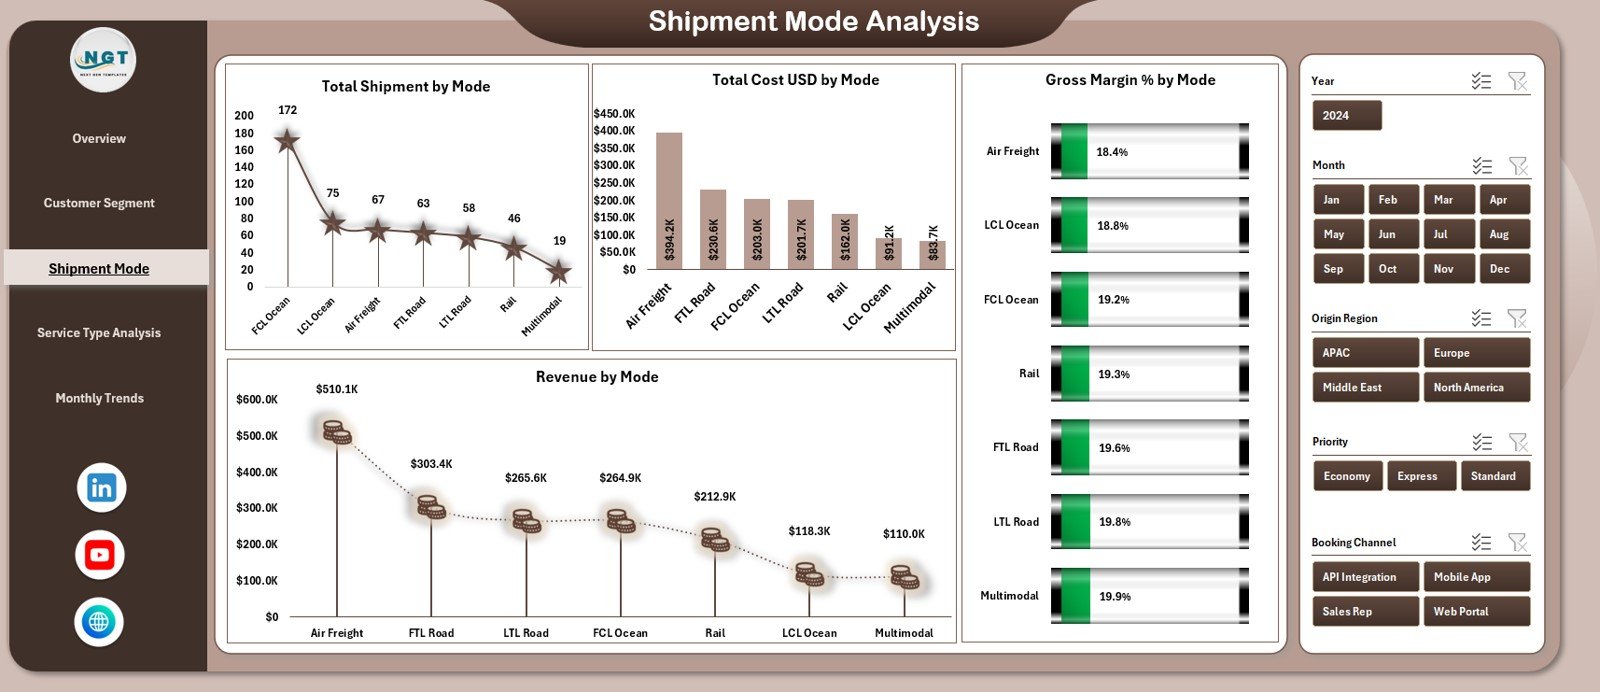
Every freight forwarder works across multiple modes, and each mode has different costs, risks, and delivery times. This page shows comparison across modes clearly.
Charts Included
-
Total Shipments by Mode
-
Total Cost USD by Mode
-
Gross Margin % by Mode
-
Revenue by Mode
These insights help teams understand:
-
Which mode delivers more shipments?
-
Which mode drives higher margins?
-
Which mode has the highest cost?
-
How revenue changes across transport channels?
Mode-level insights help companies optimize scheduling, pricing, and routing strategies.
4. Service Type Analysis – Capture Performance Across Services
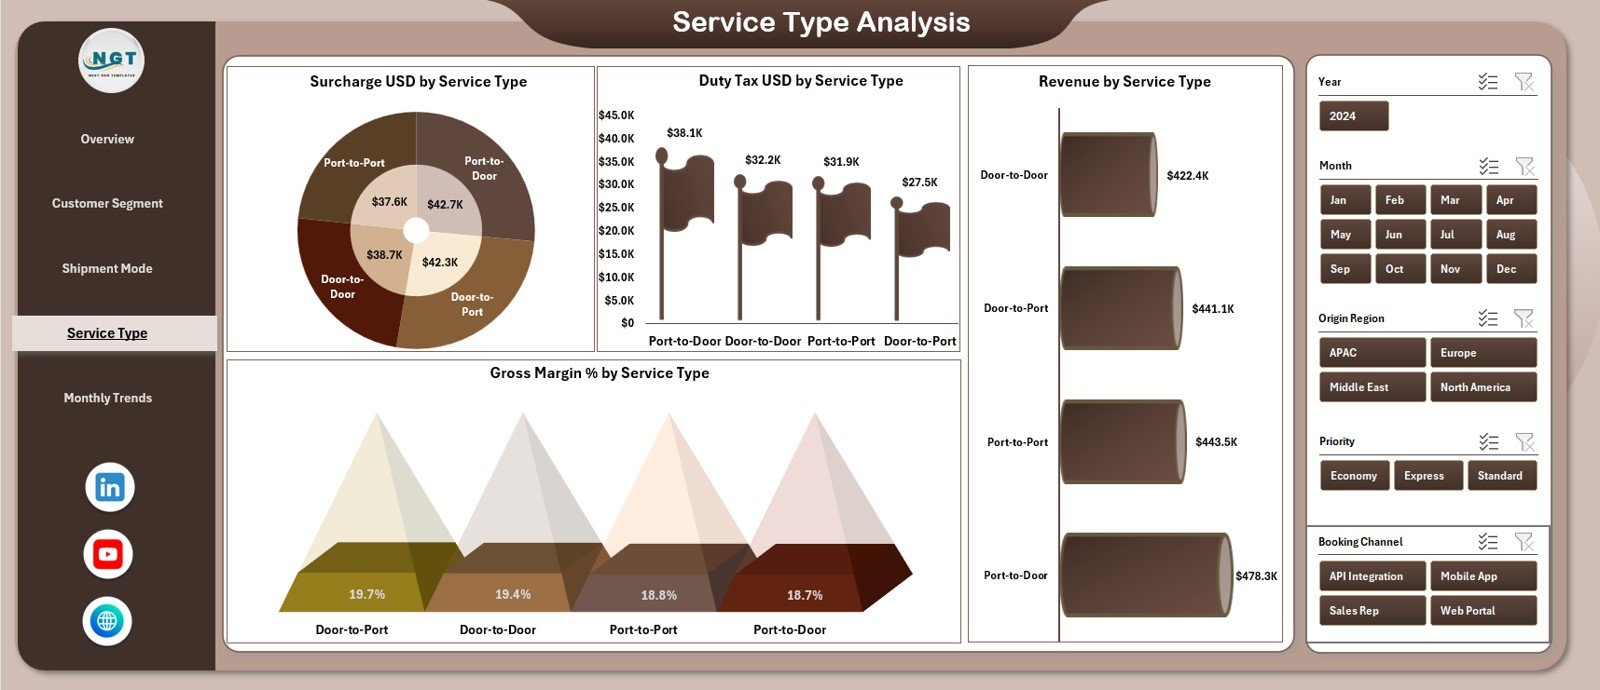
The Service Type Analysis page highlights how different freight services perform. Freight forwarders often offer multiple services—standard, express, customs processing, warehousing, and more. This page helps monitor each service type closely.
Charts Included
-
Surcharge USD by Service Type
-
Duty & Tax USD by Service Type
-
Revenue by Service Type
-
Gross Margin % by Service Type
These insights answer:
-
Which services generate more revenue?
-
Which ones attract more surcharges?
-
How duty and tax amounts vary?
-
Which service types deliver higher margins?
Companies tune their service mix better when they see these patterns clearly.
5. Monthly Trends – View Business Movement Over Time
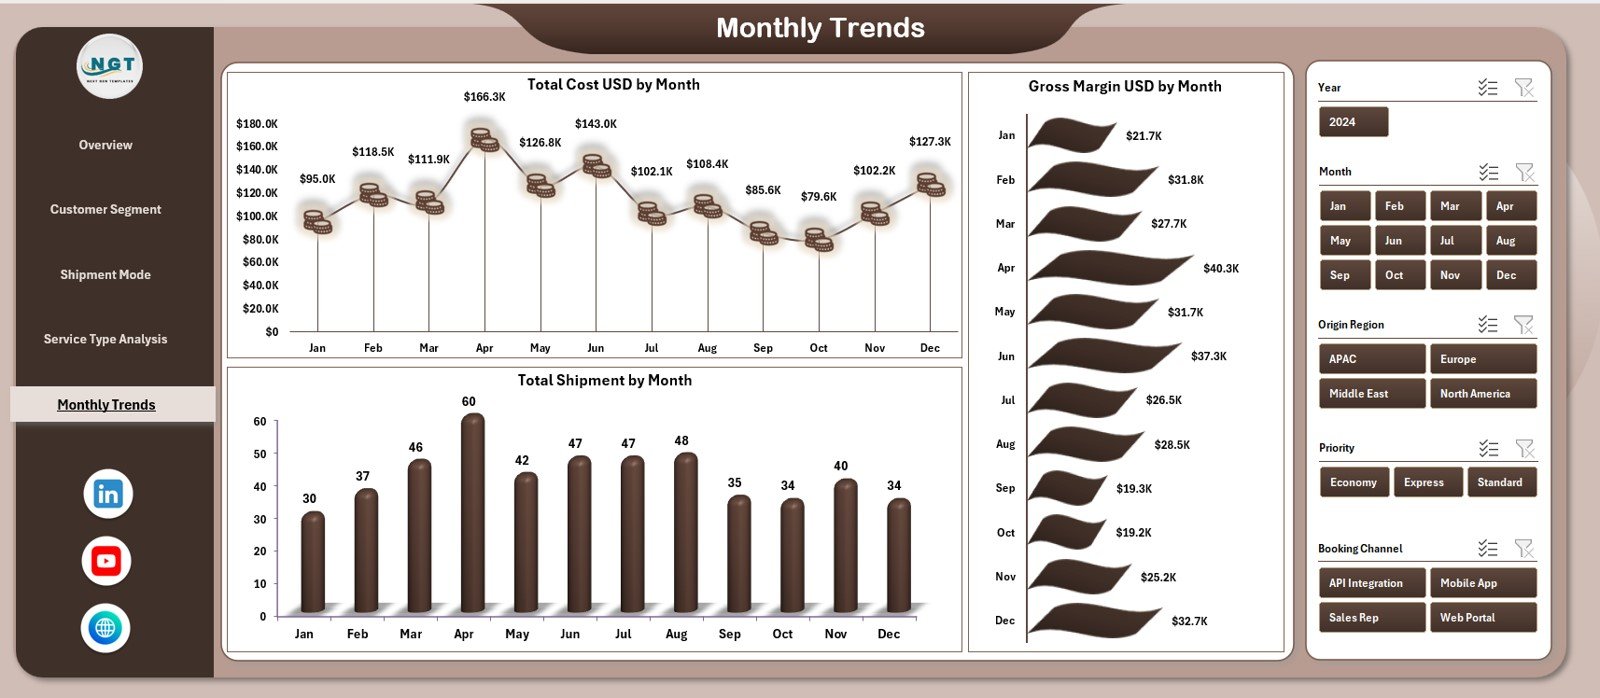
The Monthly Trends Page helps companies understand fluctuations and seasonal patterns in freight activity.
Charts Included
-
Total Cost USD by Month
-
Gross Margin USD by Month
-
Total Shipment by Month
These visuals help teams understand:
-
Which months show higher shipment volumes
-
When costs increase or decrease
-
Whether margins improve throughout the year
-
Seasonal behavior patterns across all segments
Monthly insights support forecasting, budgeting, staffing, and capacity planning.
Support Sheet & Data Sheet – The Backbone of the Dashboard
In addition to the 5-page dashboard, the workbook includes:
-
Support Sheet
-
Data Sheet
These sheets store the core data used to power the dashboard. Users enter or paste raw freight data, and the dashboard transforms it instantly using formulas, pivot tables, and structured references.
Why Digital Freight Forwarders Need a Dashboard
Digital freight forwarding companies deal with:
-
Complex deliveries
-
Multiple transport modes
-
Global routes
-
Unpredictable delays
-
Cost fluctuations
-
Customer demands
-
Margin pressure
-
Performance tracking challenges
A dashboard solves these issues because:
-
It centralizes all important KPIs
-
It tracks costs, revenue, shipments, and delays
-
It shows performance patterns instantly
-
It supports data-driven decisions
-
It reduces manual reporting
-
It provides transparency across teams
A dashboard brings clarity and speed to a very complex industry.
Key KPIs Tracked in Freight Forwarding
Some common KPIs visualized in this dashboard include:
-
Total Shipment Volume
-
Total Cost
-
Freight Charges
-
Revenue
-
Gross Margin
-
Gross Margin %
-
Delivered Shipment %
-
Delayed Shipment %
-
Cost per Shipment
-
Revenue per Shipment
-
Duty & Tax Amount
-
Surcharge Value
-
Customer Segment Profitability
-
Mode-Wise Shipment Efficiency
These KPIs help companies reduce cost, improve delivery speed, and increase reliability.
Click to Purchases Digital Freight Forwarders Dashboard in Excel
Advantages of Digital Freight Forwarders Dashboard in Excel
1. Complete Visibility in One Place
The dashboard clarifies cost, revenue, margin, shipment counts, and delays instantly.
2. Fast Data-Driven Decisions
Teams react quickly when they see sudden cost spikes or delivery issues.
3. Better Customer Insights
Customer-segment charts highlight profitable and risky clients clearly.
4. Deep Mode-Wise Analysis
Companies compare Air vs Sea vs Road vs Rail using clean visuals.
5. Structured Service Type Evaluation
Insights help optimize service offerings and pricing strategies.
6. Clear Monthly Trend Patterns
Teams understand seasonality and plan resources accordingly.
7. Easy to Operate
Excel makes the dashboard simple for all teams without technical training.
8. Lower Operational Cost
Companies avoid expensive BI tools and still get strong analytics.
Best Practices for Using the Dashboard
1. Update Data Regularly
Daily or weekly updates keep the dashboard accurate.
2. Use Clean, Consistent Data
Maintain proper date formats, currency formats, and consistent customer names.
3. Review Trends Monthly
Spot patterns before they become bigger operational issues.
4. Track Segment-Wise Insights
Use customer and service-type breakdowns to guide pricing policies.
5. Study Mode-Wise Patterns
Understand how Air, Sea, Road, and Rail contribute to cost and revenue.
6. Always Compare With Targets
Set margin and revenue targets for every segment to improve performance.
7. Review High-Cost Regions
Analyze origin countries with higher cost patterns.
8. Optimize Delayed Shipments
Investigate customer segments or modes with high delay percentages.
How This Dashboard Helps Improve Freight Forwarding Operations
The dashboard transforms raw freight data into meaningful insight. It helps companies:
-
Reduce operational cost
-
Improve gross margins
-
Improve delivery performance
-
Strengthen customer relationships
-
Identify profitable business areas
-
Reduce delays and risks
-
Allocate resources better
-
Optimize mode and service selection
-
Improve financial visibility
When all teams—from operations to finance to customer success—use the dashboard, the entire freight forwarding process becomes faster and smarter.
Conclusion
A Digital Freight Forwarders Dashboard in Excel offers a complete analytical solution for modern logistics companies. With five detailed pages, clean KPI cards, strong visuals, customer insights, mode analysis, and monthly trends, this dashboard works as a powerful tool to improve cost efficiency, delivery performance, and profitability.
When companies use this dashboard regularly, they unlock better decisions, smoother operations, and stronger financial results. This makes the dashboard essential for any digital freight forwarding business.
Click to Purchases Digital Freight Forwarders Dashboard in Excel
Frequently Asked Questions (FAQs)
1. What does this dashboard track?
It tracks cost, revenue, margin, shipments, customer segments, mode performance, and monthly trends.
2. Who should use this dashboard?
Freight forwarders, logistics managers, pricing teams, operations teams, and customer success teams.
3. Does it require advanced Excel skills?
No. Anyone can use it easily through slicers, charts, and structured entry sheets.
4. Can I customize the KPIs?
Yes. You can add or remove KPIs in the Data Sheet and the visuals update automatically.
5. How often should I update the data?
Weekly or monthly updates give the best results.
6. Does it support customer-segment analysis?
Yes. One full page is dedicated to customer segment insights.
7. What if I want more charts?
You can add more pivot charts or Excel visuals as needed.
8. Does it show margin trends?
Yes. Gross margin USD and gross margin % charts are included across pages.
Click to Purchases Digital Freight Forwarders Dashboard in Excel
Visit our YouTube channel to learn step-by-step video tutorials