Port logistics plays a critical role in global trade and supply chains. Every day, ports handle thousands of containers, vessels, cargo types, shipping lines, and terminals. However, managing cost, revenue, delays, customer satisfaction, and profit across multiple ports becomes extremely challenging when data stays scattered across spreadsheets.
That is exactly where the Port Logistics Dashboard in Excel adds tremendous value.
A Port Logistics Dashboard in Excel transforms raw logistics and shipping data into meaningful, visual, and actionable insights. As a result, port authorities, logistics managers, shipping coordinators, and operations teams can monitor performance, identify bottlenecks, and improve decision-making quickly.
In this detailed guide, you will learn what a Port Logistics Dashboard in Excel is, how it works, which pages it includes, its advantages, best practices, and frequently asked questions. Moreover, you will understand why this dashboard is essential for modern port and maritime logistics operations.
Click to Purchases Port Logistics Dashboard in Excel
What Is a Port Logistics Dashboard in Excel?
A Port Logistics Dashboard in Excel is a ready-to-use analytical template designed to monitor and analyze port-related logistics operations. It converts raw logistics data into clear KPIs, charts, and visual summaries using Excel dashboards.
Instead of reviewing multiple reports, users can track cost, revenue, profit, delays, cargo types, shipping lines, ports, and monthly trends in one structured file. Because it is built in Excel, most teams can use it immediately without special software training.
As a result, port logistics teams gain better visibility, control, and confidence in their daily operations.
Why Do Port Logistics Teams Need an Excel Dashboard?
Ports operate in a high-volume and time-sensitive environment. Even small delays or cost overruns can result in significant financial losses. However, many port operators still rely on static Excel sheets or manual reports.
A Port Logistics Dashboard in Excel solves these challenges because it:
-
Centralizes logistics data in one place
-
Improves visibility across ports and terminals
-
Tracks shipping delays and customer holds
-
Monitors revenue, cost, and profit metrics
-
Analyzes cargo types and shipping lines
-
Supports faster, data-driven decisions
Because Excel dashboards update quickly, teams can review performance daily, weekly, or monthly without extra effort.
Click to Purchases Port Logistics Dashboard in Excel
Key Features of the Port Logistics Dashboard in Excel
This Port Logistics Dashboard in Excel is a ready-to-use Excel desktop template with 5 analytical pages and a structured data setup.
Page Navigator for Easy Navigation
The dashboard includes a Page Navigator on the left side, which allows users to move quickly between pages. This feature improves usability and saves time during reviews.
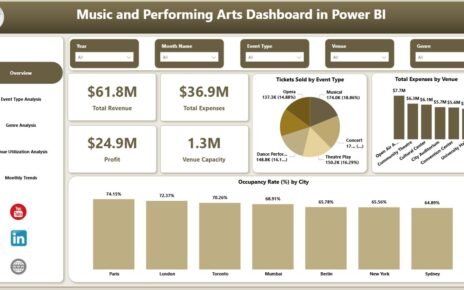
1.The Overview Page

The Overview Page works as the primary snapshot of overall port logistics performance.
Slicers on the Overview Page
On the right side, slicers allow users to filter results by:
-
Date
-
Port
-
Shipping Line
-
Cargo Type
Because of slicers, users can instantly analyze performance based on selected criteria.
KPI Cards on the Overview Page
The Overview Page includes 5 KPI cards that highlight core business metrics:
-
Total Cost USD – Overall operational cost
-
Revenue USD – Total revenue generated
-
Profit USD – Net profit
-
Profit Margin % – Operational efficiency
-
Average Customer Rating – Service quality
These KPIs provide an immediate understanding of business health.
Charts on the Overview Page
The page also includes 3 important charts:
-
Delayed Shipping % – Identifies delay issues
-
Container Count by Terminal – Shows port utilization
-
Revenue USD by Shipping Status – Highlights revenue flow
Together, these visuals help leadership evaluate performance instantly.
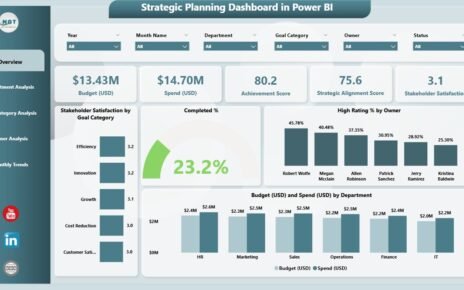
2. Port Analysis Page

The Port Analysis Page focuses on performance comparison across different ports.
Charts on the Port Analysis Page
This page includes 5 detailed charts:
-
Total Cost USD by Port
-
Profit USD by Port
-
Average Customer Rating by Port
-
Customer Hold Shipping % by Port
-
Profit Margin % by Port
Because ports vary in size, location, and workload, this page helps identify high-performing and underperforming ports. As a result, managers can allocate resources more effectively.
Click to Purchases Port Logistics Dashboard in Excel
3.Cargo Type Analysis Page
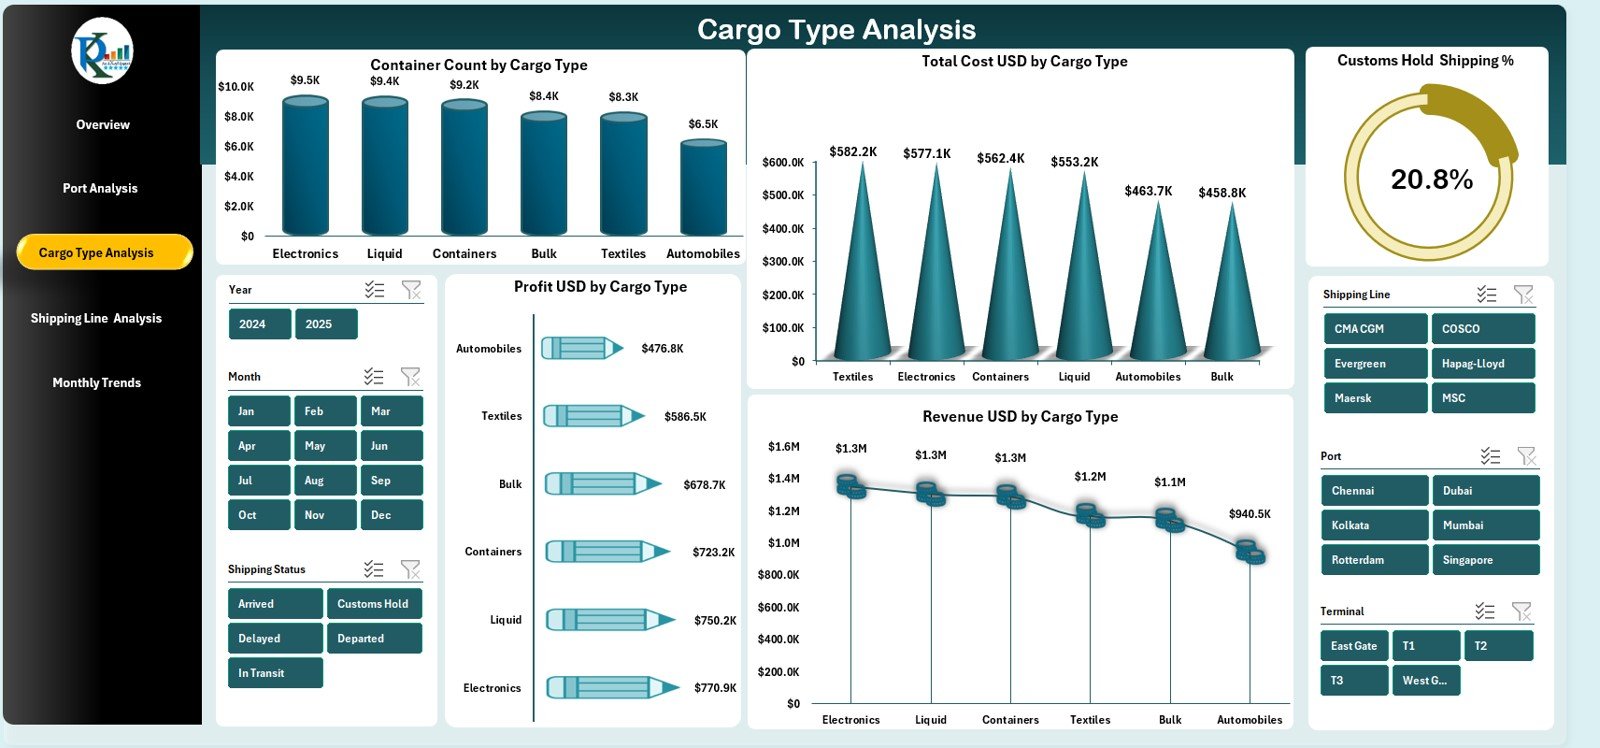
Different cargo types require different handling procedures, storage conditions, and clearance times. Therefore, analyzing performance by cargo type becomes essential.
Cargo Type Analysis Page Insights
The Cargo Type Analysis Page includes 5 analytical charts:
-
Container Count by Cargo Type
-
Total Cost USD by Cargo Type
-
Customs Hold Shipping % by Cargo Type
-
Profit USD by Cargo Type
-
Revenue USD by Cargo Type
This analysis helps logistics teams optimize cargo handling, reduce delays, and improve profitability for specific cargo categories.
4. Shipping Line Analysis Page
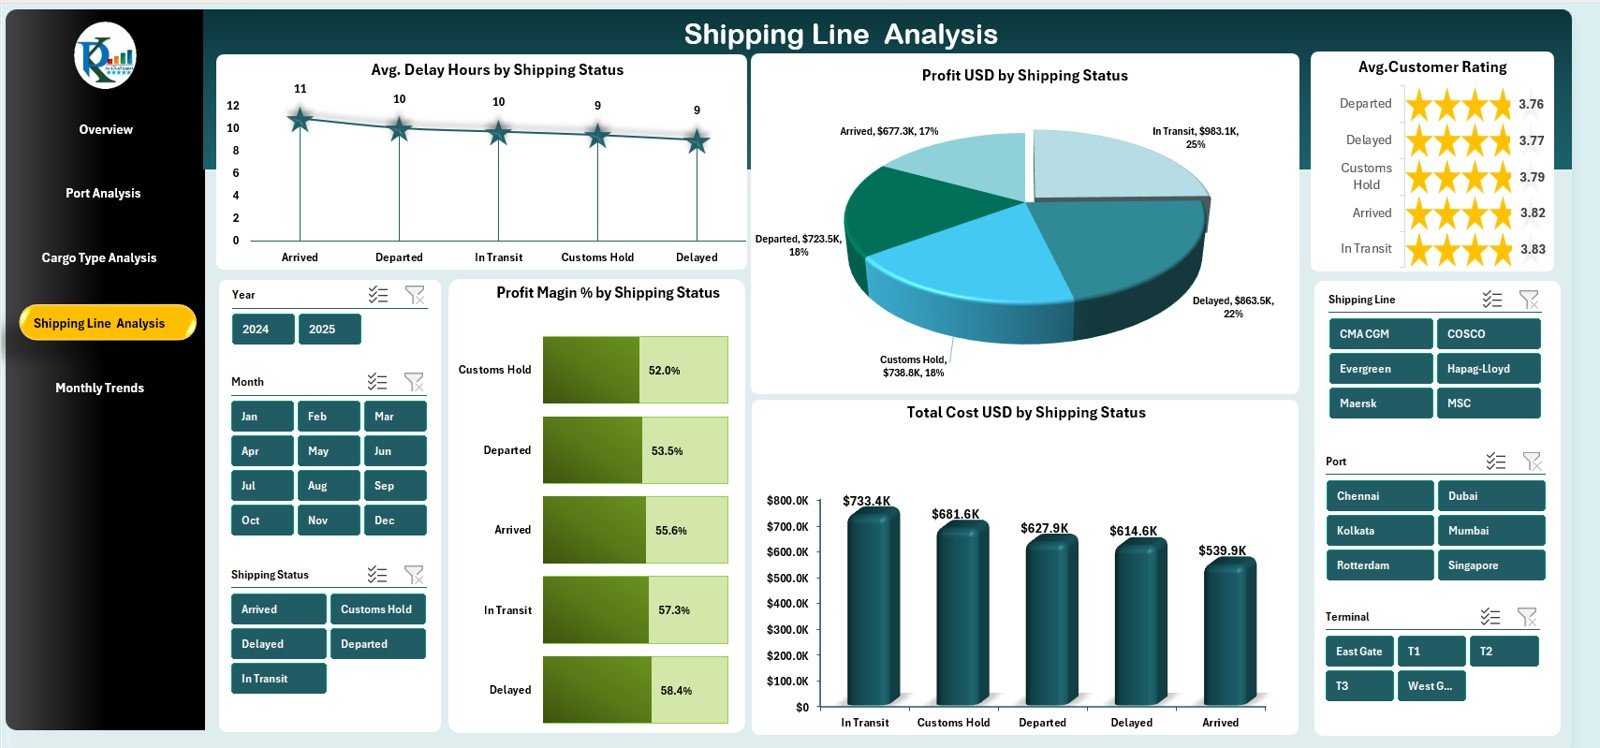
The Shipping Line Analysis Page evaluates operational performance by shipping status and shipping lines.
Charts on the Shipping Line Analysis Page
This page includes 5 powerful charts:
-
Average Delay Hours by Shipping Status
-
Profit USD by Shipping Status
-
Average Customer Rating by Shipping Status
-
Profit Margin % by Shipping Status
-
Total Cost USD by Shipping Status
Using these visuals, managers can identify inefficient shipping processes and improve relationships with shipping partners.
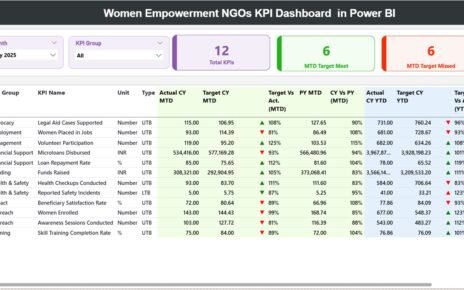
5. Monthly Trends Page
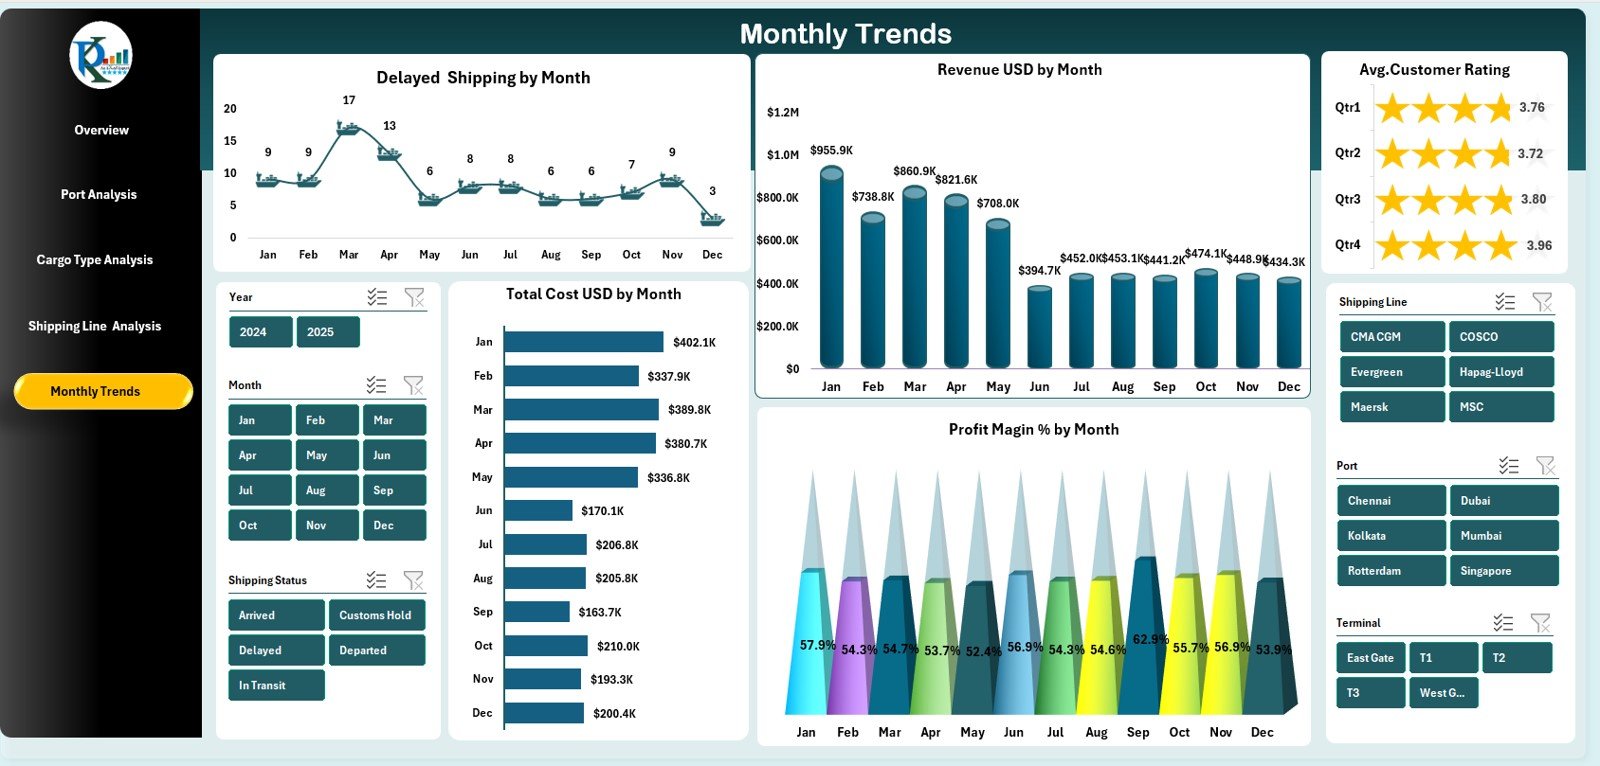
Port performance changes throughout the year due to seasonality, global trade cycles, and operational capacity. Therefore, monthly trend analysis becomes critical.
Monthly Trends Page Insights
The Monthly Trends Page includes 5 trend-based charts:
-
Delayed Shipping % by Month
-
Revenue USD by Month
-
Average Customer Rating by Month
-
Total Cost USD by Month
-
Profit Margin % by Month
This page helps teams forecast demand, plan capacity, and optimize financial performance.
How Does the Support and Data Sheet Work?
Behind the dashboard, the Excel file includes a Data Sheet where raw port logistics data is stored. This structured dataset feeds all charts and KPIs.
Because the dashboard connects directly to the data sheet, any update refreshes the visuals automatically. As a result, users always work with accurate information.
Click to Purchases Port Logistics Dashboard in Excel
Advantages of the Port Logistics Dashboard in Excel
Using a Port Logistics Dashboard in Excel offers multiple advantages.
✅ Centralized Logistics Reporting
All port-related KPIs appear in one dashboard.
✅ Faster Operational Decisions
Teams identify delays and cost issues quickly.
✅ Improved Cost and Profit Control
Profit margins stay visible at all times.
✅ Better Cargo and Port Management
Data-driven insights improve port utilization.
✅ Enhanced Customer Experience
Customer ratings highlight service improvement areas.
✅ No Complex Tools Required
Excel keeps the solution simple and accessible.
Who Should Use This Dashboard?
This dashboard is ideal for:
-
Port authorities
-
Logistics and supply chain managers
-
Shipping coordinators
-
Operations managers
-
Maritime analysts
-
Finance and reporting teams
Because the dashboard is user-friendly, both technical and non-technical users can use it easily.
Click to Purchases Port Logistics Dashboard in Excel
Best Practices for the Port Logistics Dashboard in Excel
To maximize the value of this dashboard, follow these best practices.
🔹 Maintain Clean and Consistent Data
Accurate data ensures reliable insights.
🔹 Monitor Delayed Shipping Regularly
Delays impact cost, customer satisfaction, and revenue.
🔹 Review Cargo Type Performance Monthly
Certain cargo types often drive higher costs.
🔹 Track Customer Ratings Closely
Customer experience reflects service quality.
🔹 Use Monthly Trends for Forecasting
Trend analysis supports smarter planning.
🔹 Share Insights Across Teams
Collaborative decisions improve results.
How Does This Dashboard Support Better Business Decisions?
This Port Logistics Dashboard in Excel enables organizations to:
-
Reduce shipping delays
-
Improve port productivity
-
Control operational costs
-
Increase profit margins
-
Enhance customer satisfaction
-
Support long-term capacity planning
Because insights appear visually, decision-makers act faster and more confidently.
Conclusion
The Port Logistics Dashboard in Excel is a powerful and practical analytics solution for modern port operations. It provides complete visibility across cost, revenue, profit, shipping delays, cargo types, ports, shipping lines, and monthly trends.
By centralizing logistics data into one Excel dashboard, organizations eliminate reporting chaos and improve decision-making speed. In an industry where time and efficiency matter the most, this dashboard becomes a strategic advantage.
Click to Purchases Port Logistics Dashboard in Excel
Frequently Asked Questions (FAQs)
What is a Port Logistics Dashboard in Excel?
A Port Logistics Dashboard in Excel is an interactive Excel-based reporting tool used to monitor port operations, logistics performance, and financial metrics.
Who can use this dashboard?
Port managers, logistics teams, shipping coordinators, and analysts can use it easily.
Does the dashboard track shipping delays?
Yes, it includes delayed shipping percentages and average delay hours.
Can I analyze performance by cargo type and port?
Yes, dedicated pages provide cargo-wise and port-wise analysis.
Is this dashboard customizable?
Yes, users can easily add new KPIs, charts, or filters.
Do I need advanced Excel knowledge?
No, basic Excel knowledge is sufficient.
Click to Purchases Port Logistics Dashboard in Excel
Visit our YouTube channel to learn step-by-step video tutorials