Organizations invest in Learning & Development (L&D) because strong employee skills lead to better productivity, higher engagement, and long-term success. However, many HR and L&D teams still track training activities through scattered Excel sheets, manual reports, or outdated systems. This creates confusion, delays decisions, and hides critical insights.
A Learning & Development Dashboard in Power BI solves this problem. It brings all training data into one clean, interactive, and visual report that helps HR leaders make fast and informed decisions. In this article, you will explore what this dashboard includes, how it works, its key features, advantages, best practices, and answers to the most common questions.
Click to Purchases Learning & Development Dashboard in Power BI
What Is a Learning & Development Dashboard in Power BI?
A Learning & Development Dashboard in Power BI is an interactive reporting solution that tracks key metrics related to employee training, skill development, training cost, trainer performance, delivery methods, and overall learning effectiveness.
The dashboard combines multiple L&D datasets into a single view and displays insights through charts, KPIs, cards, slicers, and trend visuals. Decision-makers can filter data by month, department, region, trainer type, or delivery mode to analyze training performance instantly.
This dashboard removes manual reporting and gives HR teams a strong analytics tool to monitor progress, identify skill gaps, measure training ROI, and enhance learning quality.
Why Do Organizations Need an L&D Dashboard?
Organizations need timely insights to understand whether their training programs create real value. Manual reporting slows down decisions and causes errors. A dashboard in Power BI offers:
-
Clear visibility of employee development programs
-
Real-time analysis of training performance
-
Better planning for training budgets and resources
-
Faster decision-making based on accurate data
-
Insights into the effectiveness of different training types
The dashboard empowers HR teams to move from guesswork to data-driven planning.
Key Features of the Learning & Development Dashboard in Power BI
This dashboard includes five interactive pages, each created to analyze training performance from different angles.
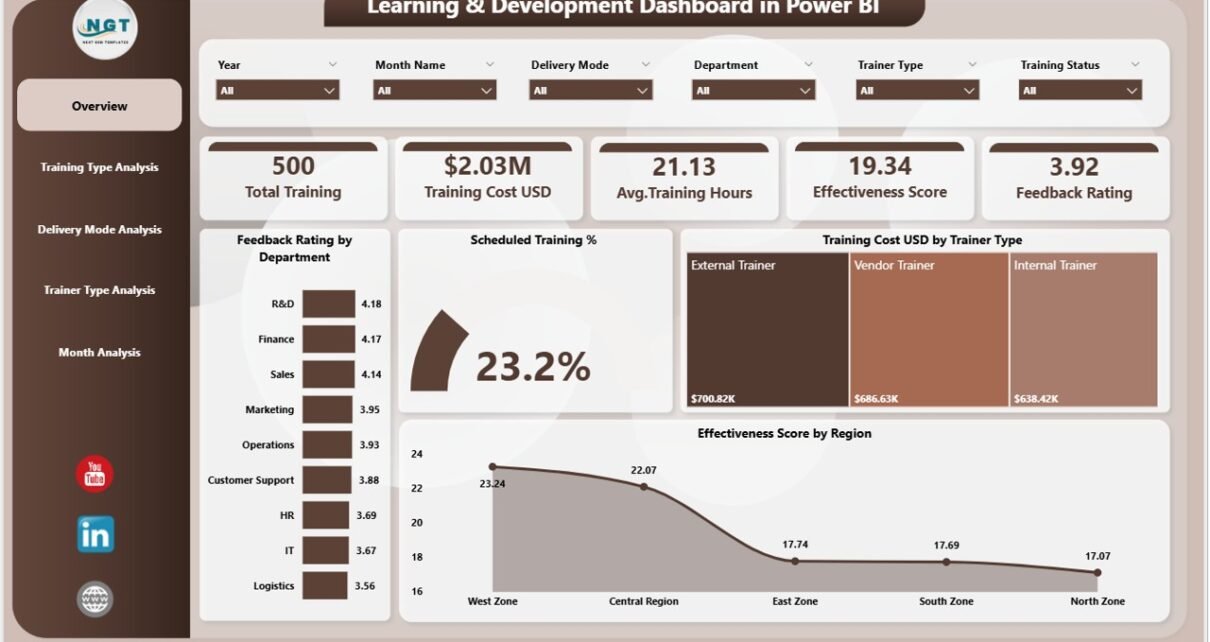
1. Overview Page: What Does It Show and Why Does It Matter?
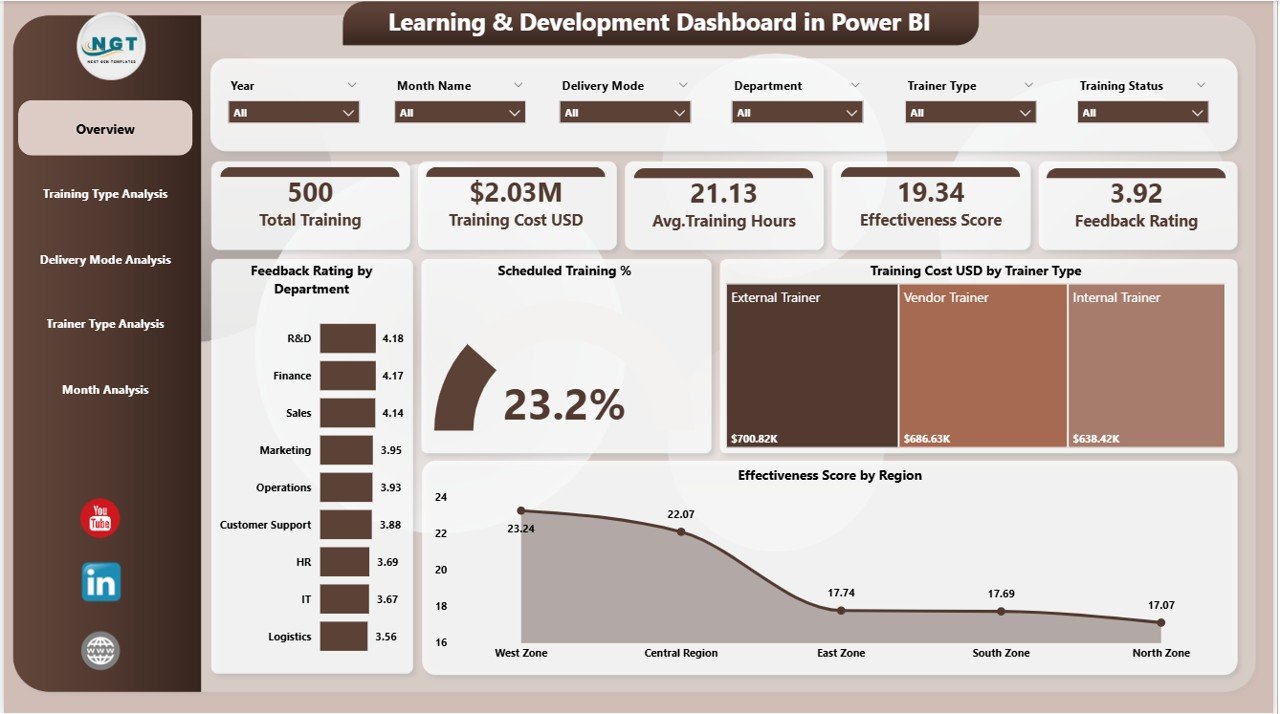
The Overview Page works as the main control center of the dashboard. It provides a high-level summary of the entire learning system.
✔ Slicers
The page includes slicers for Month, Department, Region, Trainer Type, or Training Type. Users can select filters and instantly see updated results across the dashboard.
✔ KPI Cards
The Overview page displays four powerful KPI cards:
-
Total Trainings Conducted
-
Scheduled Training %
-
Average Feedback Rating
-
Overall Effectiveness Score
These cards help HR teams measure immediate performance without opening detailed charts.
✔ Key Charts on This Page
The page includes four major visuals:
-
Feedback Rating by Department
-
Scheduled Training % by Category
-
Training Cost (USD) by Trainer Type
-
Effectiveness Score by Region
These charts show where training performs well and where improvement is needed.
The Overview Page gives leaders a clear snapshot of training success.
2. Training Type Analysis: Why Should You Track It?
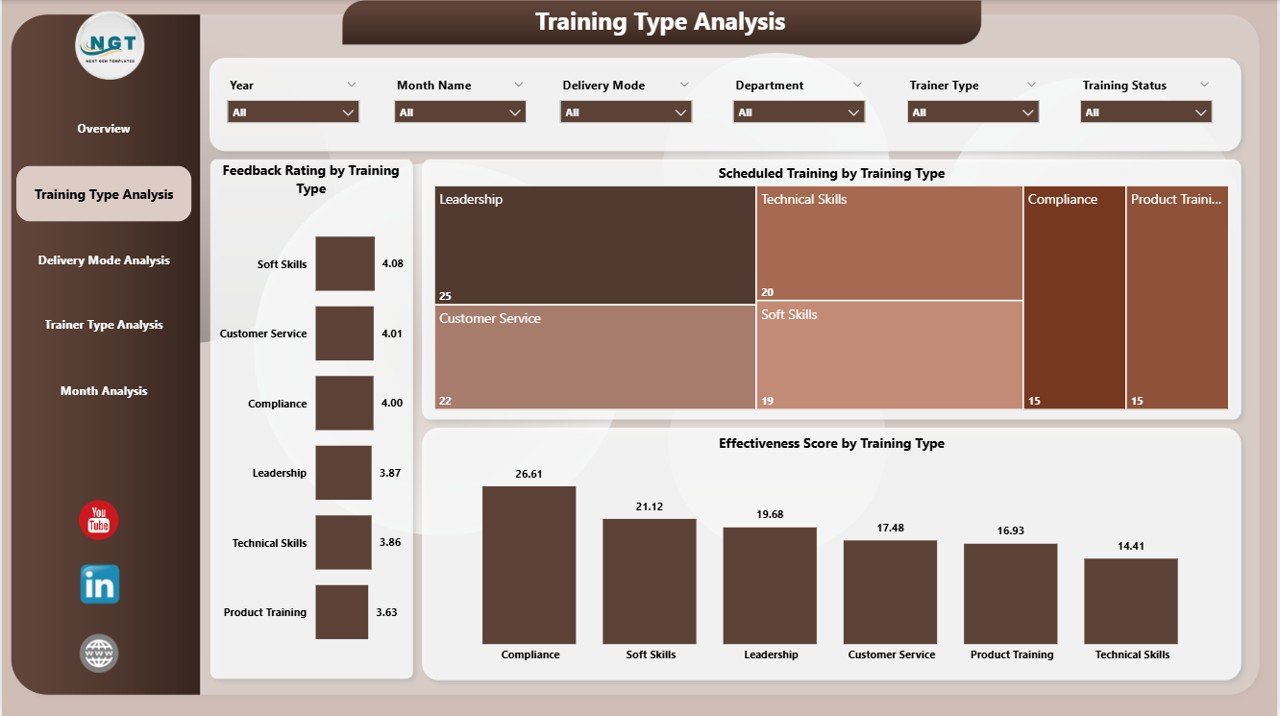
The Training Type Analysis page helps teams understand which training categories deliver maximum value.
✔ Interactive Slicers
You can filter data by month, employee group, trainer type, delivery mode, or region. The dashboard updates seamlessly.
✔ Charts on This Page
This page includes three important charts:
-
Feedback Rating by Training Type
-
Scheduled Training % by Training Type
-
Effectiveness Score by Training Type
These visuals help identify:
-
Which training types employees prefer
-
Which programs run on time
-
Which sessions deliver strong learning outcomes
HR teams can adjust training calendars based on these insights.
Click to Purchases Learning & Development Dashboard in Power BI
3. Delivery Mode Analysis: Which Mode Performs Best?
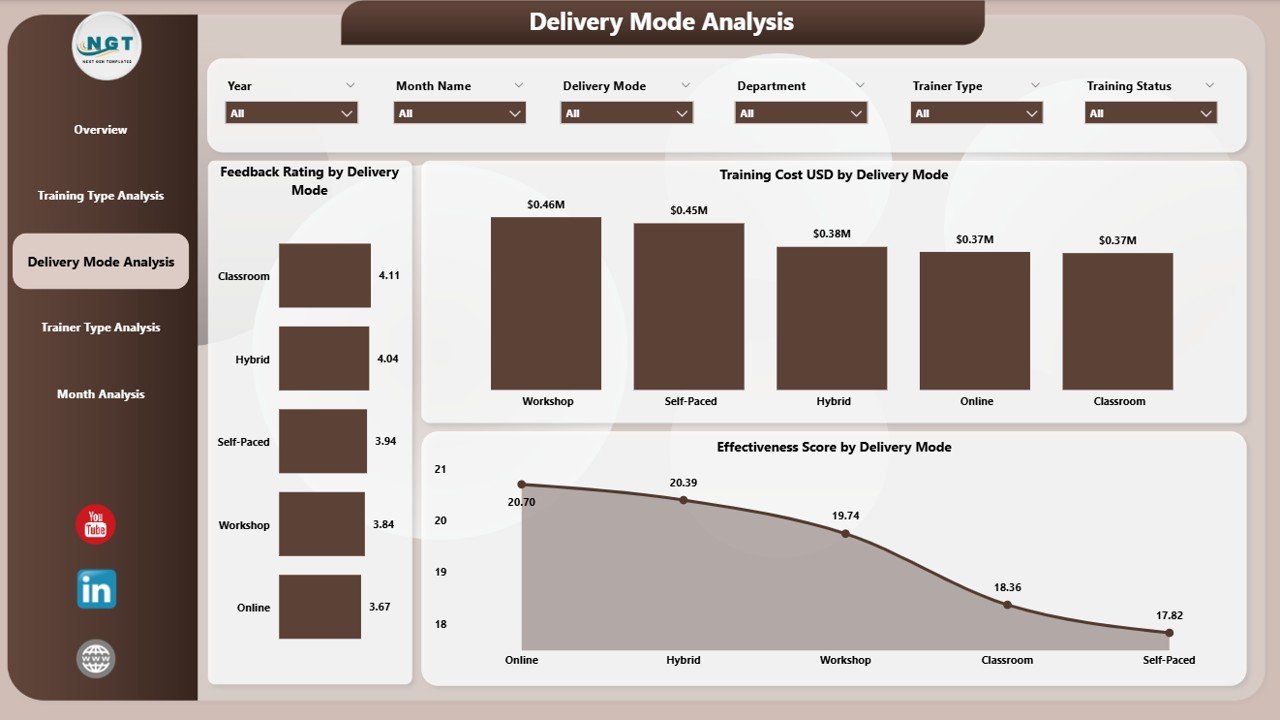
Training does not follow a single format anymore. Companies use classroom sessions, online sessions, hybrid sessions, workshops, and more.
The Delivery Mode Analysis page highlights which modes deliver better results.
✔ Key Charts on This Page
You will see three visual insights:
-
Feedback Rating by Delivery Mode
-
Training Cost (USD) by Delivery Mode
-
Effectiveness Score by Delivery Mode
This helps HR teams compare:
-
Cost of each delivery mode
-
Quality of learning experience
-
Whether face-to-face, virtual, or hybrid methods work better
Clear insights lead to smarter training investments.
4. Trainer Type Analysis: How Do Trainers Influence Performance?
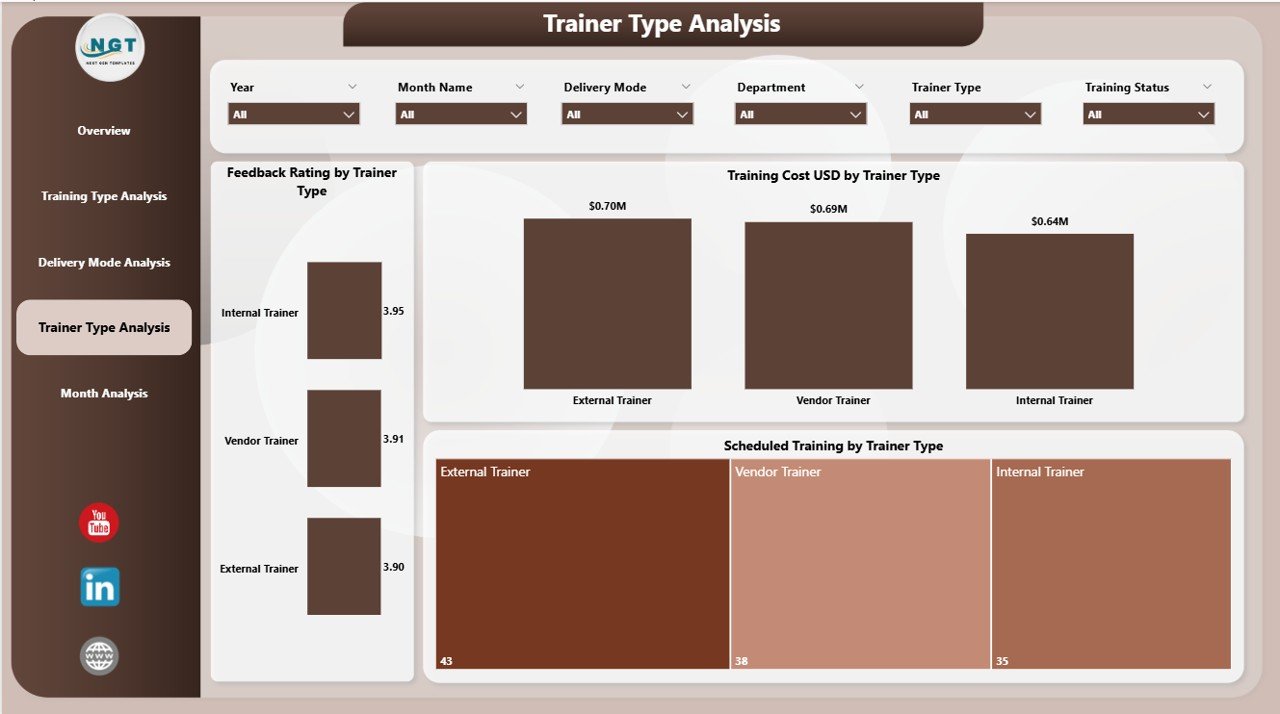
Trainers play a major role in employee learning. Different trainer types include:
-
Internal trainers
-
External consultants
-
Subject Matter Experts (SMEs)
-
Certified coaches
This page helps measure their performance.
✔ Key Charts on This Page
The visuals include:
-
Feedback Rating by Trainer Type
-
Training Cost (USD) by Trainer Type
-
Scheduled Training % by Trainer Type
When HR compares trainer performance, they get clarity on:
-
Which trainers deliver strong outcomes
-
Which trainer type suits each training topic
-
Where the organization should increase or reduce spending
This improves training quality and budget efficiency.
5. Monthly Trends: How Does Training Performance Change Over Time?
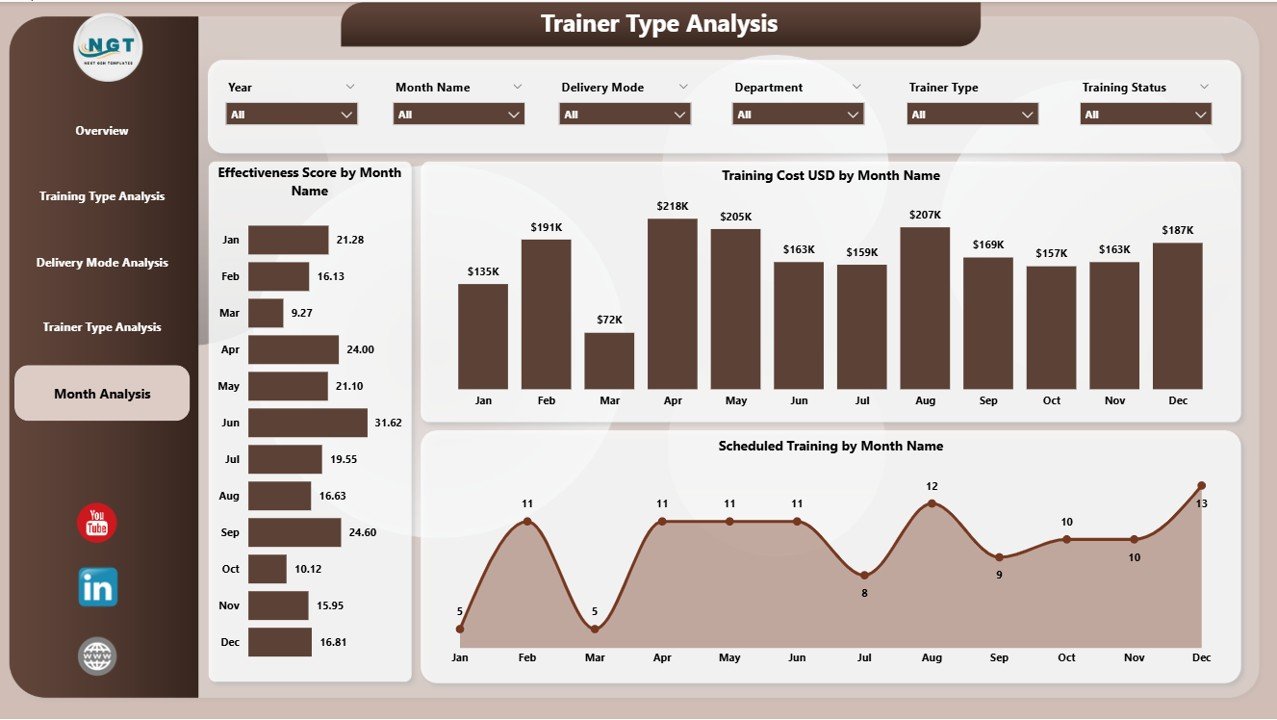
The Monthly Trends page reveals how performance moves across the year.
✔ Charts on This Page
-
Effectiveness Score by Month
-
Training Cost (USD) by Month
-
Scheduled Training % by Month
Trend charts help teams track:
-
Seasonal training performance
-
Monthly variation in training expenses
-
Improvement in training quality over time
With these insights, planning future training calendars becomes easier.
What KPIs Should You Track in an L&D Dashboard?
Your L&D dashboard should include KPIs that measure the entire learning cycle. Some important KPIs include:
✔ Training Cost (USD)
Tracks budget spending on internal or external training programs.
✔ Feedback Rating
Measures employee satisfaction for each session.
✔ Training Completion Rate
Shows how many employees completed assigned programs.
✔ Scheduled Training %
Indicates whether planned training is executed on time.
✔ Effectiveness Score
Measures the quality and usefulness of training content.
✔ Participation Rate
Shows employee interest and engagement.
✔ Average Cost Per Training
Helps optimize budget allocation.
Tracking KPIs helps improve learning programs consistently.
Advantages of a Learning & Development Dashboard in Power BI
Click to Purchases Learning & Development Dashboard in Power BI
A Learning & Development Dashboard offers many practical benefits that support the HR and training teams. Let’s explore the major advantages.
1. Clear Visibility of Training Performance
Leaders get instant insights into:
-
Training types
-
Trainer effectiveness
-
Cost distribution
-
Employee engagement
-
Monthly variations
This saves hours of manual report preparation.
2. Faster Decision-Making
The interactive visuals help managers take quick decisions about:
-
Training expansion
-
Budget planning
-
Mode selection
-
Trainer quality
Faster decisions lead to stronger results.
3. Better Budget Control
The dashboard highlights:
-
Expensive trainers
-
High-cost delivery modes
-
Unproductive training categories
This helps optimize spending and prevent overspending.
4. Higher Training Quality
Feedback ratings and effectiveness scores help teams improve training materials and methods.
5. Improved Employee Engagement
When employees receive the right training, they stay motivated and productive.
6. Streamlined HR Operations
The dashboard removes:
-
Manual tracking
-
Multiple Excel files
-
Duplicate reporting
HR teams work more efficiently and focus on strategic work.
Best Practices for Using a Learning & Development Dashboard
Follow these best practices to get the maximum benefit from your Power BI dashboard.
✔ Keep Data Clean and Updated
Training data should be accurate and consistently updated.
✔ Use KPIs that Support Business Goals
Choose KPIs that directly affect employee performance and growth.
✔ Review Trends Regularly
Monthly trend charts help identify progress and improvement areas.
✔ Compare Different Categories
Always compare:
-
Training types
-
Trainers
-
Delivery modes
-
Departments or regions
This improves decision-making.
✔ Use Slicers for Deep Analysis
Filters help explore training data from every angle.
✔ Train HR Staff to Use the Dashboard
Ensure your team understands how to navigate Power BI.
How Does a Learning & Development Dashboard Improve Business Impact?
A strong L&D dashboard does more than track training numbers. It supports business performance by enabling:
-
Better workforce planning
-
Faster skill development
-
Stronger leadership programs
-
Improved compliance training
-
Higher employee retention
Data-driven L&D strategies improve productivity and create long-term growth.
Conclusion
A Learning & Development Dashboard in Power BI transforms the way HR and L&D teams monitor training performance. It provides clear insights into trainer effectiveness, training types, delivery modes, cost distribution, and monthly performance trends.
With the help of slicers, charts, and KPIs, leaders can take quick decisions, improve learning quality, and plan training budgets more efficiently. When organizations use a powerful dashboard, they ensure strong employee growth and better business outcomes.
Frequently Asked Questions (FAQs)
1. What is a Learning & Development Dashboard in Power BI?
It is an interactive reporting tool that tracks training activities, cost, trainer performance, and learning effectiveness using Power BI visuals.
2. Who should use an L&D dashboard?
HR teams, L&D managers, training coordinators, leadership teams, and department heads use it for monitoring and planning training activities.
3. What KPIs are important for L&D dashboards?
Important KPIs include training cost, feedback rating, effectiveness score, completion rate, participation rate, and scheduled training percentage.
4. Can Power BI handle monthly training analysis?
Yes. Power BI shows monthly trends for cost, effectiveness score, and scheduled training percentages.
5. What are the benefits of using this dashboard?
It improves visibility, enhances decision-making, controls budget, boosts training quality, and increases employee engagement.
6. Is the dashboard easy to update?
Yes. Once the dataset is refreshed, the entire dashboard updates automatically.
7. Can I customize the visuals?
Yes. You can customize visuals, slicers, KPIs, and colors based on organizational needs.
Visit our YouTube channel to learn step-by-step video tutorials