Managing a plastics manufacturing operation is never simple. You must balance production volume, energy consumption, scrap levels, machine utilization, supplier performance, and customer demand—all at the same time. However, when data lives in multiple Excel files or systems, decision-making becomes slow and reactive.
That is exactly where a Plastics Manufacturing Dashboard in Power BI plays a critical role.
Instead of manually reviewing reports, this dashboard transforms raw manufacturing data into interactive visuals, KPIs, and trends. As a result, managers, plant heads, and operations teams gain instant visibility into production efficiency, energy usage, rework levels, and machine performance.
Click to Purchases Plastics Manufacturing Dashboard in Power BI
In this detailed guide, you will clearly understand what a Plastics Manufacturing Dashboard in Power BI is, how it works, its key pages, advantages, best practices, and practical use cases. Additionally, you will find frequently asked questions with clear answers at the end.
What Is a Plastics Manufacturing Dashboard in Power BI?
A Plastics Manufacturing Dashboard in Power BI is an interactive business intelligence solution designed to track, analyze, and improve manufacturing performance across production, energy, quality, suppliers, and customer segments.
Unlike static Excel reports, Power BI dashboards update automatically and allow users to filter data by time, product family, customer segment, or supplier. Therefore, decision-makers spot inefficiencies early and take corrective actions quickly.
Most importantly, this dashboard helps manufacturers answer key questions such as:
-
Where does energy consumption increase?
-
Which product family generates more scrap?
-
Which resin supplier causes rework issues?
-
How efficiently machines operate over time?
Why Do Plastics Manufacturers Need a Power BI Dashboard?
Plastics manufacturing involves energy-intensive processes, tight margins, and strict quality requirements. Because of this, even small inefficiencies create significant cost overruns.
Without a dashboard:
-
Teams rely on delayed and manual reports
-
Managers struggle to identify trends
-
Decisions depend on guesswork instead of data
However, with a Plastics Manufacturing Dashboard in Power BI, companies gain:
-
Centralized performance monitoring
-
Real-time production insights
-
Data-driven operational control
As a result, manufacturing leaders move from reactive management to proactive optimization.
Key Features of the Plastics Manufacturing Dashboard in Power BI
This dashboard includes five well-structured pages, each focusing on a critical part of plastics manufacturing performance.
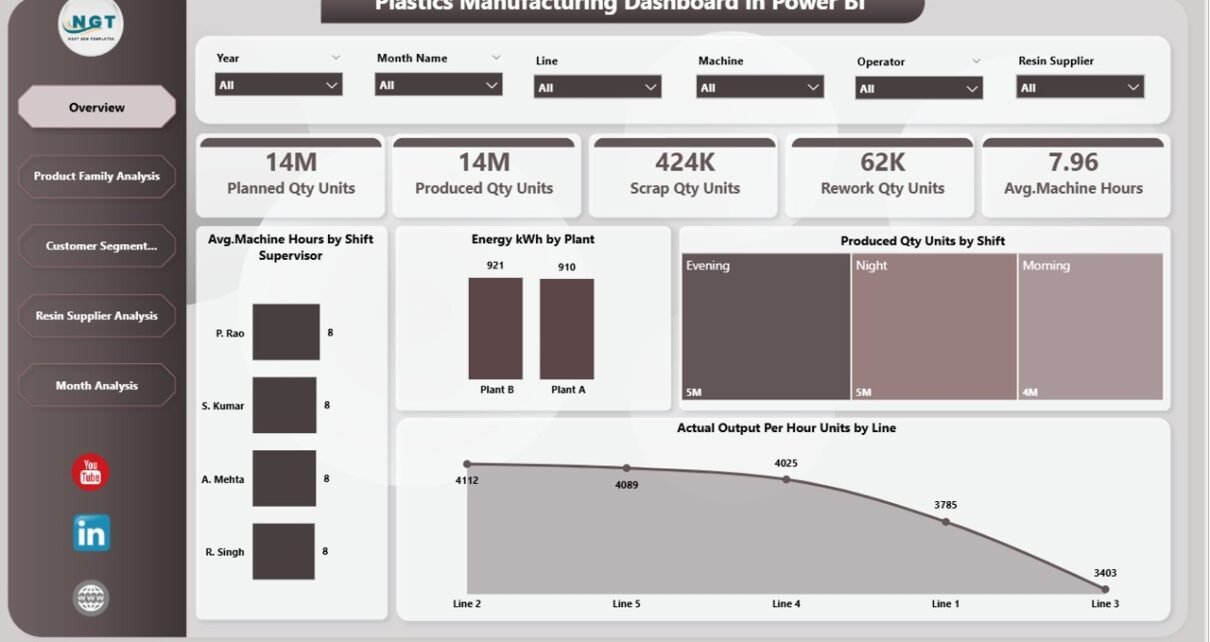
1. Overview Page – Executive Performance Snapshot
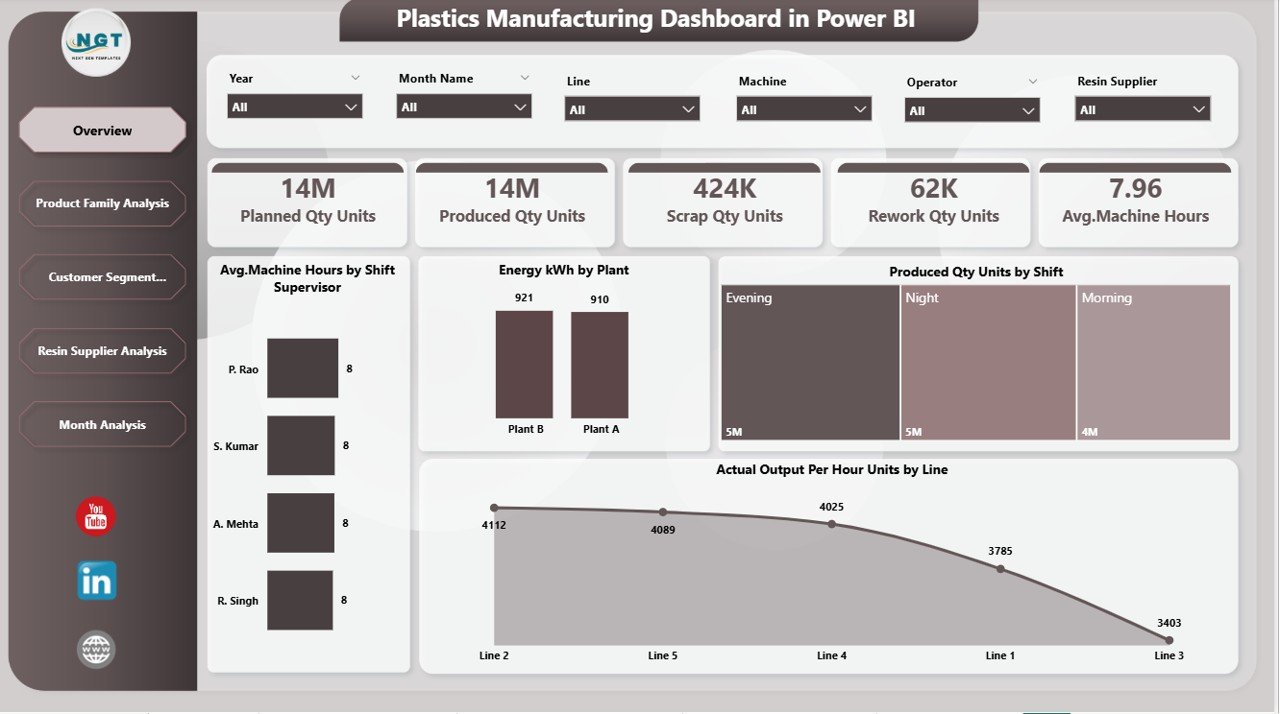
The Overview Page works as the central monitoring screen for management teams.
What does this page show?
-
Interactive slicers to filter data easily
-
4 KPI Cards showing high-level performance indicators
-
4 analytical charts providing trend-based insights
Although this dashboard focuses on manufacturing, the overview layout provides a quick summary view of operational health, making it easy for leaders to grasp performance at a glance.
Because this page prioritizes clarity, it supports fast and confident decision-making.
Click to Purchases Plastics Manufacturing Dashboard in Power BI
How Does Product Family Analysis Improve Manufacturing Insights?
2. Product Family Analysis Page
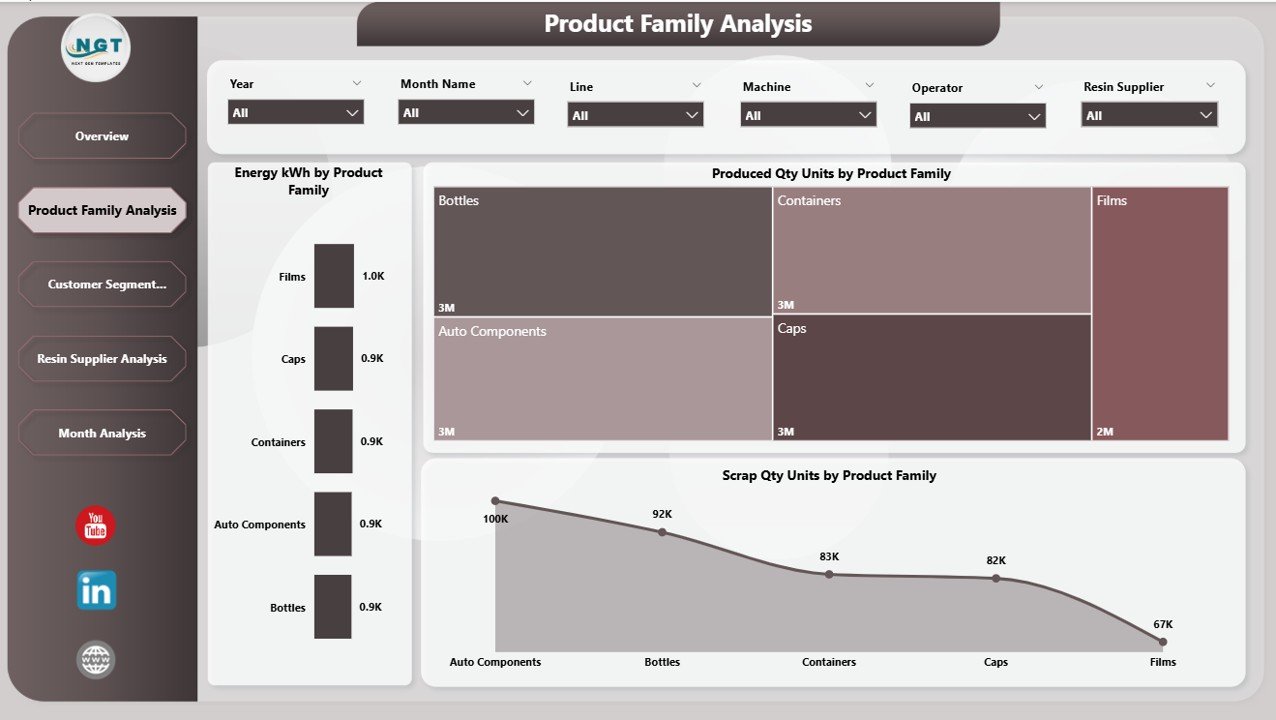
The Product Family Analysis Page breaks down operational metrics by product categories. As a result, manufacturers understand which products drive efficiency and which create bottlenecks.
Charts Included:
-
Energy (kWh) by Product Family
-
Produced Quantity (Units) by Product Family
-
Scrap Quantity (Units) by Product Family
Why is this page important?
-
It highlights energy-heavy product families
-
It reveals high-scrap products
-
It supports product-level cost optimization
Therefore, manufacturers can redesign processes, adjust machine parameters, and improve product profitability.
Why Analyze Performance by Customer Segment?
3. Customer Segment Analysis Page
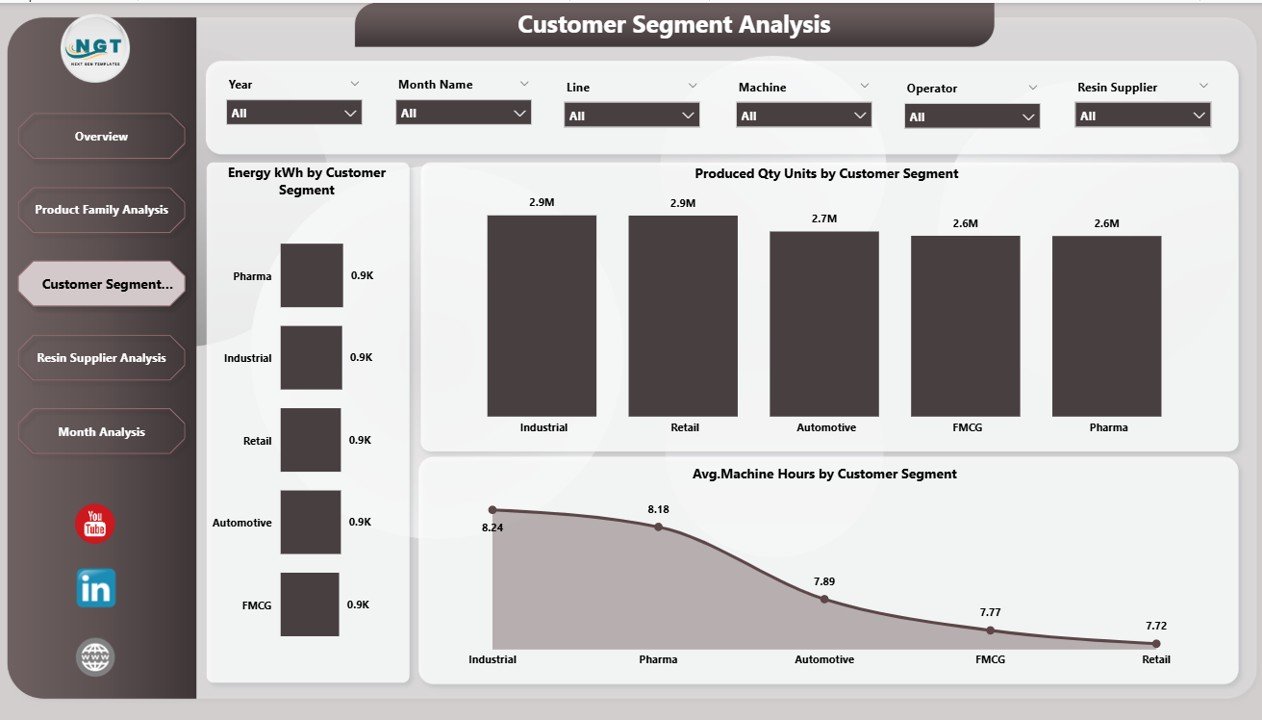
Different customer segments often demand different production approaches. Therefore, analyzing performance by customer type provides valuable insights.
Charts Included:
-
Energy (kWh) by Customer Segment
-
Produced Quantity (Units) by Customer Segment
-
Average Machine Hours by Customer Segment
Business Impact:
-
Identifies high-energy-consuming customers
-
Highlights segments with longer machine usage
-
Supports pricing and service strategy improvements
As a result, manufacturers can align customer profitability with production planning.
How Does Resin Supplier Analysis Reduce Rework?
4. Resin Supplier Analysis Page
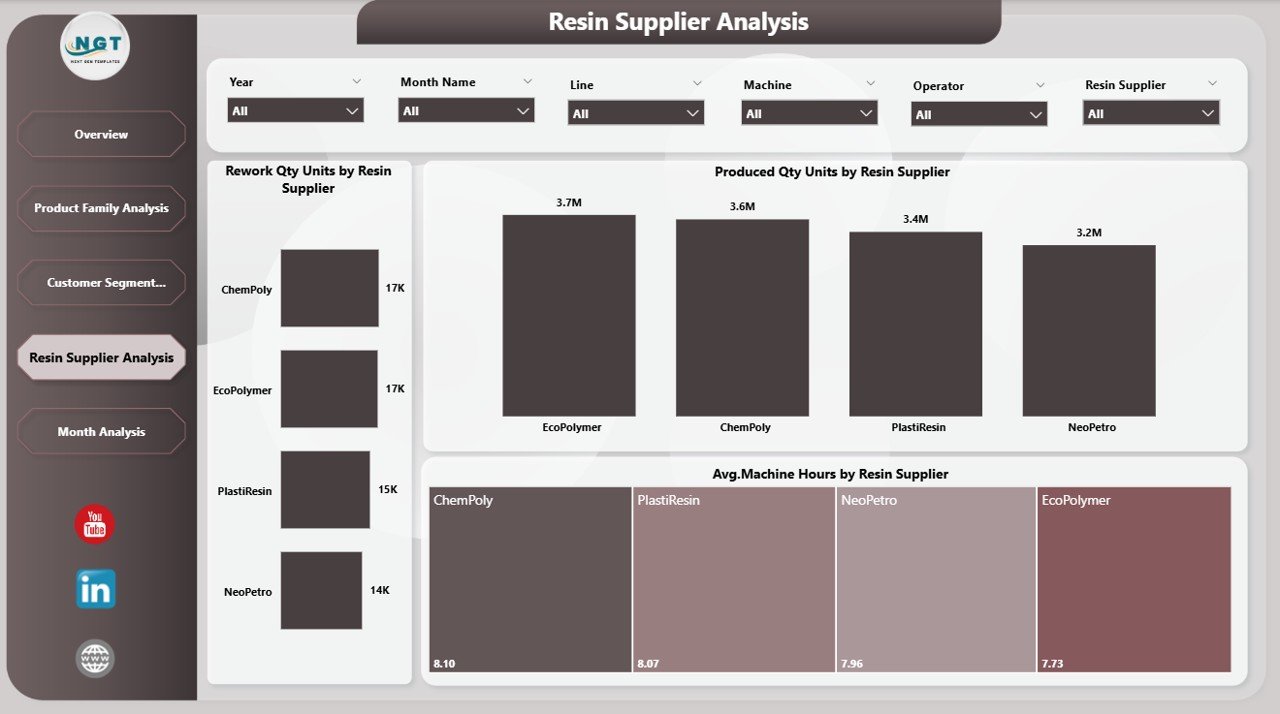
Raw material quality directly affects product quality. Therefore, supplier-level analysis becomes critical for plastics manufacturers.
Charts Included:
-
Rework Quantity (Units) by Resin Supplier
-
Produced Quantity (Units) by Resin Supplier
-
Average Machine Hours by Resin Supplier
Why does this matter?
-
Poor resin quality increases rework
-
Excessive rework wastes energy and machine time
-
Supplier data supports negotiation and sourcing decisions
Because of this analysis, procurement and quality teams work together to select better suppliers and reduce defect rates.
Why Track Monthly Trends in Plastics Manufacturing?
5. Monthly Trends Page
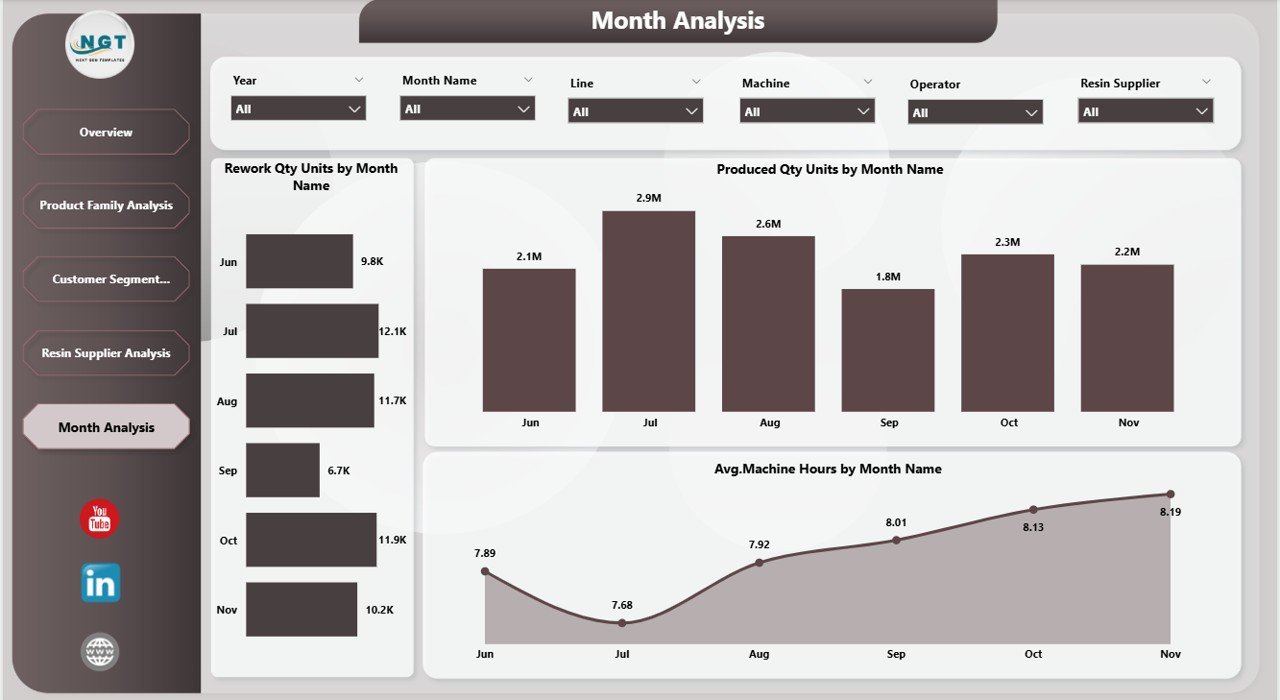
Manufacturing performance changes over time. Therefore, trend analysis ensures long-term stability.
Charts Included:
-
Rework Quantity (Units) by Month
-
Produced Quantity (Units) by Month
-
Average Machine Hours by Month
Benefits of trend tracking:
-
Identifies seasonal patterns
-
Detects gradual efficiency losses
-
Supports capacity planning decisions
As a result, teams anticipate future issues before they disrupt production.
How Does This Dashboard Work with Excel Data?
Click to Purchases Plastics Manufacturing Dashboard in Power BI
Most organizations still capture manufacturing data in Excel. Therefore, this dashboard seamlessly connects Power BI to Excel files.
Typical Data Structure:
-
Production logs
-
Energy consumption records
-
Machine utilization data
-
Supplier quality reports
Once connected, Power BI:
-
Cleans and models data
-
Creates relationships
-
Enables interactive filtering
Thus, teams avoid repetitive report creation and focus on analysis instead of manual work.
Advantages of Plastics Manufacturing Dashboard in Power BI
A Plastics Manufacturing Dashboard in Power BI delivers clear operational and strategic benefits.
Key Advantages:
-
✅ Real-time performance visibility
-
✅ Reduced manual reporting effort
-
✅ Improved energy efficiency tracking
-
✅ Lower scrap and rework levels
-
✅ Better supplier accountability
-
✅ Enhanced production planning
Moreover, because Power BI updates automatically, teams always work with accurate and consistent information.
Opportunities for Improvement Using This Dashboard
Every dashboard also highlights improvement opportunities when used effectively.
Improvement Areas:
-
Energy optimization by product family
-
Machine hour reduction using trend analysis
-
Supplier rationalization based on quality metrics
-
Customer profitability assessment
Therefore, this dashboard acts as a continuous improvement engine for plastics manufacturing operations.
Best Practices for the Plastics Manufacturing Dashboard in Power BI
To maximize value, companies should follow proven best practices.
✅ Best Practices:
-
Maintain clean and structured Excel data
-
Define standard KPI definitions upfront
-
Use consistent units of measurement
-
Review dashboards weekly with plant teams
-
Combine dashboard insights with shop-floor observations
-
Train users on slicers and drill-down features
By following these best practices, organizations ensure long-term dashboard success and adoption.
Who Can Use This Dashboard?
This dashboard serves multiple stakeholders across the organization.
Ideal Users:
-
Plant Managers
-
Production Engineers
-
Operations Heads
-
Quality Managers
-
Procurement Teams
-
Senior Leadership
Because Power BI offers role-based access, each group views relevant insights without data overload.
Common Use Cases in Plastics Manufacturing
This dashboard supports real-world decision-making.
Practical Use Cases:
-
Reducing energy cost per unit
-
Identifying inefficient product lines
-
Improving supplier quality
-
Monitoring rework reduction initiatives
-
Planning machine maintenance schedules
As a result, companies see measurable operational improvements.
Conclusion
A Plastics Manufacturing Dashboard in Power BI transforms manufacturing data into actionable intelligence. Instead of reacting to past problems, teams proactively manage production, energy, quality, and suppliers.
Because this dashboard offers interactive views, structured KPIs, and trend analysis, it becomes an essential tool for modern plastics manufacturing operations. When combined with strong data discipline and management commitment, it delivers sustainable efficiency and profitability.
Click to Purchases Plastics Manufacturing Dashboard in Power BI
Frequently Asked Questions (FAQs)
1. What data do I need for a Plastics Manufacturing Dashboard in Power BI?
You need production data, energy consumption data, machine hours, scrap and rework data, and supplier details.
2. Can this dashboard work with Excel data?
Yes, Power BI connects directly to Excel files and updates automatically.
3. Is Power BI suitable for small manufacturing units?
Yes, even small plants benefit from performance visibility and cost control.
4. How often should I update the dashboard?
Daily or weekly updates work best for operational tracking.
5. Does this dashboard require coding knowledge?
No. Basic Power BI knowledge is enough to use and maintain it.
6. Can I customize KPIs in this dashboard?
Yes. You can modify KPIs based on plant-specific requirements.
Visit our YouTube channel to learn step-by-step video tutorials