Managing electricity tenders requires precision, transparency, and strong analytical control. However, many organizations still rely on scattered spreadsheets and manual tracking. As a result, decision-making becomes slow and error-prone. Therefore, businesses, utilities, and contractors increasingly need a centralized analytical solution.
That is exactly where the Electricity Tender Dashboard in Excel becomes a powerful and practical tool.
In this detailed article, you will learn everything about the Electricity Tender Dashboard in Excel. Moreover, you will understand its structure, features, advantages, use cases, best practices, and real-world benefits. Additionally, this guide explains each dashboard page clearly so that you can use or customize it with confidence.
Click to Purchases Electricity Tender Dashboard in Excel
What Is an Electricity Tender Dashboard in Excel?
An Electricity Tender Dashboard in Excel is a ready-to-use analytical template designed to track, monitor, and analyze electricity-related tenders in one place.
Instead of working with multiple raw data sheets, this dashboard transforms tender data into visual insights using pivot tables, charts, slicers, and KPI cards. As a result, stakeholders can quickly evaluate bid values, project costs, profits, success rates, and trends.
Moreover, since it runs entirely in Excel, it remains accessible, flexible, and easy to maintain.
Why Is the Electricity Tender Dashboard in Excel Important?
Electricity tenders involve high-value projects, multiple bidders, strict timelines, and regional dependencies. Therefore, even small data gaps can lead to poor decisions.
Here is why this dashboard matters:
-
It centralizes tender data into one structured system
-
It improves bid evaluation accuracy
-
It reduces manual reporting effort
-
It supports faster management decisions
-
It enhances transparency and accountability
Consequently, organizations gain better control over tender performance.
Click to Purchases Electricity Tender Dashboard in Excel
Who Should Use an Electricity Tender Dashboard in Excel?
This dashboard serves multiple stakeholders across the electricity and utility ecosystem.
Ideal Users Include:
-
Electricity distribution companies
-
Power generation companies
-
EPC contractors
-
Government procurement departments
-
Energy consultants
-
Tender and bid management teams
-
Finance and commercial teams
Because Excel remains widely used, teams can adopt this dashboard without additional software costs.
Key Features of the Electricity Tender Dashboard in Excel
This dashboard includes well-structured features that improve usability and insights.
1. Page Navigator for Easy Navigation
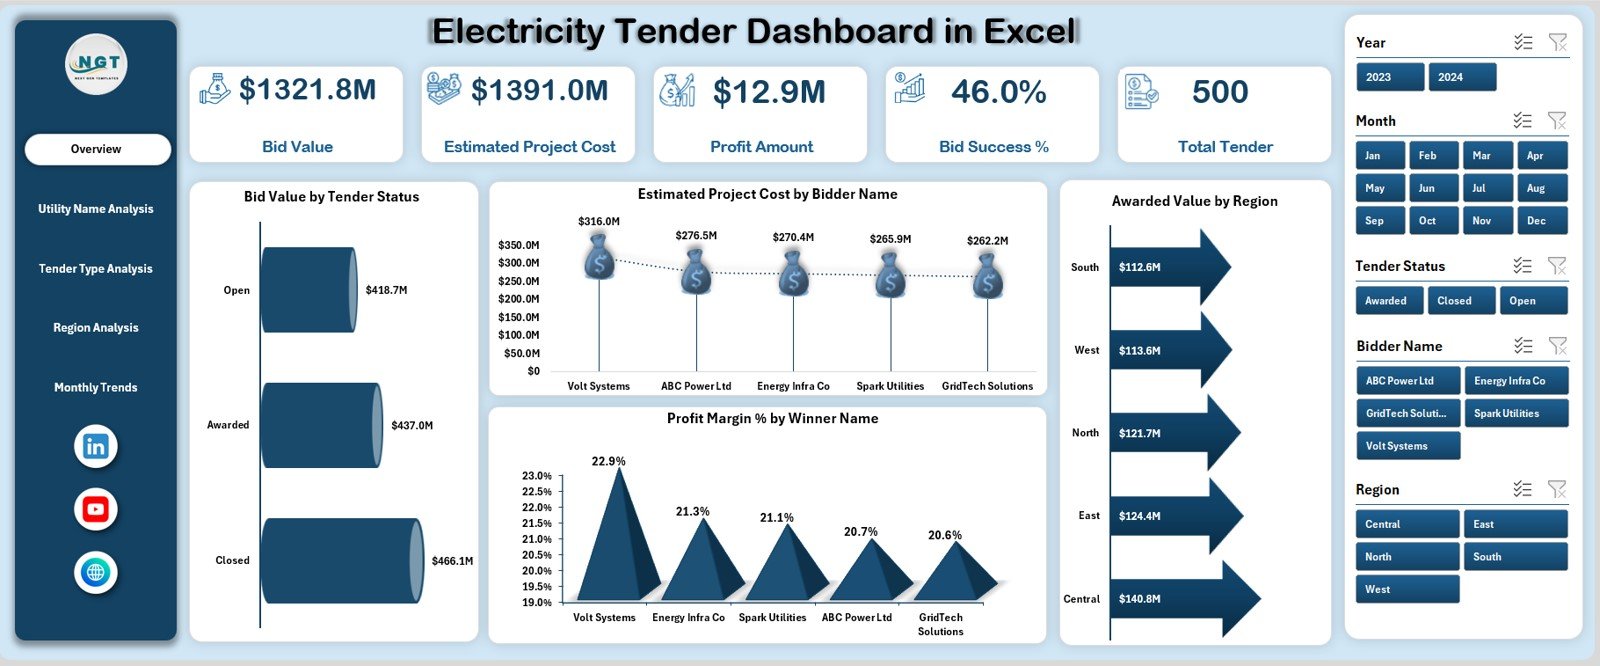
The Page Navigator, located on the left side, allows users to move quickly between analytical pages. As a result, users save time and maintain workflow continuity.
2. Right-Side Slicers for Dynamic Filtering
Each page includes right-side slicers that allow filtering by:
-
Region
-
Utility Name
-
Tender Type
-
Month
-
Tender Status
Therefore, users can analyze data dynamically without changing formulas.
3. Five Interactive Analytical Pages
The dashboard consists of five powerful analytical pages, each focused on a specific insight area.
Click to Purchases Electricity Tender Dashboard in Excel
Overview Page: How Does the Overview Page Help Decision-Makers?
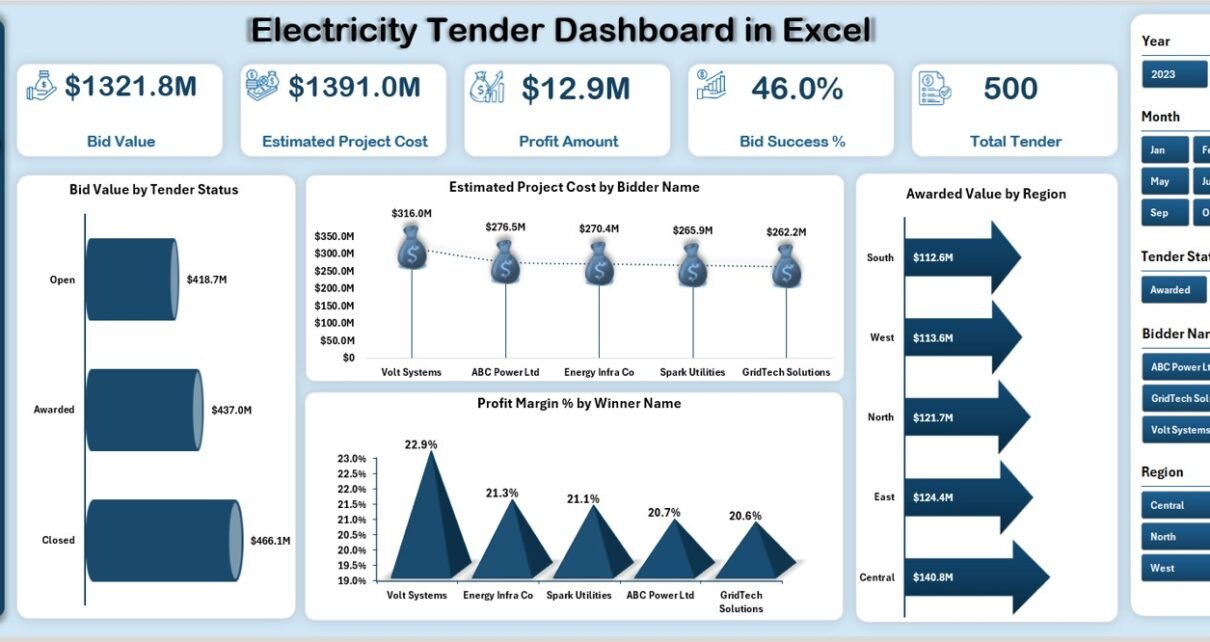
The Overview Page acts as the executive summary of the Electricity Tender Dashboard in Excel. It provides instant visibility into tender performance.
Key KPI Cards on the Overview Page
This page displays five KPI cards:
-
Bid Value – Total bid value submitted
-
Estimated Project Cost – Planned project cost
-
Profit Amount – Expected profit from awarded tenders
-
Bid Success – Success rate of bids
-
Total Tender – Total number of tenders
Because these KPIs appear at the top, stakeholders can assess performance within seconds.
Charts on the Overview Page
The Overview Page includes four insightful charts:
-
Bid Value by Tender Status
-
Estimated Project Cost by Bidder Name
-
Awarded Value by Region
-
Profit Margin % by Winner Name
As a result, users can quickly compare financial performance and regional outcomes.
Click to Purchases Electricity Tender Dashboard in Excel
Utility Name Analysis: Why Is Utility-Wise Analysis Important?
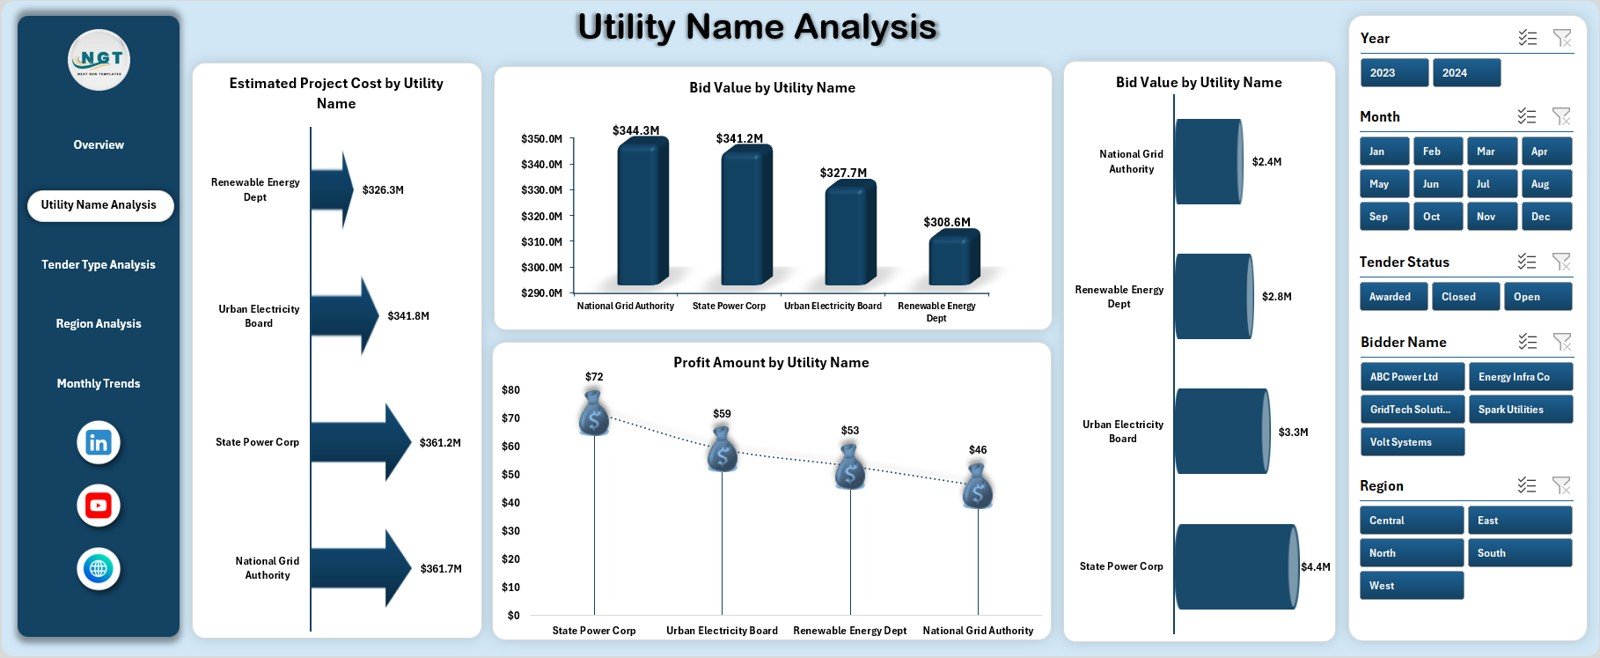
Different utility companies often follow different tender patterns. Therefore, analyzing tenders by utility name becomes essential.
Charts in Utility Name Analysis
This page includes four analytical charts:
-
Estimated Project Cost by Utility Name
-
Bid Value by Utility Name
-
Awarded Value by Utility Name
-
Profit Amount by Utility Name
Because of this breakdown, organizations can:
-
Identify high-value utility clients
-
Compare profitability across utilities
-
Optimize future bidding strategies
Tender Type Analysis: How Does Tender Type Impact Performance?
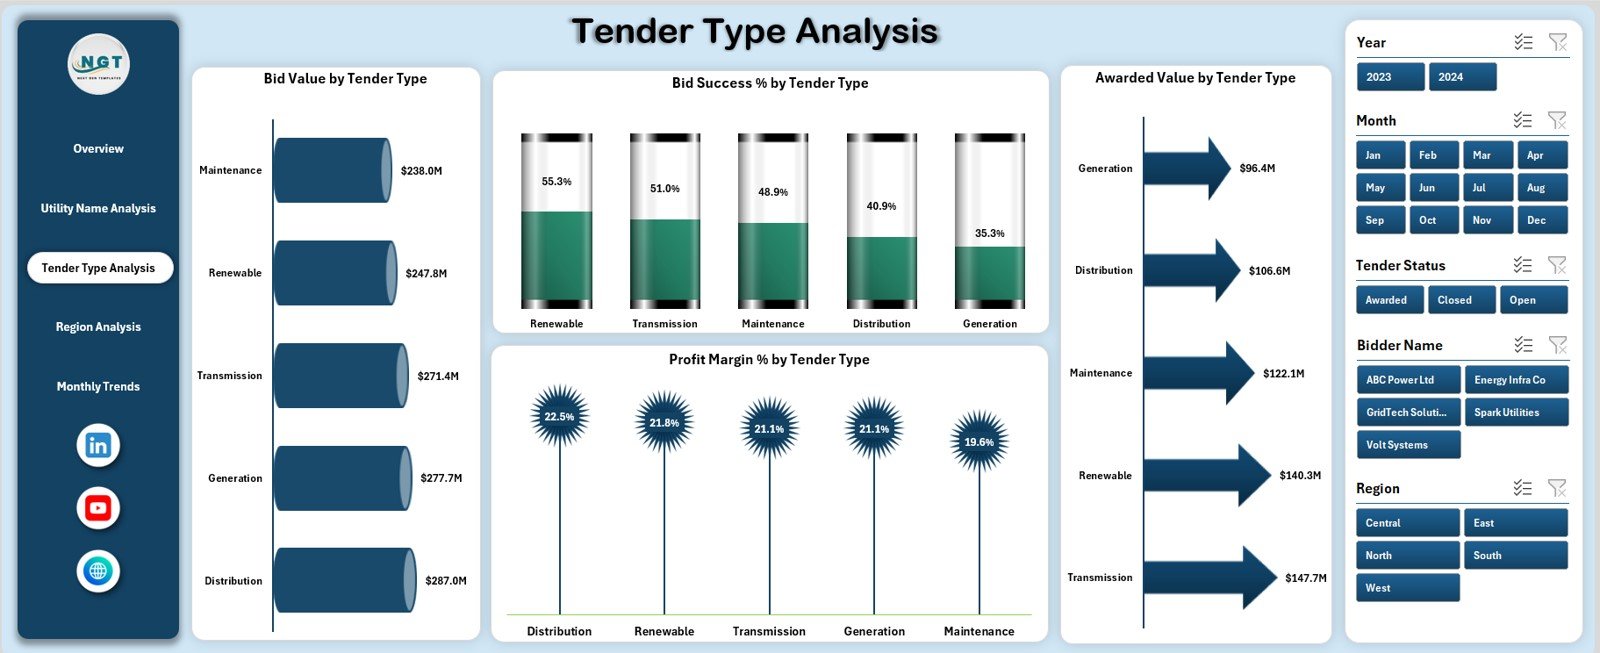
Electricity tenders vary by type, such as supply, installation, maintenance, or EPC contracts. Hence, tender-type analysis provides deeper insights.
Charts in Tender Type Analysis
This page displays four focused charts:
-
Bid Value by Tender Type
-
Bid Success % by Tender Type
-
Awarded Value by Tender Type
-
Profit Margin % by Tender Type
Therefore, management can easily identify which tender types deliver higher success rates and better margins.
Region Analysis: Why Should You Analyze Tenders by Region?
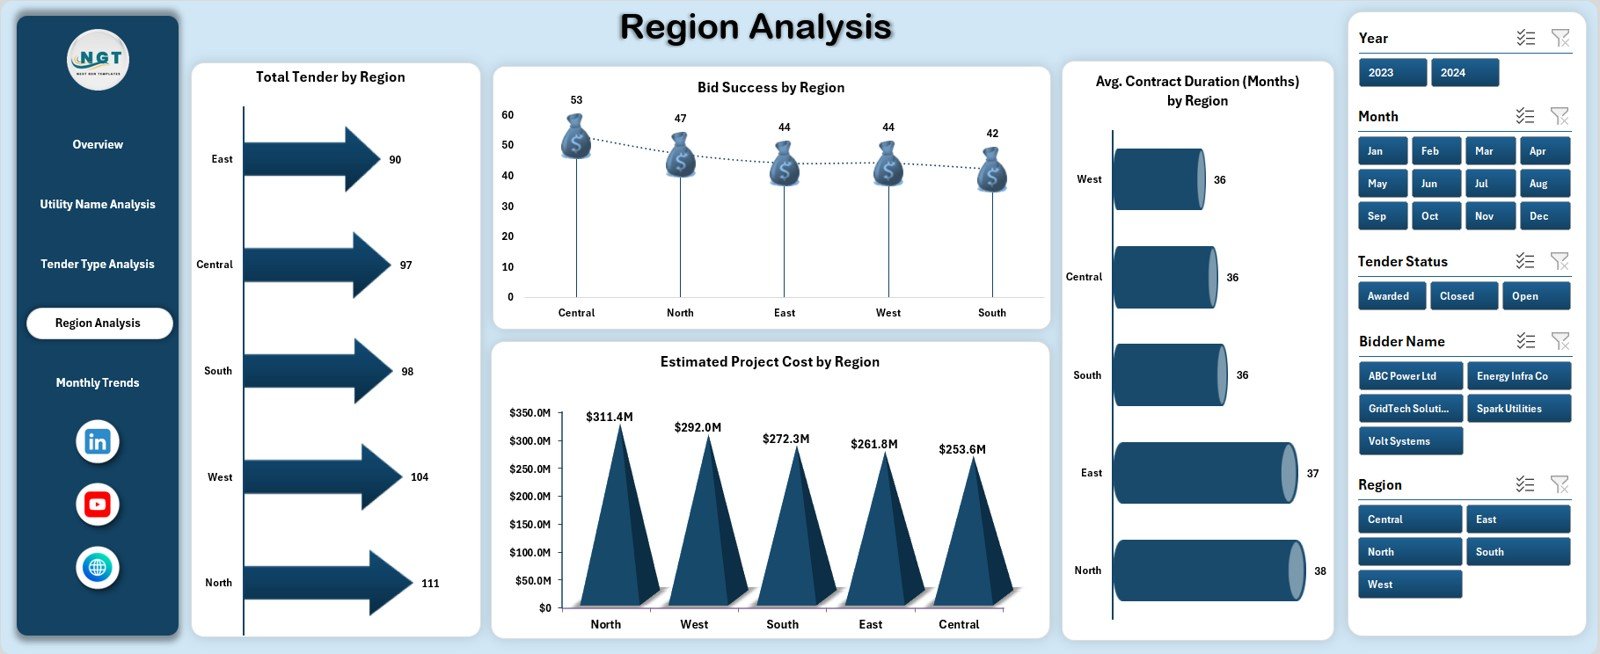
Regional factors such as regulations, competition, and infrastructure strongly affect tender outcomes. Consequently, regional analysis becomes critical.
Charts in Region Analysis
This page includes four region-based charts:
-
Total Tender by Region
-
Bid Success by Region
-
Estimated Project Cost by Region
-
Average Contract Duration (Months) by Region
With these insights, organizations can:
-
Focus on high-performing regions
-
Understand regional cost structures
-
Plan resources more effectively
Monthly Trends: How Can Monthly Analysis Improve Planning?
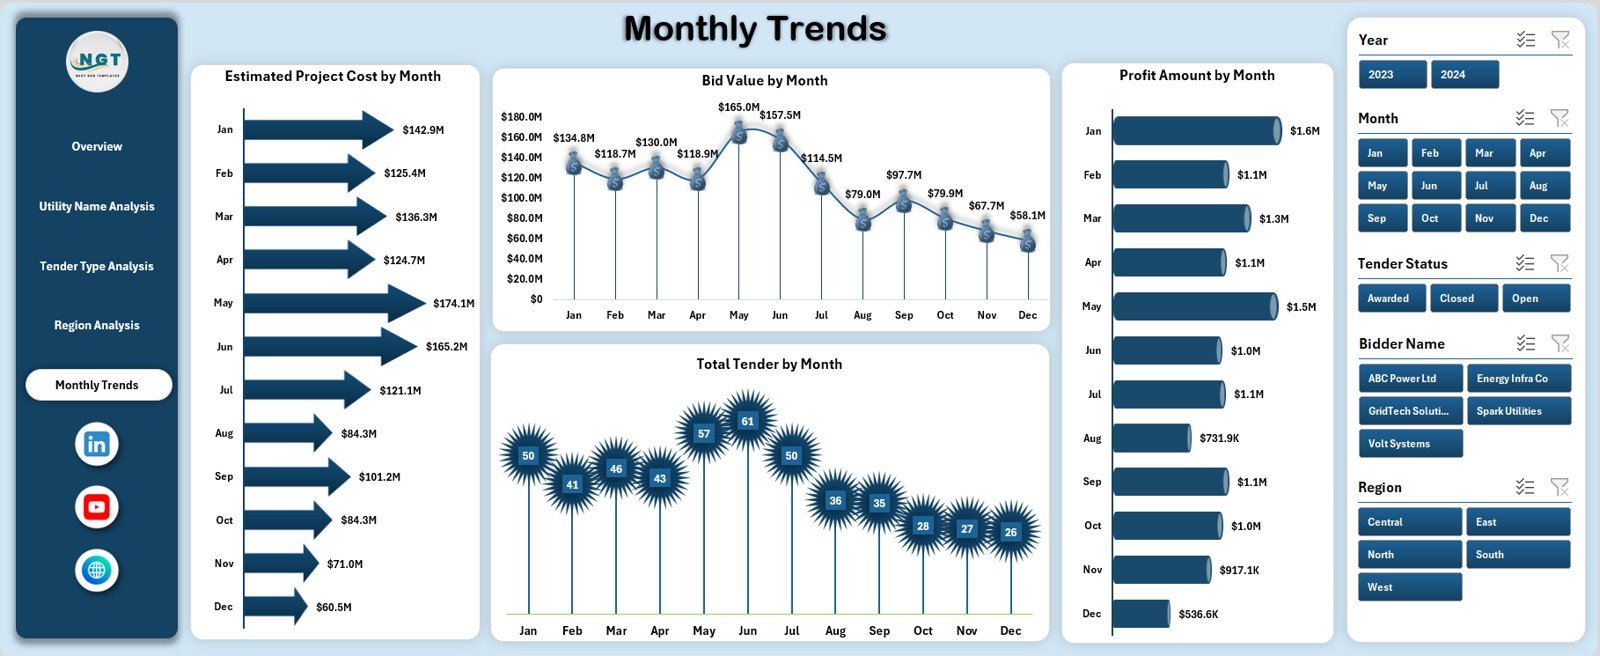
Tracking monthly trends helps organizations identify seasonality and performance fluctuations.
Charts in Monthly Trends Page
This page shows four time-based charts:
-
Estimated Project Cost by Month
-
Bid Value by Month
-
Profit Amount by Month
-
Total Tender by Month
As a result, decision-makers can:
-
Detect seasonal bidding patterns
-
Forecast future tender volumes
-
Improve cash flow planning
Data Sheet and Support Sheet: Why Are They Important?
Data Sheet
The Data Sheet stores all raw tender data in a structured tabular format. This sheet feeds pivot tables and charts across the dashboard.
Typical columns include:
-
Tender ID
-
Utility Name
-
Tender Type
-
Region
-
Bid Value
-
Estimated Project Cost
-
Awarded Value
-
Profit Amount
-
Profit Margin %
-
Tender Status
-
Contract Duration
-
Tender Date
Support Sheet
The Support Sheet contains:
-
Helper calculations
-
Mapping tables
-
Validation lists
-
Intermediate pivot tables
Therefore, the dashboard remains clean, scalable, and easy to maintain.
Click to Purchases Electricity Tender Dashboard in Excel
Advantages of Electricity Tender Dashboard in Excel
Using this dashboard delivers multiple operational and strategic advantages.
Key Advantages:
-
📊 Centralized tender performance tracking
-
⚡ Faster bid evaluation and reporting
-
💰 Clear visibility into profit and cost drivers
-
🌍 Region-wise and utility-wise insights
-
📅 Strong trend and seasonality analysis
-
📈 Improved strategic decision-making
-
🧩 Easy customization without coding
Because of these benefits, organizations gain a competitive edge.
How Does This Dashboard Improve Tender Decision-Making?
The dashboard converts raw tender data into actionable insights. Therefore, managers can:
-
Prioritize profitable tenders
-
Reduce low-success bidding
-
Optimize regional strategies
-
Improve financial forecasting
As a result, teams move from reactive reporting to proactive planning.
Click to Purchases Electricity Tender Dashboard in Excel
Best Practices for the Electricity Tender Dashboard in Excel
Following best practices ensures long-term dashboard accuracy and usability.
1. Maintain Clean and Consistent Data
Always use consistent naming for regions, utilities, and tender types. Otherwise, pivot results may become inaccurate.
2. Update Data Regularly
Update the data sheet frequently to keep insights current. As a result, management decisions remain relevant.
3. Use Slicers Thoughtfully
Limit slicers to key dimensions to avoid confusion. Therefore, users can focus on insights instead of navigation.
4. Validate Key Calculations
Double-check profit and margin formulas regularly. This practice ensures financial accuracy.
5. Keep Visuals Simple
Avoid overcrowded charts. Instead, use clean visuals that highlight trends clearly.
6. Protect Critical Sheets
Protect support and formula sheets to prevent accidental changes.
Common Challenges and How to Overcome Them
Challenge 1: Inconsistent Tender Data
Solution: Use data validation rules and dropdown lists.
Challenge 2: Too Many Metrics
Solution: Focus on KPIs that align with business goals.
Challenge 3: Performance Issues with Large Data
Solution: Optimize pivot tables and remove unused columns.
Conclusion: Why Should You Use an Electricity Tender Dashboard in Excel?
The Electricity Tender Dashboard in Excel provides a structured, visual, and data-driven way to manage electricity tenders. Moreover, it helps organizations track bids, evaluate profitability, analyze trends, and improve success rates.
Because it uses Excel, teams can implement it quickly without heavy IT investment. Therefore, this dashboard becomes an essential tool for utilities, contractors, and procurement teams aiming for smarter tender decisions.
Frequently Asked Questions (FAQs)
1. What is the main purpose of an Electricity Tender Dashboard in Excel?
The main purpose is to analyze electricity tenders, track bid performance, and support data-driven decision-making.
2. Can beginners use this dashboard?
Yes, the dashboard uses simple Excel features, so beginners can use it easily.
3. Does this dashboard require macros?
No, it works with pivot tables, charts, and slicers without macros.
4. Can I customize the dashboard?
Yes, you can add new KPIs, charts, or pages as per your needs.
5. Is this dashboard suitable for large datasets?
Yes, with proper data structuring, it can handle large tender datasets efficiently.
6. Can this dashboard support monthly and yearly analysis?
Yes, the Monthly Trends page and slicers support time-based analysis.
Click to Purchases Electricity Tender Dashboard in Excel
Visit our YouTube channel to learn step-by-step video tutorials