Managing clinic tenders involves large volumes of data, strict timelines, multiple stakeholders, and constant financial pressure. However, when clinics manage tender information using scattered Excel files or manual reports, errors increase and insights reduce. Therefore, healthcare organizations need a smarter, faster, and more visual solution.
This is exactly where the Clinic Tender Dashboard in Excel helps.
In this detailed article, you will learn what the Clinic Tender Dashboard in Excel is, how it works, why clinics need it, its key features, advantages, best practices, and frequently asked questions. Moreover, the language remains simple, clear, and practical so that anyone can understand and use it easily.
Click to Purchases Clinic Tender Dashboard in Excel
What Is a Clinic Tender Dashboard in Excel?
A Clinic Tender Dashboard in Excel is a ready-to-use analytical Excel template designed to track, monitor, and analyze clinic-related tender data from a single place.
Instead of reviewing raw rows and columns, this dashboard converts data into:
-
Interactive charts
-
Summary KPI cards
-
Category-wise insights
-
Monthly performance trends
As a result, clinic administrators, finance teams, and procurement managers gain complete visibility into tender performance without using expensive software.
Moreover, because this dashboard works inside Excel, users do not need technical or coding skills.
Why Do Clinics Need a Tender Dashboard in Excel?
Clinic tenders involve medical equipment, facility services, maintenance contracts, IT systems, and more. Therefore, clinics must monitor bid values, awarded tenders, estimated costs, and success rates accurately.
However, traditional methods create several problems:
-
Data remains scattered across multiple files
-
Decision-making becomes slow
-
Errors increase due to manual handling
-
Performance tracking becomes unclear
Therefore, a Clinic Tender Dashboard in Excel solves these problems by centralizing data and presenting insights visually.
How Does the Clinic Tender Dashboard in Excel Work?
The Clinic Tender Dashboard works through a structured data flow:
-
You enter tender data into the Data Sheet
-
Excel formulas and pivot tables process the data
-
Charts and KPIs update automatically
-
You navigate insights using the Page Navigator
As a result, every update reflects instantly across all dashboard pages.
Key Features of the Clinic Tender Dashboard in Excel
This dashboard includes multiple professionally designed features that improve analysis and usability.
What Is the Page Navigator and Why Is It Important?
The Page Navigator, located on the left side, allows users to move quickly between different dashboard pages.
Benefits of the Page Navigator
-
Saves time while analyzing data
-
Improves user experience
-
Eliminates confusion
-
Supports professional reporting
Because of this feature, users never struggle to find the right insights.
How Many Pages Are Included in the Clinic Tender Dashboard in Excel?
This dashboard includes five analytical pages, each focusing on a different perspective of clinic tender performance.
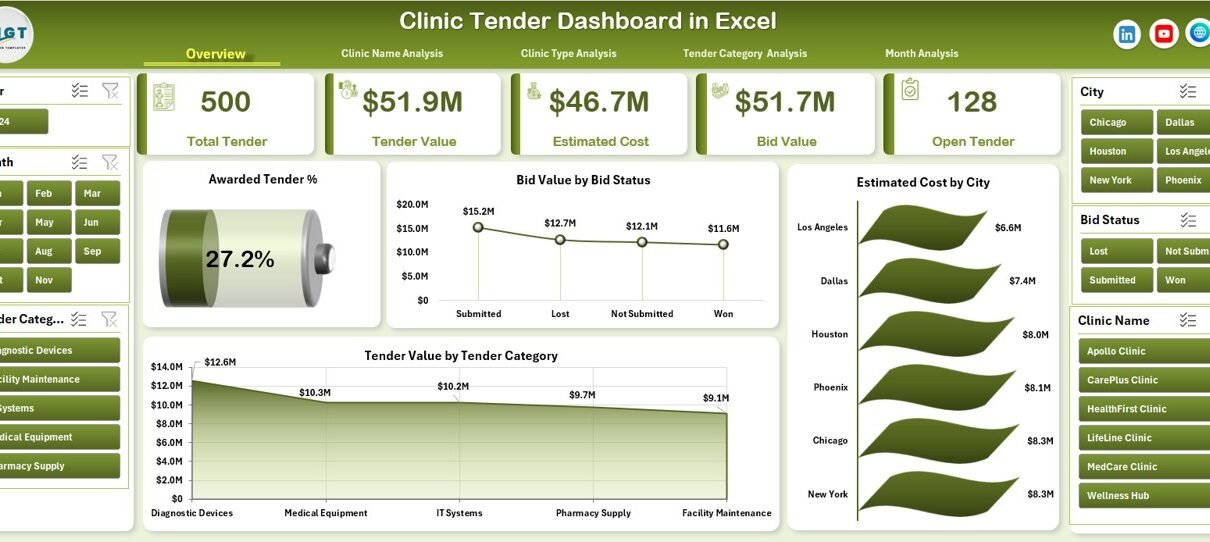
1. Overview Page: What Insights Does It Provide?
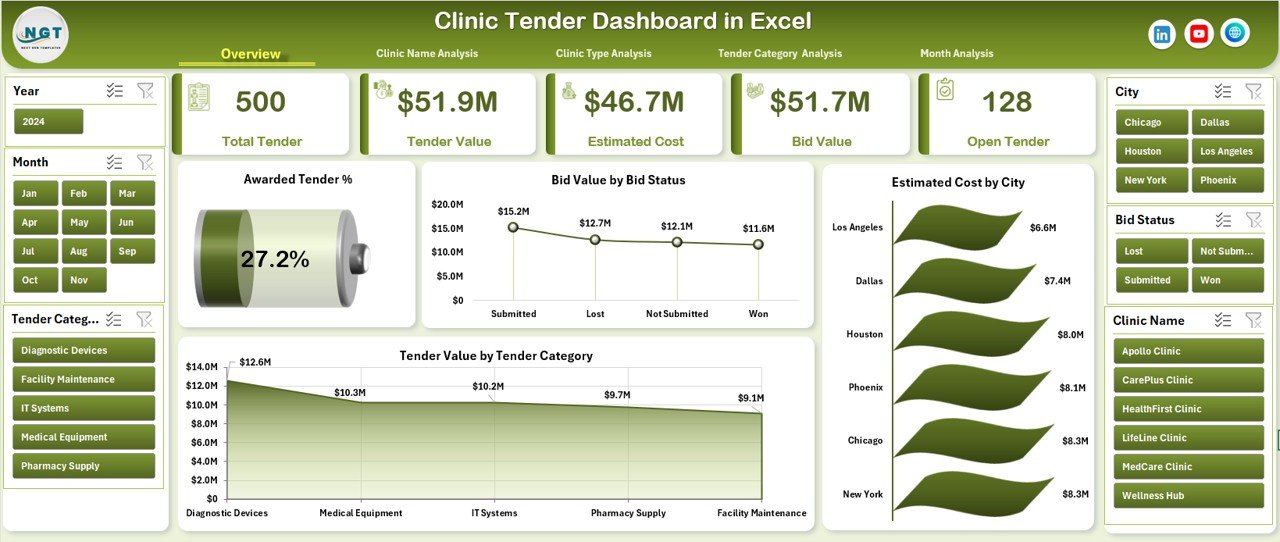
The Overview Page acts as the control center of the dashboard.
Key Elements of the Overview Page
KPI Cards
The overview page includes four KPI cards that provide quick insights:
-
Awarded Tender Percentage
-
Total Bid Value
-
Estimated Cost
-
Total Tender Value
These cards help decision-makers understand performance instantly.
Charts on the Overview Page
This page includes four powerful charts:
-
Awarded Tender %
-
Bid Value by Bid Status
-
Estimated Cost by City
-
Tender Value by Tender Category
Together, these visuals answer critical questions within seconds.
Click to Purchases Clinic Tender Dashboard in Excel
2. Clinic Name Analysis: Why Is It Important?
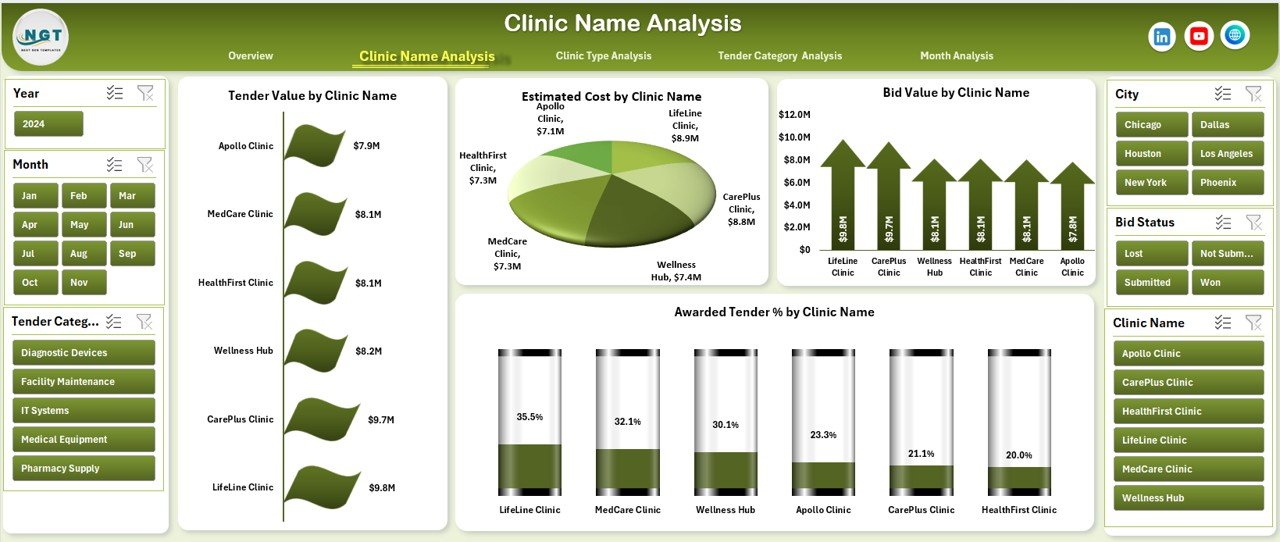
Different clinics perform differently. Therefore, analyzing tenders by clinic name becomes essential.
Insights Available on Clinic Name Analysis Page
This page includes four charts:
-
Tender Value by Clinic Name
-
Estimated Cost by Clinic Name
-
Bid Value by Clinic Name
-
Awarded Tender % by Clinic Name
Because of this analysis, management can:
-
Identify high-performing clinics
-
Detect underperforming locations
-
Allocate resources better
3. Clinic Type Analysis: How Does It Help Decision-Makers?
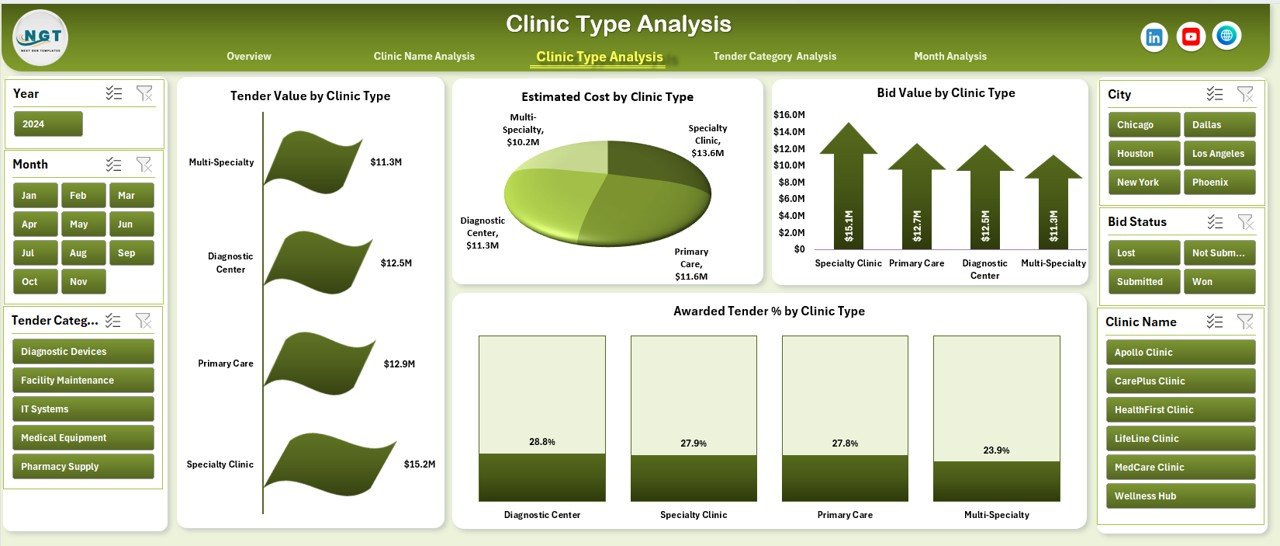
Clinics often fall into categories such as general clinics, specialty clinics, diagnostic centers, and multi-specialty hospitals.
Charts on the Clinic Type Analysis Page
This page includes:
-
Tender Value by Clinic Type
-
Estimated Cost by Clinic Type
-
Bid Value by Clinic Type
-
Awarded Tender % by Clinic Type
As a result, organizations can compare performance across clinic types easily.
4. Tender Category Analysis: What Can You Learn from It?
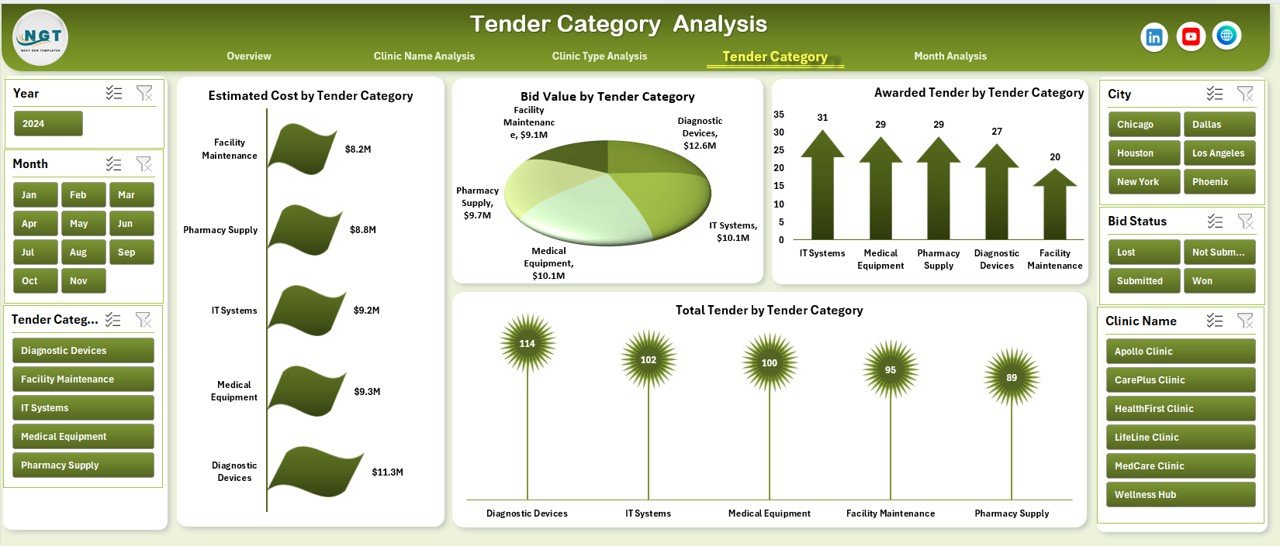
Clinic tenders usually belong to categories such as equipment, IT services, maintenance, supplies, and outsourcing.
Key Charts on Tender Category Analysis Page
This page includes:
-
Estimated Cost by Tender Category
-
Bid Value by Tender Category
-
Awarded Tenders by Tender Category
-
Total Tenders by Tender Category
Therefore, procurement teams understand which categories deliver higher success rates.
5. Month Analysis: Why Is Time-Based Tracking Essential?

Tender performance changes over time. Therefore, monthly analysis becomes critical.
Charts Available on the Month Analysis Page
Click to Purchases Clinic Tender Dashboard in Excel
This page includes:
-
Tender Value by Month
-
Estimated Cost by Month
-
Bid Value by Month
Because of this page, clinics can:
-
Identify seasonal trends
-
Forecast upcoming tender volumes
-
Plan budgets effectively
What Are the Supporting Sheets in the Dashboard?
Apart from dashboard pages, the file includes supporting sheets that ensure smooth functionality.
Data Sheet
-
Stores raw tender data
-
Acts as the backbone of the dashboard
-
Automatically feeds all charts
Support Sheet
-
Contains helper calculations
-
Improves performance and accuracy
-
Keeps the dashboard clean and organized
Advantages of the Clinic Tender Dashboard in Excel
Using this dashboard offers several clear advantages.
1. Centralized Tender Management
All tender data stays in one Excel file. Therefore, users avoid confusion and duplication.
2. Better Decision-Making
Visual charts highlight trends and risks quickly. As a result, decisions improve.
3. Time-Saving Reporting
Users no longer build reports manually. Hence, productivity increases.
4. Improved Transparency
Stakeholders see the same data and insights, which improves trust.
5. No Additional Software Cost
Since the dashboard runs in Excel, clinics avoid expensive tools.
6. Easy Customization
Users can modify charts, add KPIs, or extend data easily.
Who Can Use the Clinic Tender Dashboard in Excel?
This dashboard helps multiple stakeholders, including:
-
Clinic administrators
-
Procurement teams
-
Finance managers
-
Healthcare consultants
-
Hospital management teams
Because of its simplicity, anyone with basic Excel knowledge can use it.
Best Practices for the Clinic Tender Dashboard in Excel
Following best practices ensures accurate insights and long-term value.
1. Maintain Clean Data
Always enter consistent clinic names, categories, and dates.
2. Update Data Regularly
Frequent updates keep insights relevant and reliable.
3. Avoid Manual Formula Changes
Let the dashboard calculations work automatically.
4. Use Filters Wisely
Apply slicers and filters to focus on specific clinics or periods.
5. Review Monthly Trends
Track month-wise changes to detect early issues.
6. Backup the File Regularly
Always keep a secure backup to avoid data loss.
How Does This Dashboard Improve Tender Success Rate?
This dashboard improves success rates by:
-
Identifying winning patterns
-
Highlighting high-performing clinic types
-
Revealing cost vs award gaps
-
Supporting data-driven bid strategies
As a result, clinics submit smarter and more competitive bids.
Can You Customize the Clinic Tender Dashboard in Excel?
Yes, users can customize:
-
KPIs
-
Chart types
-
Clinic categories
-
Time periods
Because the dashboard uses standard Excel features, customization remains easy.
How Does This Dashboard Support Financial Planning?
The dashboard connects estimated costs, bid values, and awarded percentages. Therefore, finance teams:
-
Track budget utilization
-
Forecast future costs
-
Reduce financial risks
Conclusion: Why Should Clinics Use a Tender Dashboard in Excel?
Click to Purchases Clinic Tender Dashboard in Excel
The Clinic Tender Dashboard in Excel transforms raw tender data into actionable insights. It improves visibility, saves time, reduces errors, and supports smarter decisions.
Moreover, because it works inside Excel, clinics avoid complex systems and heavy investments. Therefore, this dashboard becomes an ideal solution for modern healthcare procurement teams.
If clinics want clarity, control, and confidence in tender management, this dashboard delivers exactly that.
Frequently Asked Questions (FAQs)
1. What is a Clinic Tender Dashboard in Excel?
A Clinic Tender Dashboard in Excel is a ready-to-use Excel template that visually analyzes clinic tender data using charts and KPIs.
2. Do I need advanced Excel skills to use this dashboard?
No. Basic Excel knowledge is enough to use and understand the dashboard.
3. Can I add more clinics or tender categories?
Yes. You can add new data rows, and the dashboard updates automatically.
4. Is this dashboard suitable for small clinics?
Yes. Both small and large clinics can use this dashboard effectively.
5. Can I track monthly tender performance?
Yes. The Month Analysis page provides detailed time-based insights.
6. Does this dashboard support decision-making?
Yes. Visual insights help management make faster and better decisions.
7. Can I share this dashboard with management?
Yes. You can share the Excel file or export visuals for presentations.
Visit our YouTube channel to learn step-by-step video tutorials