Electricity Project Management in Excel is a structured and practical way to plan, track, analyze, and control electricity-related projects using a centralized Excel dashboard. These projects may include power generation, transmission upgrades, substation construction, grid modernization, renewable energy installations, or utility infrastructure expansion.
Instead of managing project data across scattered spreadsheets, emails, and manual reports, this approach brings budget, cost, progress, risk, and forecasting data into one interactive Excel dashboard. As a result, project teams gain clarity, control, and confidence throughout the project lifecycle.
Moreover, because Excel is widely available and easy to customize, this solution works perfectly for organizations that want strong project visibility without investing in expensive software.
Click to Purchases Electricity Project Management in Excel
Why Do Electricity Projects Need a Dedicated Excel Dashboard?
Electricity projects are complex, capital-intensive, and time-bound. Therefore, even small delays or cost overruns can create serious financial and operational risks.
However, many organizations still rely on basic spreadsheets. As a result, they face several challenges:
-
Limited visibility into budget vs actual performance
-
Poor tracking of cost variance and remaining budget
-
Difficulty monitoring progress across regions or departments
-
Delayed identification of high-risk projects
-
Manual and time-consuming reporting
An Electricity Project Management Dashboard in Excel solves these problems by transforming raw project data into visual, decision-ready insights.
How Does Electricity Project Management in Excel Work?
The working logic of this dashboard remains simple and powerful.
First, project teams enter structured data into a Data Sheet. Then, Excel formulas, Pivot Tables, and calculated fields process this data automatically. Finally, interactive slicers and charts display insights across multiple analytical pages.
Because everything stays within Excel, updates remain fast, transparent, and easy to control.
Click to Purchases Electricity Project Management in Excel
Key Features of the Electricity Project Management Dashboard in Excel
This ready-to-use template includes five analytical pages, along with supporting sheets. Each page focuses on a specific management perspective.
What Is the Role of the Page Navigator?
The Page Navigator, located on the left side, allows users to move seamlessly between dashboard pages.
Because of this feature:
-
Navigation becomes smooth and professional
-
Presentations look structured and clean
-
Users access required insights instantly
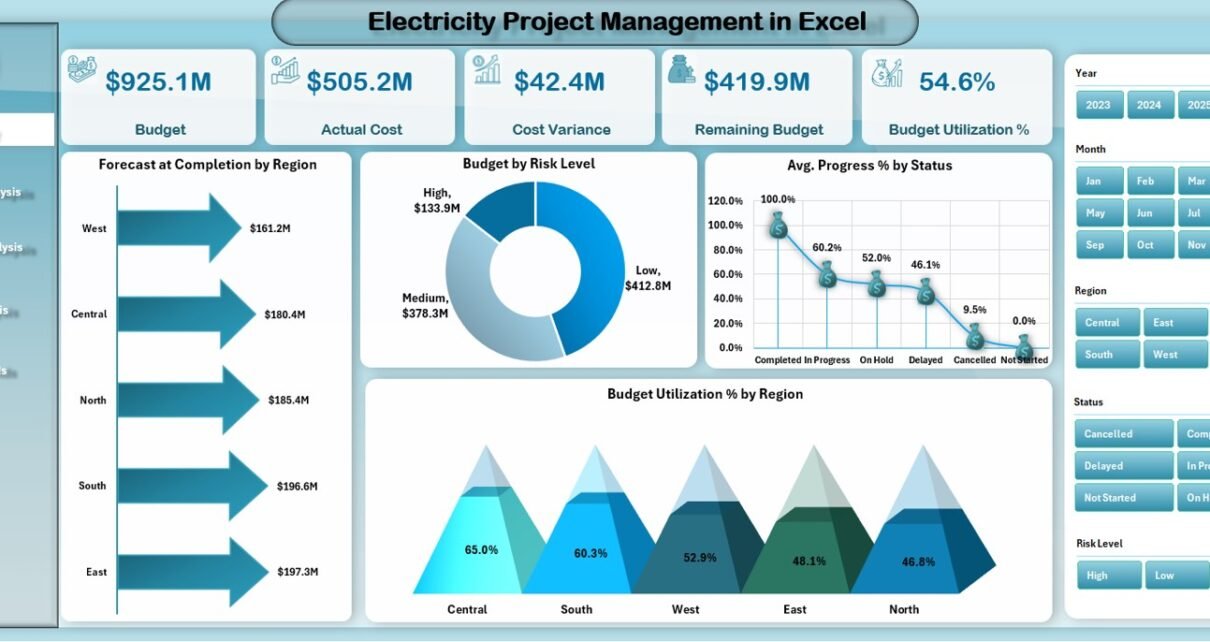
Overview Page – What Does It Show?
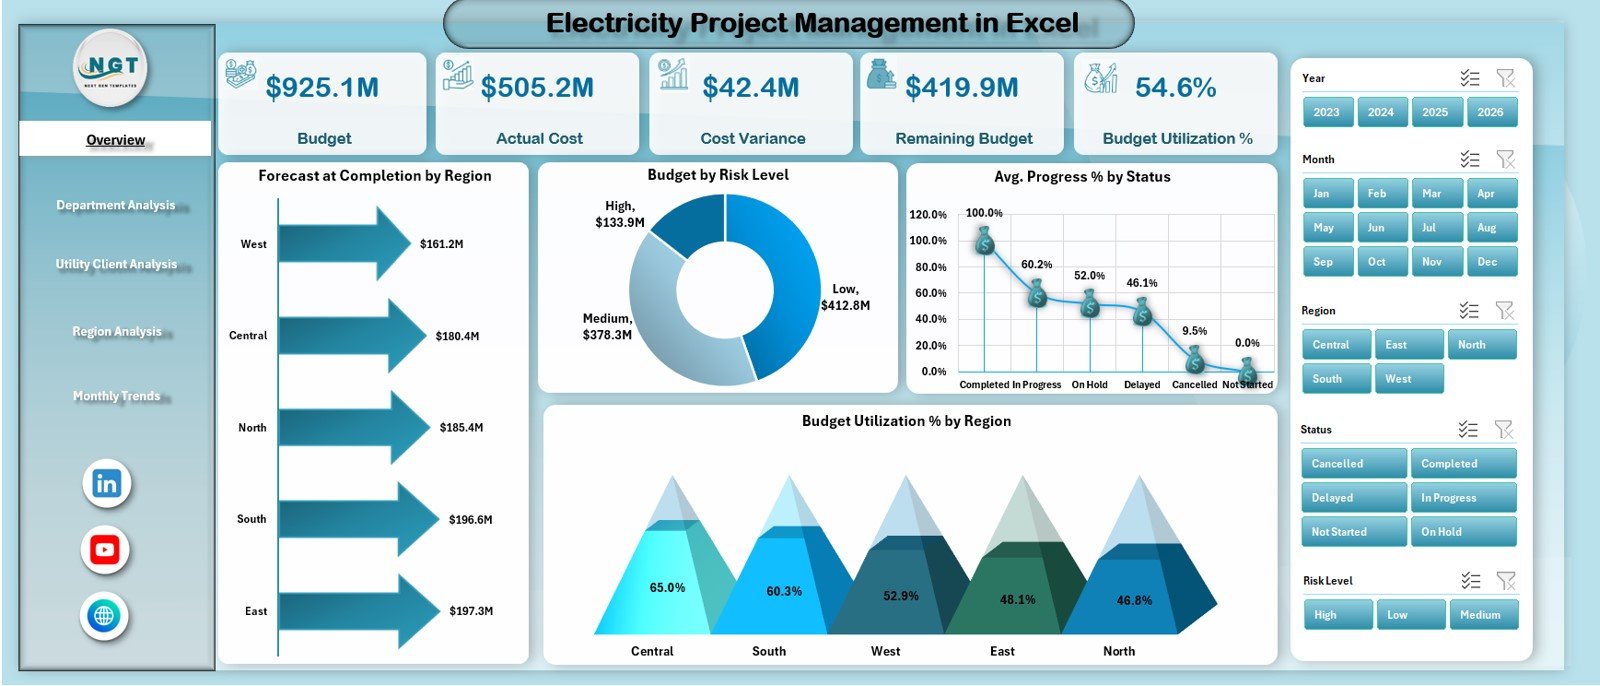
The Overview Page acts as the executive control panel for electricity projects. It provides a high-level snapshot of financial health, progress, and risk.
KPI Cards on the Overview Page
This page includes five KPI cards:
-
Budget – Total approved project budget
-
Actual Cost – Cost incurred to date
-
Cost Variance – Difference between budget and actual cost
-
Remaining Budget – Unused portion of the budget
-
Budget Utilization % – Percentage of budget already consumed
These KPIs help leadership quickly assess project health.
Charts on the Overview Page
In addition, the Overview Page includes four insightful charts:
-
Forecast Completion by Region – Shows projected completion across regions
-
Budget by Risk Level – Highlights budget exposure based on project risk
-
Average Progress % by Status – Tracks progress across project statuses
-
Budget Utilization % by Region – Compares regional budget consumption
As a result, decision-makers can identify problem areas instantly.
Click to Purchases Electricity Project Management in Excel
Department Analysis – How Are Departments Performing?

Electricity projects often involve multiple departments such as engineering, procurement, construction, and operations. Therefore, department-level analysis becomes essential.
The Department Analysis Page focuses on cost, duration, and commitment at the department level.
Charts in Department Analysis
This page includes four charts:
-
Average Planned Duration (Days) by Department
-
Budget by Department
-
Actual Cost by Department
-
Committed Cost by Department
Using this analysis, managers can:
-
Identify departments causing delays
-
Control departmental cost overruns
-
Balance resource allocation more effectively
Utility / Client Analysis – Which Clients Drive Performance?
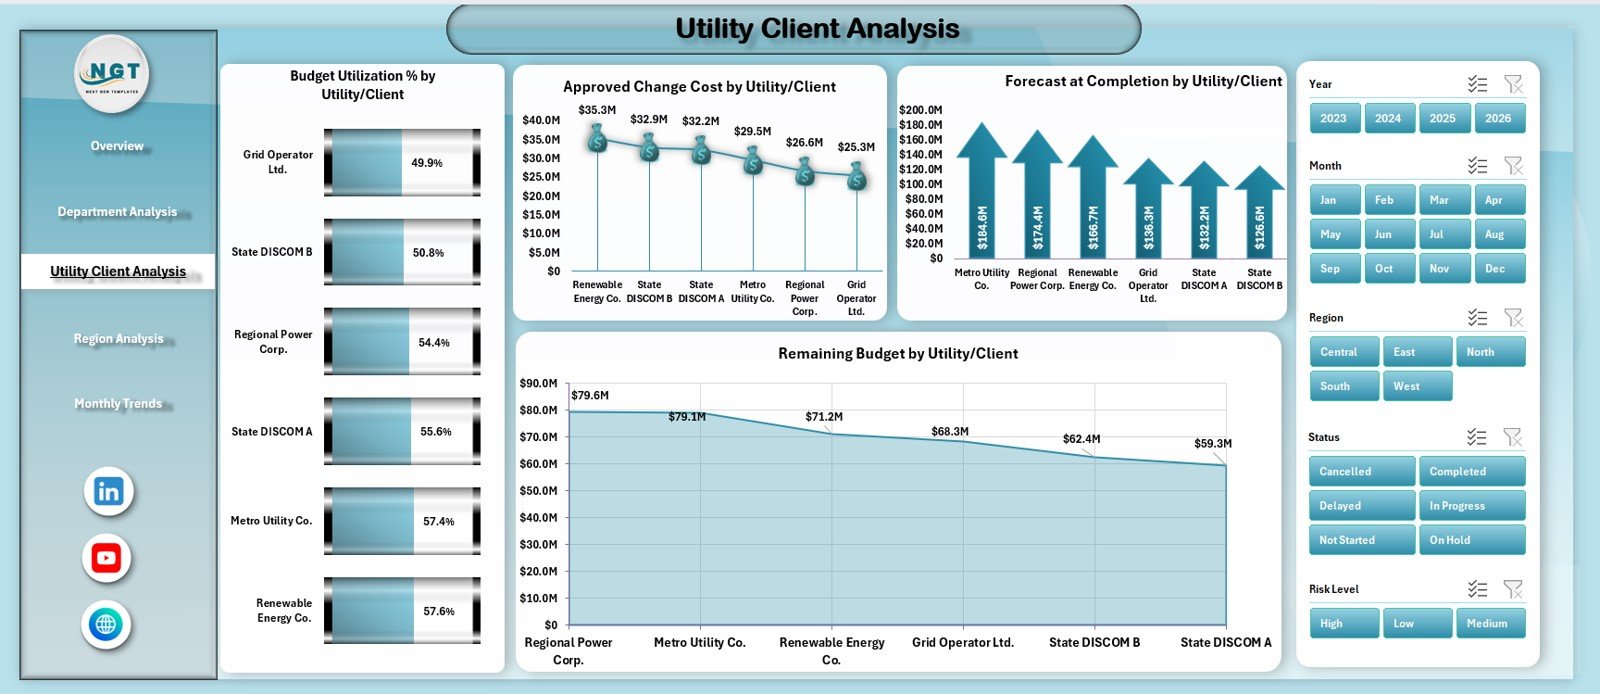
Electricity projects often serve multiple utilities or clients. Therefore, understanding client-wise performance improves accountability and profitability.
The Utility / Client Analysis Page delivers this insight clearly.
Charts in Utility / Client Analysis
This page contains four charts:
-
Budget Utilization % by Utility / Client
-
Approved Change Cost by Utility / Client
-
Forecast Completion by Utility / Client
-
Remaining Budget by Utility / Client
As a result, organizations can:
-
Control frequent change requests
-
Improve client negotiations
-
Prioritize high-value clients
Region Analysis – How Do Projects Perform Across Regions?
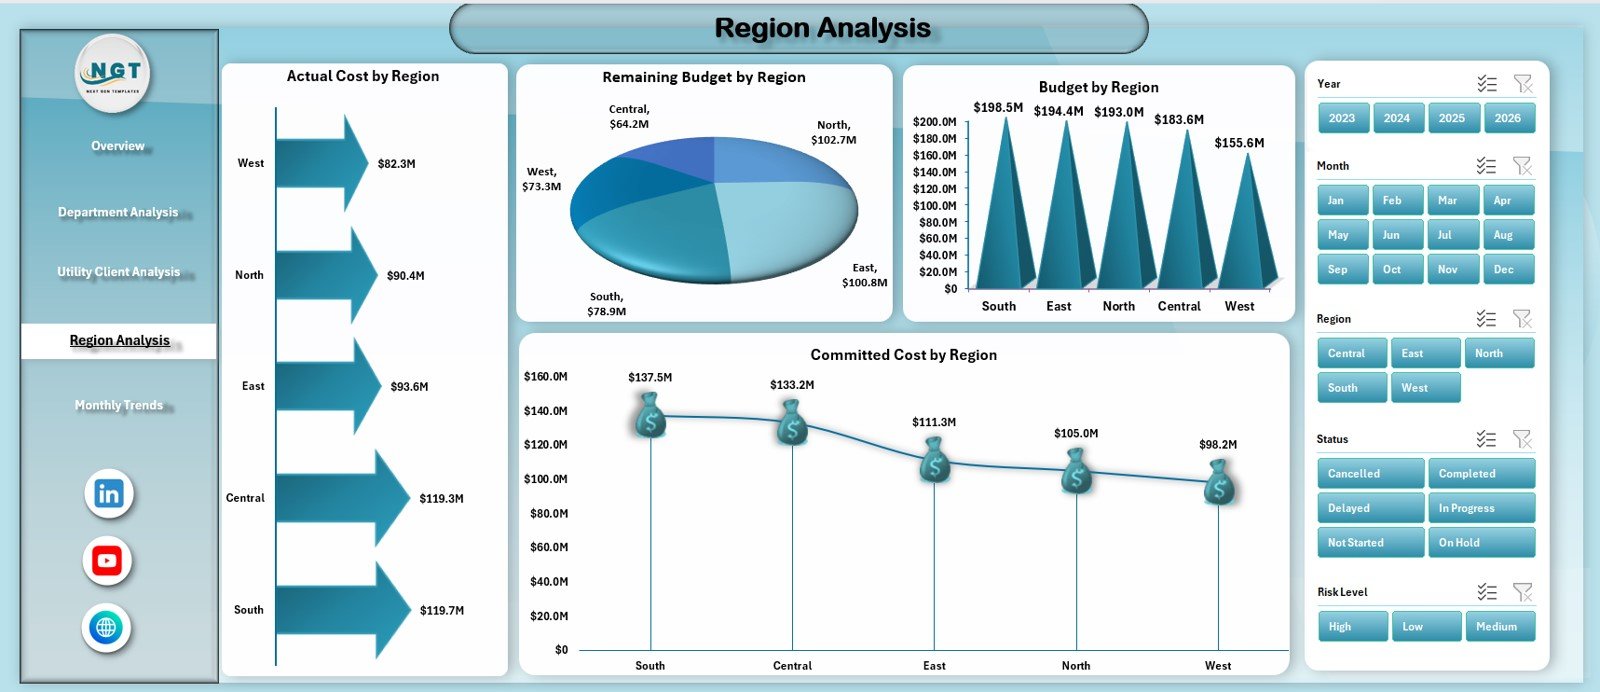
Electricity infrastructure projects often spread across multiple regions. Therefore, geographic visibility plays a crucial role.
The Region Analysis Page focuses on regional cost and commitment.
Charts in Region Analysis
This page includes four charts:
-
Actual Cost by Region
-
Remaining Budget by Region
-
Budget by Region
-
Committed Cost by Region
Because of this analysis, leadership can:
-
Detect regional inefficiencies
-
Compare performance across locations
-
Improve regional planning strategies
Monthly Trends – How Is Performance Changing Over Time?
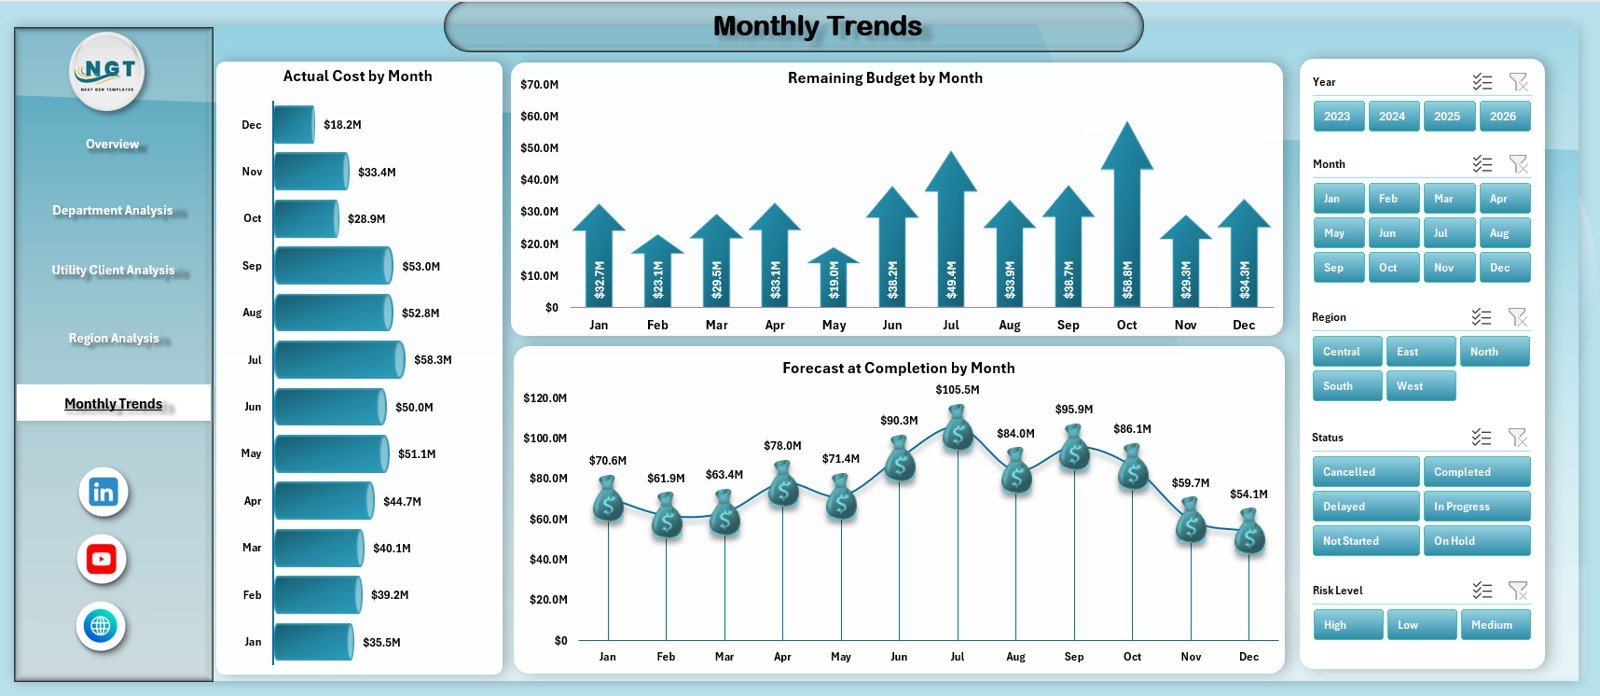
Static numbers never tell the full story. That is why trend analysis matters.
The Monthly Trends Page tracks performance evolution over time.
Charts in Monthly Trends
This page includes three charts:
-
Actual Cost by Month
-
Remaining Budget by Month
-
Forecast at Completion by Month
Through this page, teams can:
-
Identify cost spikes early
-
Monitor forecast accuracy
-
Improve future planning
What Is the Purpose of the Data Sheet?
The Data Sheet acts as the foundation of the entire dashboard. It stores project-level information such as:
-
Project ID and Name
-
Department
-
Region
-
Utility / Client
-
Project Status
-
Risk Level
-
Budget
-
Actual Cost
-
Committed Cost
-
Approved Change Cost
-
Progress %
-
Planned and Actual Dates
Because the data stays structured, the dashboard remains accurate and scalable.
Click to Purchases Electricity Project Management in Excel
What Is the Role of the Support Sheet?
The Support Sheet manages dropdown lists, validation rules, and reference tables. As a result:
-
Data entry stays consistent
-
Errors reduce significantly
-
Analysis quality improves
Advantages of Electricity Project Management in Excel
Using this dashboard delivers multiple strategic advantages.
1. Centralized Project Control
All electricity projects stay visible in one place.
2. Better Budget Management
Budget, actual cost, and variance tracking become clear.
3. Early Risk Identification
Risk-level analysis highlights potential issues quickly.
4. Improved Accountability
Department, region, and client views increase responsibility.
5. Faster Reporting
Automated visuals replace manual reporting work.
6. Cost-Effective Solution
Excel eliminates expensive project management software costs.
Opportunities for Improvement in Electricity Project Management
Although the dashboard delivers strong value, organizations can enhance it further.
-
Add project milestone tracking
-
Introduce schedule variance calculations
-
Include earned value management metrics
-
Automate data updates using Power Query
-
Add conditional alerts for budget overruns
These enhancements can elevate project maturity significantly.
Click to Purchases Electricity Project Management in Excel
Best Practices for Electricity Project Management in Excel
Following best practices ensures consistent success.
Maintain Clean and Validated Data
Use dropdowns and validations for key fields.
Update the Dashboard Regularly
Weekly or monthly updates keep insights relevant.
Focus on Cost Variance Trends
Do not wait for overruns to grow.
Monitor High-Risk Projects Closely
Prioritize projects with high risk levels.
Protect Critical Formulas
Lock calculation cells to prevent accidental changes.
Train Project Teams
Ensure teams understand KPIs and slicers clearly.
Who Can Use Electricity Project Management in Excel?
This dashboard fits many stakeholders:
-
Electricity utilities
-
Power generation companies
-
EPC contractors
-
Energy infrastructure firms
-
Project managers and PMOs
-
Finance and planning teams
Conclusion – Why Electricity Project Management in Excel Matters
Electricity projects demand precision, transparency, and strong financial control. However, manual tracking often creates blind spots and delays.
The Electricity Project Management Dashboard in Excel transforms raw project data into clear, visual, and actionable insights. Because it combines budget tracking, progress monitoring, risk analysis, and trend reporting in one Excel file, organizations gain confidence and control.
In short, this dashboard turns Excel into a powerful project management and decision-support tool.
Click to Purchases Electricity Project Management in Excel
Frequently Asked Questions (FAQs)
What is Electricity Project Management in Excel?
It is an Excel-based system to track budgets, costs, progress, risks, and trends for electricity projects.
Do I need advanced Excel skills to use this dashboard?
No. Basic Excel knowledge is enough to operate it effectively.
Can I customize the dashboard?
Yes. You can modify KPIs, charts, and calculations easily.
How many projects can this dashboard handle?
Excel supports thousands of records, making it highly scalable.
Is this dashboard suitable for senior management reporting?
Yes. The overview and visual KPIs make it ideal for executives.
Can this dashboard support audits and reviews?
Yes. Structured data and clear calculations improve audit readiness.
Click to Purchases Electricity Project Management in Excel
Visit our YouTube channel to learn step-by-step video tutorials