Managing clinic purchasing is never simple. Clinics must track vendors, departments, item categories, taxes, unit costs, pending orders, and monthly spending at the same time. Moreover, healthcare purchasing decisions directly affect patient care, compliance, and profitability. Therefore, clinics need a clear, structured, and reliable way to monitor purchasing performance.
That is exactly where a Clinic Purchasing Dashboard in Excel becomes a powerful and practical solution.
In this detailed guide, you will learn what a Clinic Purchasing Dashboard in Excel is, why it matters, how it works, its complete dashboard structure, advantages, opportunities for improvement, best practices, and frequently asked questions. Additionally, this article uses simple language, strong transition words, and practical explanations so you can apply everything with confidence.
Click to Purchases Clinic Purchasing Dashboard in Excel
What Is a Clinic Purchasing Dashboard in Excel?
A Clinic Purchasing Dashboard in Excel is a ready-to-use analytical and reporting tool that converts raw clinic procurement data into meaningful insights using charts, KPIs, and summaries.
Instead of reviewing long Excel tables or multiple purchase reports, you can track purchasing performance from a single interactive dashboard. As a result, clinic administrators, procurement managers, and finance teams gain instant visibility into costs, vendors, departments, and trends.
This dashboard focuses on:
-
Total purchasing cost
-
Net cost after taxes
-
Unit cost analysis
-
Pending and ordered purchase percentages
-
Vendor and department-level performance
-
Monthly purchasing trends
Therefore, decision-makers can act faster and smarter.
Why Does a Clinic Purchasing Dashboard in Excel Matter?
Clinic purchasing involves strict budgets and compliance requirements. However, many clinics still rely on manual spreadsheets and static reports. Consequently, they struggle to identify cost overruns, vendor inefficiencies, or delayed orders.
A Clinic Purchasing Dashboard in Excel solves these challenges because:
-
It centralizes purchasing data in one place
-
It highlights cost patterns instantly
-
It improves transparency across departments
-
It supports budget control and planning
Moreover, Excel remains familiar and flexible, so teams can adopt the dashboard without expensive software or long training sessions.
How Does a Clinic Purchasing Dashboard in Excel Work?
The dashboard works by connecting structured purchasing data to pivot tables and pivot charts. Then, Excel visuals summarize the data dynamically.
Here is how the process flows:
-
Purchasing data gets stored in a structured Data Sheet
-
Calculations and summaries get generated automatically
-
Charts update instantly when data changes
-
Users navigate pages using a built-in page navigator
As a result, users explore data from multiple angles without writing formulas again and again.
What Are the Key Features of the Clinic Purchasing Dashboard in Excel?
This dashboard comes as a ready-to-use Excel desktop application with a clean layout and intuitive navigation.
Page Navigator for Easy Access
A page navigator appears on the left side of the dashboard. Therefore, users can move quickly between analytical pages without scrolling or searching.
Five Dedicated Analytical Pages
The dashboard includes five structured pages, each designed for a specific analysis purpose.
Click to Purchases Clinic Purchasing Dashboard in Excel
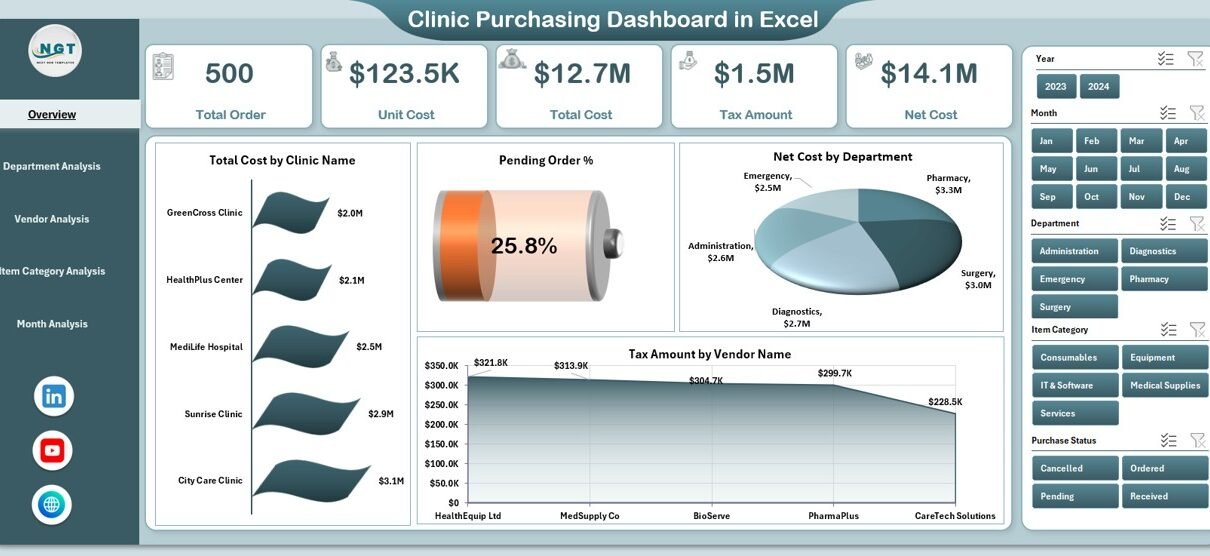
What Does the Overview Page Show in the Clinic Purchasing Dashboard?
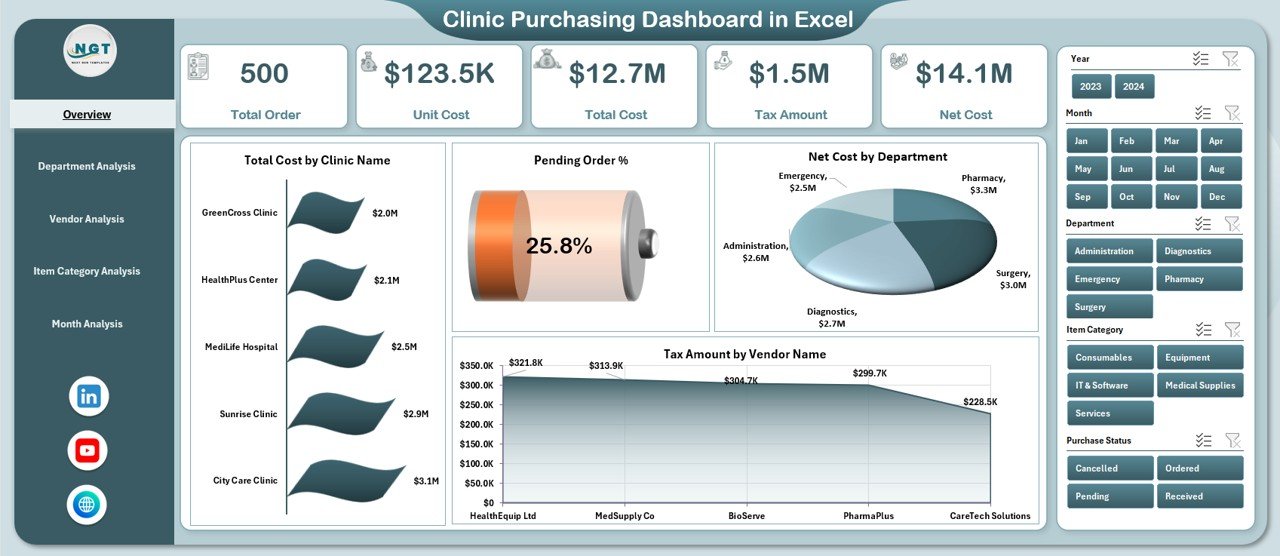
The Overview Page acts as the control center of the dashboard. It provides a high-level snapshot of clinic purchasing performance.
Key Highlights on the Overview Page
-
Four KPI Cards showing critical purchasing metrics
-
Four Interactive Charts for quick insights
Charts on the Overview Page
-
Total Cost by Clinic Name
-
Pending Order % by Clinic Name
-
Net Cost by Department
-
Tax Amount by Vendor Name
Because this page summarizes performance at a glance, management teams can identify red flags immediately.
How Does the Department Analysis Page Help Clinics?
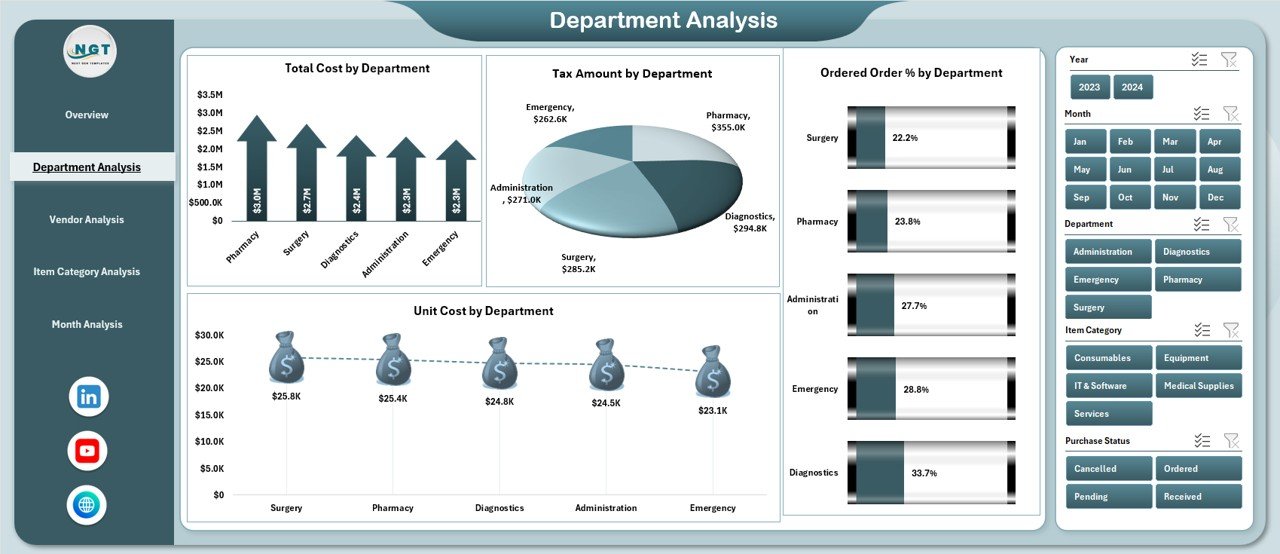
The Department Analysis Page breaks down purchasing performance department-wise. Therefore, clinics can compare internal consumption and cost efficiency.
Charts on the Department Analysis Page
-
Total Cost by Department
-
Tax Amount by Department
-
Ordered Order % by Department
-
Unit Cost by Department
As a result, administrators can detect departments with high costs, excessive taxes, or inefficient ordering patterns.
What Insights Does the Vendor Analysis Page Provide?
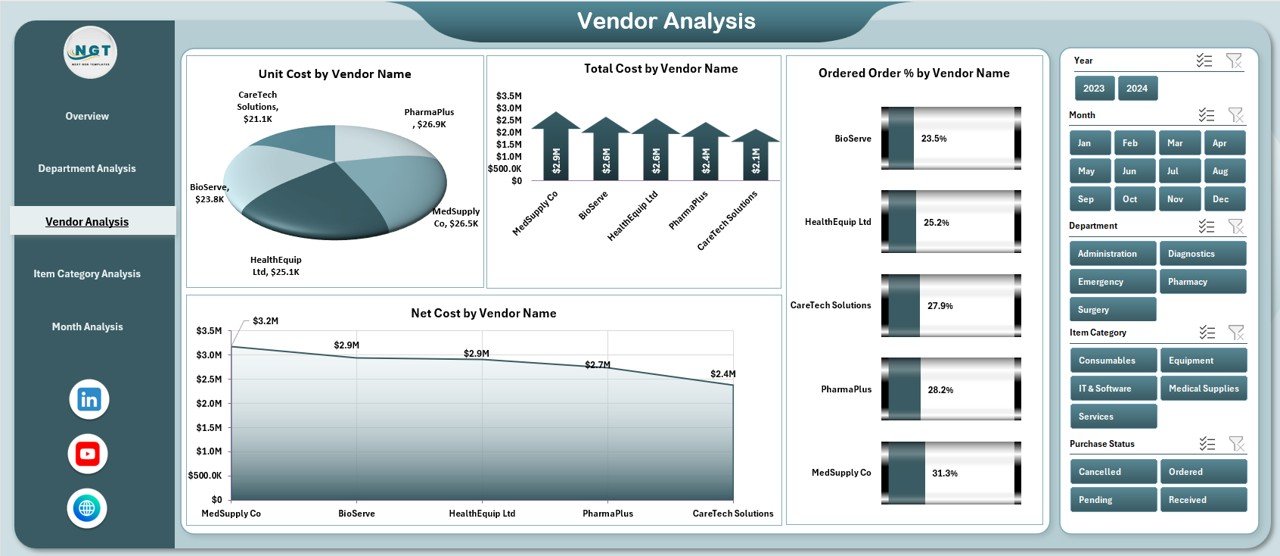
The Vendor Analysis Page focuses on supplier performance. Since clinics depend heavily on vendors, this analysis becomes extremely important.
Charts on the Vendor Analysis Page
-
Total Cost by Vendor Name
-
Unit Cost by Vendor Name
-
Ordered Order % by Vendor Name
-
Net Cost by Vendor Name
Therefore, clinics can identify high-cost vendors, negotiate better pricing, or reduce dependency on inefficient suppliers.
Why Is Item Category Analysis Important in Clinic Purchasing?
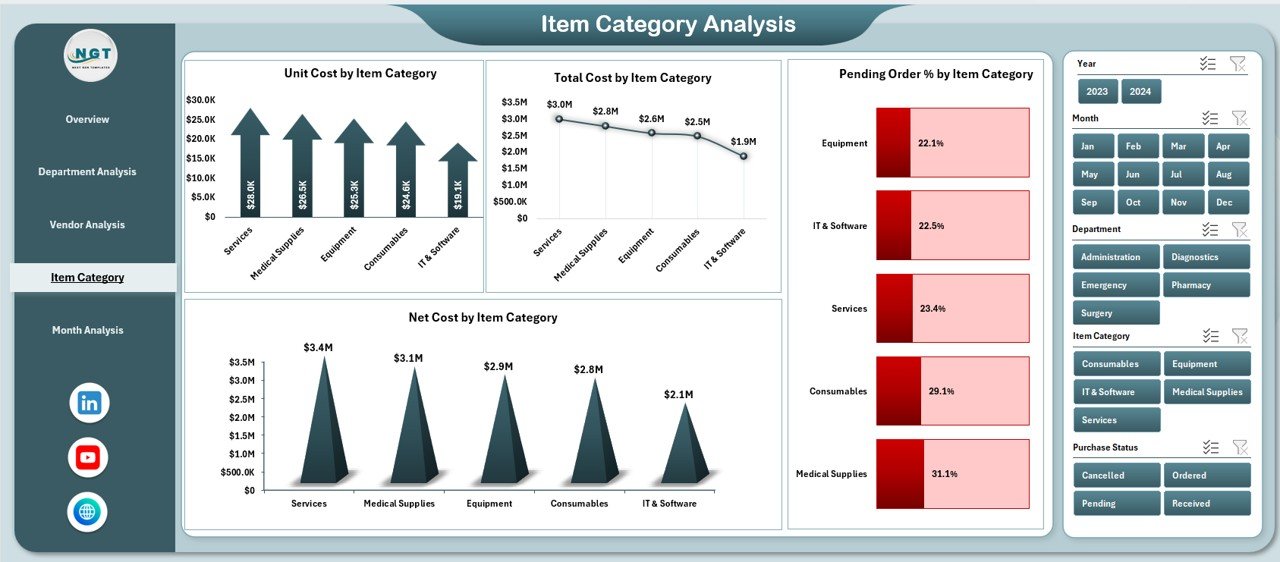
Different item categories contribute differently to total spending. Hence, category-level insights help control procurement costs effectively.
Charts on the Item Category Analysis Page
-
Unit Cost by Item Category
-
Total Cost by Item Category
-
Pending Order % by Item Category
-
Net Cost by Item Category
Because of this analysis, clinics can optimize inventory planning and reduce waste.
How Does the Month Analysis Page Support Trend Tracking?
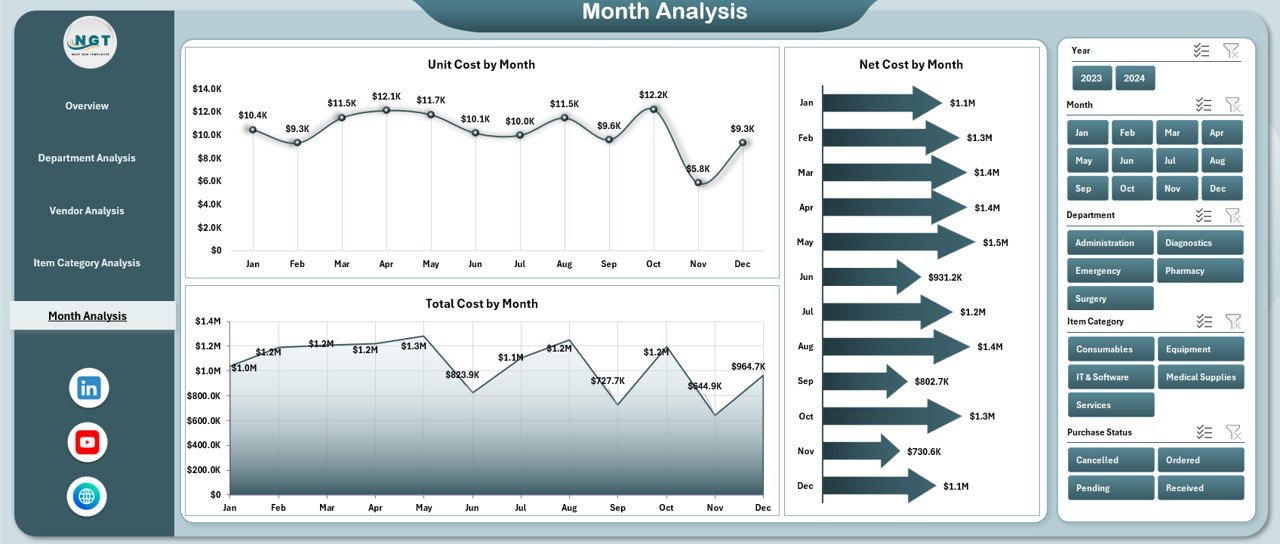
The Month Analysis Page tracks purchasing trends over time. Consequently, clinics can identify seasonal patterns and plan budgets accurately.
Charts on the Month Analysis Page
-
Unit Cost by Month
-
Net Cost by Month
-
Total Cost by Month
Therefore, finance teams can forecast future expenses and adjust procurement strategies.
Click to Purchases Clinic Purchasing Dashboard in Excel
What Are the Supporting Sheets in the Clinic Purchasing Dashboard?
Data Sheet
The Data Sheet stores all raw purchasing data, such as:
-
Purchase date
-
Clinic name
-
Department
-
Vendor name
-
Item category
-
Quantity
-
Unit cost
-
Tax amount
-
Net cost
-
Order status
Because the data remains structured, pivot tables update automatically.
Support Sheet
The Support Sheet manages background calculations, mappings, or helper tables required for smooth dashboard functionality.
Advantages of Clinic Purchasing Dashboard in Excel
A Clinic Purchasing Dashboard in Excel offers several powerful advantages for healthcare organizations.
✔ Centralized Purchasing Visibility
You can monitor all purchasing data from one dashboard instead of multiple files.
✔ Improved Cost Control
You can track total, unit, and net costs easily and reduce unnecessary spending.
✔ Better Vendor Management
You can compare vendor performance and negotiate better contracts.
✔ Faster Decision-Making
Visual insights replace manual analysis, so decisions become quicker.
✔ Budget Planning Support
Monthly trends help clinics forecast and manage budgets accurately.
✔ Excel-Based Flexibility
You can customize the dashboard without complex IT support.
Opportunities for Improvement in Clinic Purchasing Dashboards
Although the dashboard already delivers strong insights, clinics can enhance it further.
-
Add approval status tracking for purchase orders
-
Include inventory turnover metrics
-
Integrate budget vs actual analysis
-
Add alerts for high pending orders
-
Connect the dashboard with ERP systems
Therefore, clinics can evolve the dashboard as their purchasing process grows.
Best Practices for the Clinic Purchasing Dashboard in Excel
Following best practices ensures long-term value from the dashboard.
Maintain Clean Data
Always keep the data sheet accurate and structured. Clean data improves dashboard reliability.
Update Data Regularly
Refresh purchasing data weekly or monthly to maintain relevance.
Use Consistent Naming
Standardize department, vendor, and category names to avoid confusion.
Monitor KPIs Frequently
Review key metrics regularly instead of waiting for month-end reports.
Train Users Properly
Educate staff on how to navigate and interpret dashboard insights.
Protect the File
Use Excel protection features to prevent accidental data changes.
Who Should Use a Clinic Purchasing Dashboard in Excel?
This dashboard benefits multiple roles:
-
Clinic administrators
-
Procurement managers
-
Finance and accounts teams
-
Operations managers
-
Healthcare consultants
Because of its simplicity, even non-technical users can use it effectively.
How Does This Dashboard Improve Clinic Financial Health?
Click to Purchases Clinic Purchasing Dashboard in Excel
The dashboard improves financial health by:
-
Reducing procurement inefficiencies
-
Highlighting unnecessary costs
-
Improving vendor negotiations
-
Supporting accurate budgeting
As a result, clinics can allocate funds more effectively toward patient care.
Conclusion: Why Clinics Should Use a Purchasing Dashboard in Excel
A Clinic Purchasing Dashboard in Excel transforms raw procurement data into actionable insights. Instead of relying on static reports, clinics gain real-time visibility into costs, vendors, departments, and trends. Moreover, Excel keeps the solution affordable, flexible, and easy to use.
By implementing this dashboard, clinics improve cost control, strengthen vendor management, and support smarter purchasing decisions. Therefore, this dashboard becomes an essential tool for modern healthcare operations.
Frequently Asked Questions About Clinic Purchasing Dashboard in Excel
1. What data do I need for a Clinic Purchasing Dashboard in Excel?
You need purchase date, clinic name, department, vendor, item category, quantity, unit cost, tax amount, net cost, and order status.
2. Can small clinics use this dashboard effectively?
Yes, small clinics benefit greatly because the dashboard simplifies purchasing analysis without expensive software.
3. Does the dashboard update automatically?
Yes, pivot charts update automatically when you refresh the data.
4. Can I customize the dashboard layout?
Yes, Excel allows full customization based on clinic requirements.
5. How often should clinics update purchasing data?
Clinics should update data monthly or weekly for better insights.
6. Is Excel secure for purchasing data?
Yes, Excel supports password protection and sheet-level security.
7. Can this dashboard support audits?
Yes, structured data and clear visuals support audit and compliance reviews.
Visit our YouTube channel to learn step-by-step video tutorials