Port Contract involve large contracts, high capital investment, multiple vendors, strict timelines, and continuous operational risk. Because of this complexity, port authorities, logistics companies, and infrastructure operators need a strong monitoring system. However, many teams still rely on scattered Excel files, emails, and manual reports. As a result, decision-making slows down and risks increase.
A Port Contract Management Dashboard in Excel Dashboard in Excel solves this challenge effectively. It is a ready-to-use dashboard that consolidates contract performance, financial metrics, vendor efficiency, and project trends into a single interactive view. With this dashboard, port managers gain clarity, control, and confidence while managing complex port projects.
In this article, you will learn how this dashboard works, what insights each section provides, and how it helps port organizations improve project performance and profitability.
What Is a Port Contract Management Dashboard in Excel?
Click to Buy Port Contract Management Dashboard in Excel
A Port Project Management Dashboard is a centralized reporting tool built in Excel that tracks port-related projects, contracts, costs, revenues, and performance indicators. It converts raw project data into meaningful visuals and KPIs that help stakeholders monitor progress and risks in real time.
Because it runs in Excel, this dashboard remains:
-
Easy to use
-
Cost-effective
-
Flexible and customizable
-
Familiar for most users
-
Suitable for offline and online use
This dashboard supports project managers, finance teams, contract managers, and senior leadership in making data-driven decisions.
Key Features of the Port Contract Management Dashboard in Excel
This dashboard includes multiple analytical sections, each designed to highlight a specific aspect of port project performance.
Let’s explore them one by one.
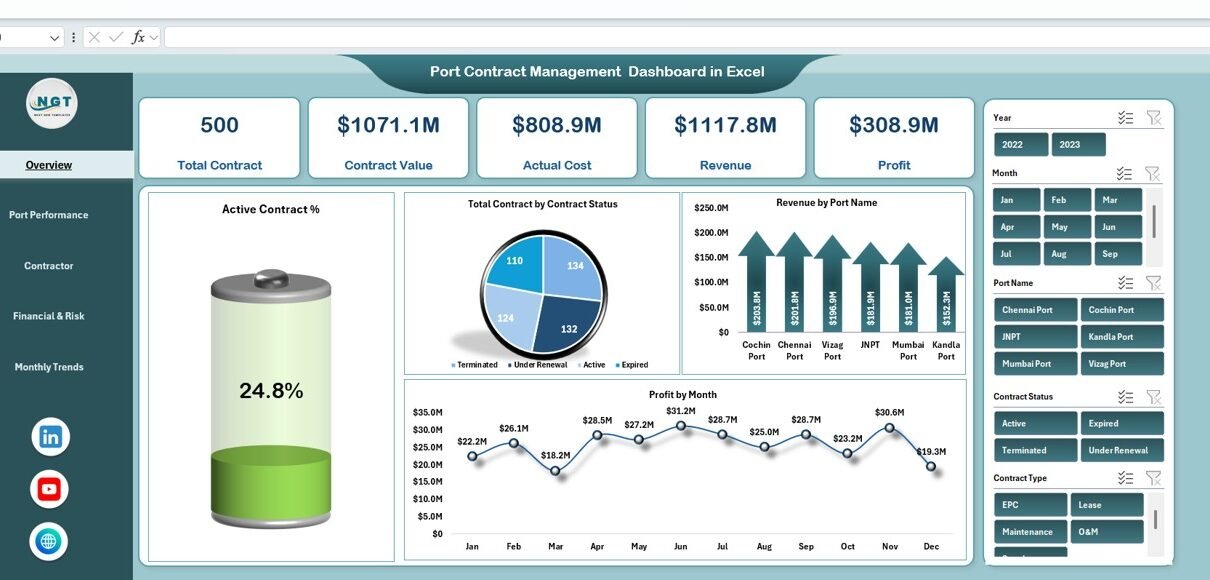
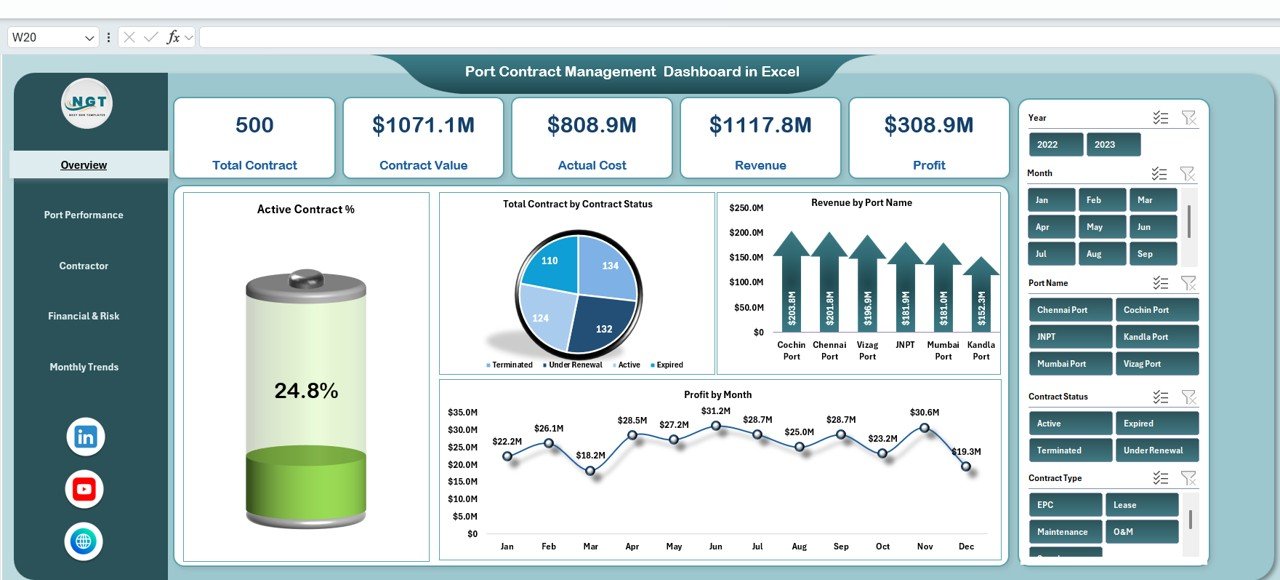
Overview Sheet Tab – Executive Summary
The Overview sheet acts as the control center of the dashboard. It provides a quick snapshot of overall port project health using KPI cards and charts.
🔹 KPI Cards Included
-
Total Contract – Number of active and managed contracts
-
Contract Value – Total value of all contracts (USD)
-
Actual Cost – Actual cost incurred so far
-
Revenue – Revenue generated from port projects
-
Profit – Net profit earned
These cards help leadership understand performance within seconds.
Charts on the Overview Sheet
✅ Active Contract %
Shows the percentage of currently active contracts compared to total contracts.
✅ Total Contract by Contract Status
Displays contract distribution across statuses such as Active, Closed, Under Renewal, or Completed.
✅ Revenue by Port Name
Helps compare revenue contribution from different ports.
✅ Profit by Month
Shows monthly profit trends to identify high-performing and weak periods.
Together, these visuals provide immediate clarity on contract performance and financial outcomes.
Click to Buy Port Contract Management Dashboard in Excel
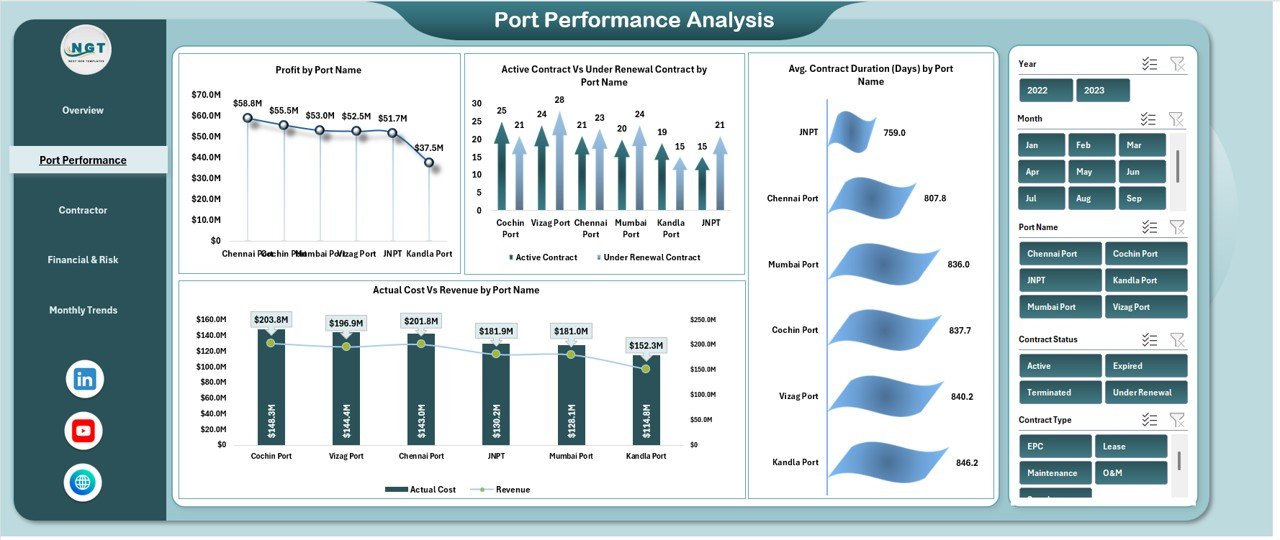
⚓ Port Performance Analysis
This section focuses on port-wise Contract efficiency and profitability.
📊 Charts Included
🔹 Profit by Port Name
Identifies which ports generate higher profit.
🔹 Active Contract vs Under Renewal Contract by Port Name
Helps monitor contract lifecycle and renewal risks.
🔹 Average Contract Duration (Days) by Port Name
Shows how long contracts typically run at each port.
🔹 Actual Cost vs Revenue by Port Name
Highlights cost efficiency and revenue realization across ports.
This analysis helps management prioritize high-performing ports and address underperforming ones.
Click to Buy Port Contract Management Dashboard in Excel
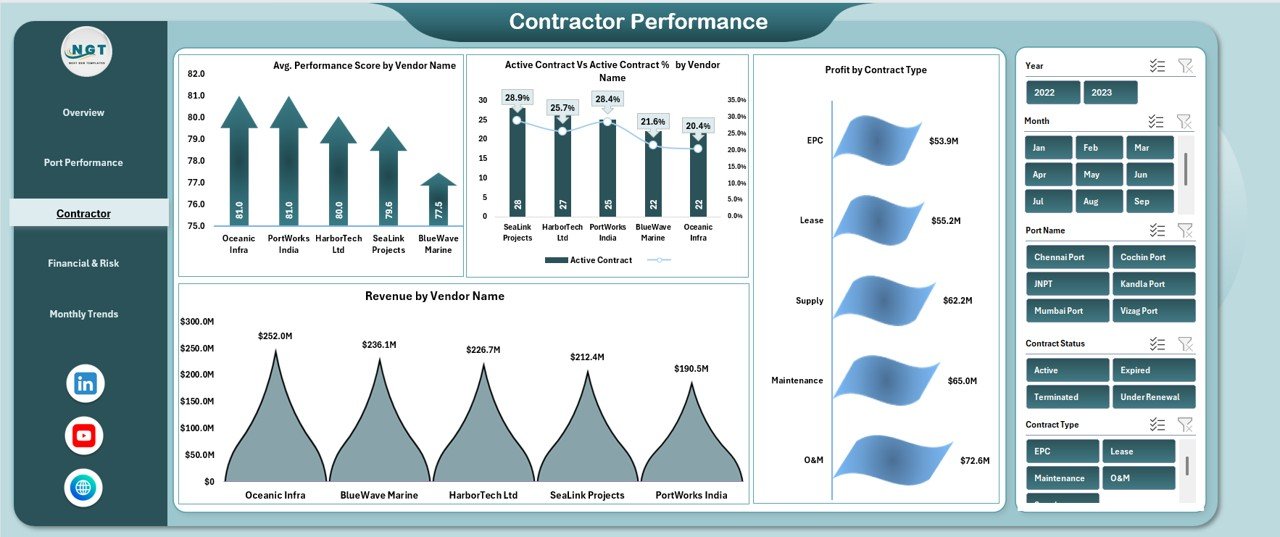
🏗️ Contractor Performance Analysis
Vendors and contractors play a critical role in port projects. This section evaluates their effectiveness.
📊 Charts Included
🔹 Average Performance Score by Vendor Name
Measures contractor reliability and service quality.
🔹 Active Contract vs Active Contract % by Vendor Name
Shows vendor engagement levels.
🔹 Profit by Contract Type
Analyzes profitability across different contract types.
🔹 Revenue by Vendor Name
Identifies top revenue-generating vendors.
This analysis supports better vendor selection, contract renewal decisions, and performance improvement plans.
Click to Buy Port Contract Management Dashboard in Excel
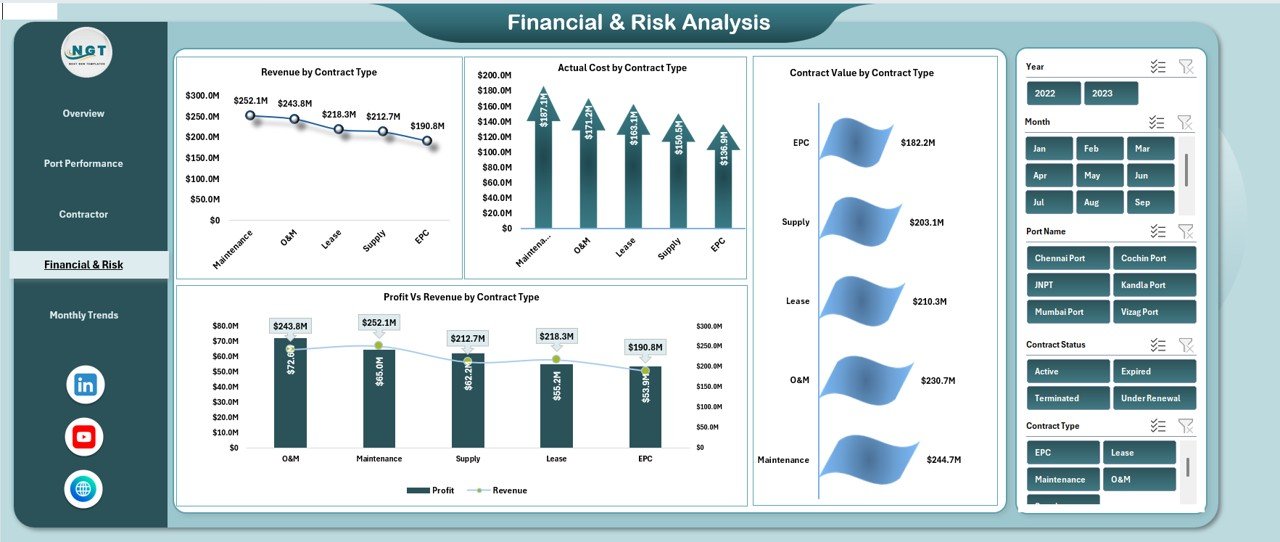
💰 Financial & Risk Analysis
Financial control remains a key priority in port Contract management. This section focuses on cost, revenue, and risk exposure.
📊 Charts Included
🔹 Revenue by Contract Type
Shows which contract types generate the most revenue.
🔹 Actual Cost by Contract Type
Highlights cost-intensive contract categories.
🔹 Contract Value by Contract Type
Displays capital exposure by contract classification.
🔹 Profit vs Revenue by Contract Type
Helps evaluate margin efficiency and financial risk.
This section supports financial planning, budgeting, and risk mitigation.
Click to Buy Port Contract Management Dashboard in Excel
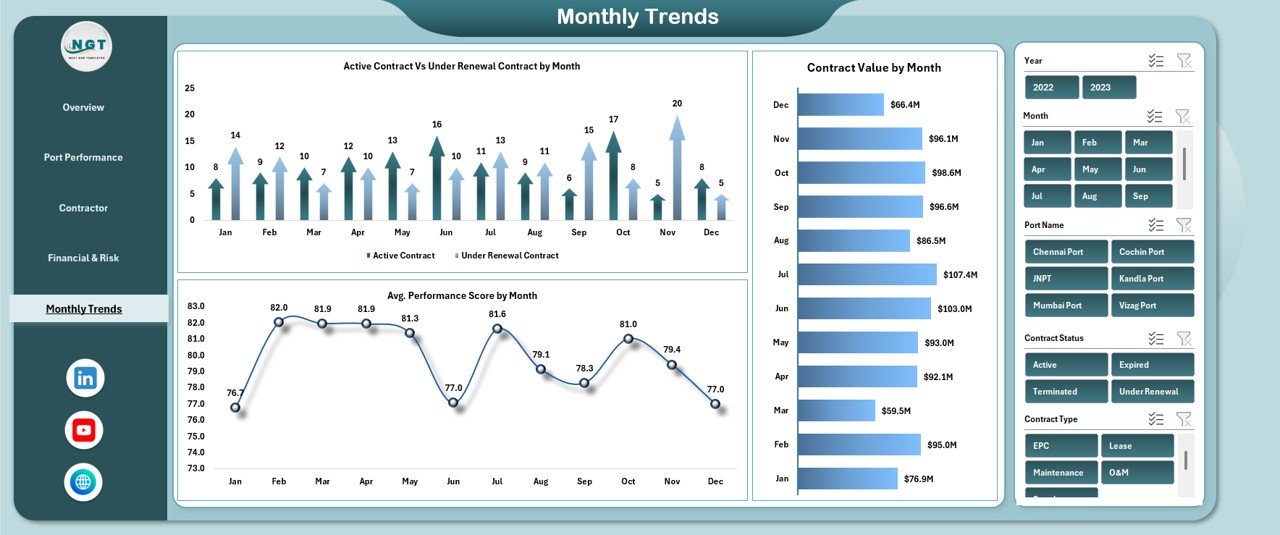
Monthly Trends Analysis
Port Contracts evolve over time. Monthly trend analysis helps track progress and performance changes.
📊 Charts Included
🔹 Active Contract vs Under Renewal Contract by Month
Tracks contract lifecycle changes over time.
🔹 Contract Value by Month
Shows monthly contract value fluctuations.
🔹 Average Performance Score by Month
Highlights improvements or declines in execution quality.
These trends help teams anticipate risks and plan future actions proactively.
Click to Buy Port Contract Management Dashboard in Excel
Advantages of Using a Port Contract Management Dashboard in Excel
Using this dashboard delivers multiple benefits:
Centralized project visibility
All key metrics appear in one place.
Faster decision-making
Leaders analyze data instantly without manual reports.
Improved financial control
Costs, revenue, and profit stay transparent.
Better vendor management
Performance insights improve vendor accountability.
Reduced project risk
Early detection of delays, cost overruns, and renewal risks.
Easy customization
Teams adapt charts and KPIs to their needs.
Opportunities for Improvement in Port Contract Management Dashboard in Excel
Although this dashboard is powerful, organizations can enhance it further by:
-
Adding forecasted revenue and cost projections
-
Integrating risk scoring models
-
Including contract SLA compliance metrics
-
Automating data updates using Power Query or VBA
-
Adding port-wise resource utilization metrics
These enhancements strengthen long-term planning and risk management.
Best Practices for Using the Dashboard
Click to Buy Port Contract Management Dashboard in Excel
To maximize value, follow these best practices:
-
Update project and financial data regularly
-
Maintain consistent contract status definitions
-
Review dashboard monthly with stakeholders
-
Compare actual cost vs revenue frequently
-
Track vendor performance continuously
-
Use trend analysis to support future planning
Consistent usage turns the dashboard into a strategic asset.
Conclusion
A Port Contract Management Dashboard in Excel gives port authorities and project teams complete control over contracts, costs, revenue, and performance. It transforms complex project data into clear insights that support smarter decisions. Because it is ready to use, easy to understand, and highly visual, it becomes an essential tool for managing modern port projects.
By using this dashboard, organizations improve transparency, reduce financial risk, strengthen vendor management, and deliver port projects more efficiently.
Click to Buy Port Contract Management Dashboard in Excel
Visit our YouTube channel to learn step-by-step video tutorials
Watch the step-by-step video tutorial:
Click to Buy Port Contract Management Dashboard in Excel