Managing purchasing operations in a port environment requires speed, accuracy, and full visibility. Since ports handle high-volume procurement activities, multiple vendors, and strict compliance requirements, decision-makers need a reliable system to track performance. That is exactly where the Port Purchasing KPI Dashboard in Power BI plays a vital role.
This detailed guide explains everything about the Port Purchasing KPI Dashboard in Power BI, including its features, structure, advantages, best practices, and real-world usage. Moreover, this article uses clear language, simple explanations, and practical examples so anyone can understand and implement it easily.
What Is a Port Purchasing KPI Dashboard in Power BI?
A Port Purchasing KPI Dashboard in Power BI is an interactive reporting solution designed to track, analyze, and improve purchasing performance in port operations.
Instead of managing multiple Excel sheets and manual reports, this dashboard brings all purchasing KPIs into one centralized and visual platform. As a result, procurement teams can monitor performance, compare targets, and identify gaps instantly.
Moreover, the dashboard uses Excel as a data source, which makes it easy to maintain and update without technical complexity.
Why Do Ports Need a Purchasing KPI Dashboard?
Ports manage large-scale procurement activities every day. Therefore, without a proper tracking system, purchasing teams often face delays, cost overruns, and poor visibility.
Here is why a Purchasing KPI Dashboard becomes essential:
- It improves visibility across all procurement KPIs
- It reduces manual reporting efforts
- It improves decision-making through real-time insights
- It helps track targets versus actual performance
- It supports data-driven procurement strategies
As a result, port authorities gain full control over purchasing efficiency.
What Does the Port Purchasing KPI Dashboard Include?
The Port Purchasing KPI Dashboard in Power BI comes with a well-structured layout and three powerful pages. Each page serves a specific purpose and improves performance monitoring.
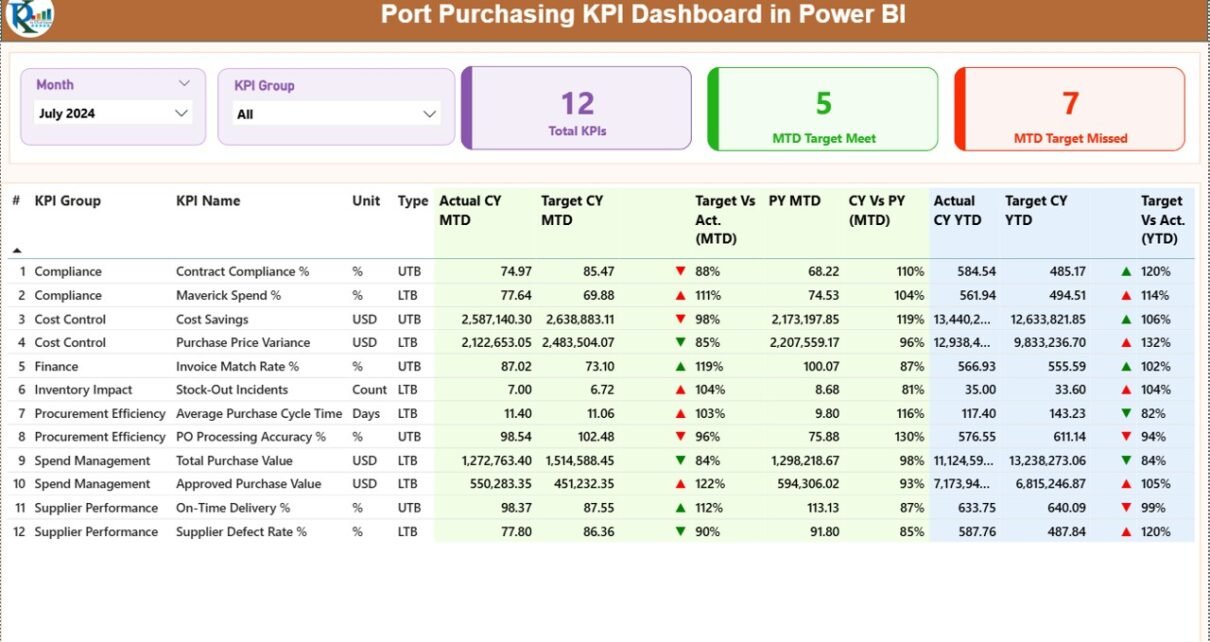
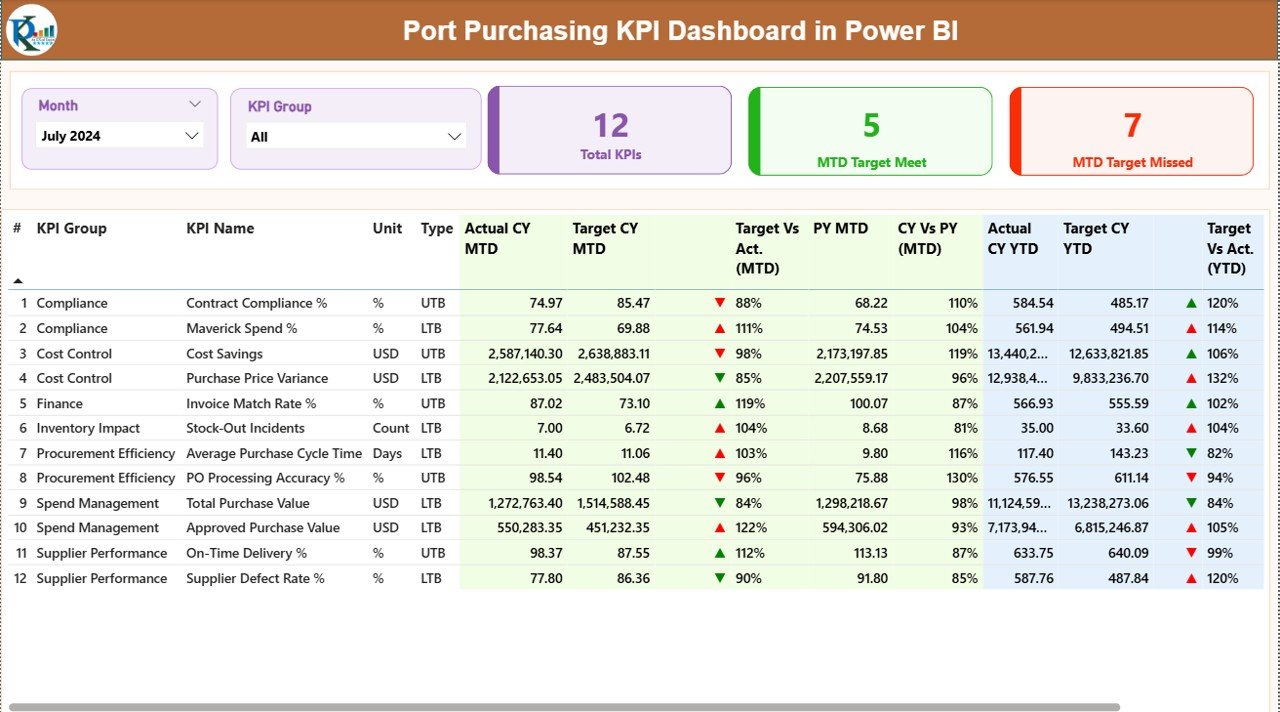
Summary Page – Centralized KPI Overview
The Summary Page works as the main dashboard view. It provides a complete snapshot of purchasing performance at a glance.
Key Elements of the Summary Page
Month & KPI Group Slicer
- Allows users to filter data by month
- Helps analyze performance by KPI category
KPI Summary Cards
- Total KPI Count
- MTD Target Met
- MTD Target Missed
These cards instantly show how purchasing performs against defined goals.
Detailed KPI Table
The dashboard displays a detailed table with the following fields:
- KPI Number – Unique sequence number
- KPI Group – Category of KPI
- KPI Name – Name of the performance indicator
- Unit – Measurement unit
Type –
LTB (Lower the Better)
UTB (Upper the Better)
Performance Metrics Included
MTD (Month-to-Date) Metrics
- Actual CY MTD – Current year actual value
- Target CY MTD – Current year target
- MTD Icon – ▲ or ▼ indicator showing performance
- Target vs Actual (MTD) – Actual ÷ Target
- PY MTD – Previous year MTD
- CY vs PY (MTD) – Growth comparison
YTD (Year-to-Date) Metrics
- Actual CY YTD
- Target CY YTD
- YTD Icon – Performance indicator
- Target vs Actual (YTD)
- PY YTD
- CY vs PY (YTD)
As a result, users can easily compare monthly and yearly performance trends.
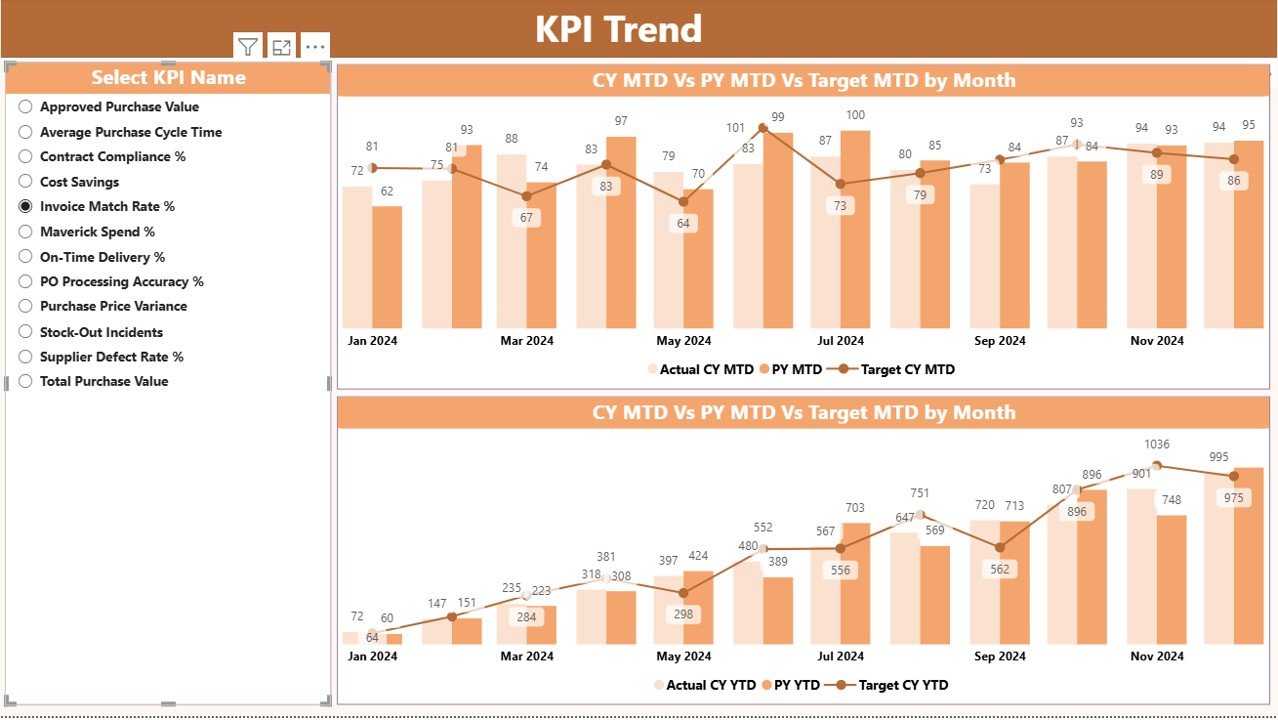
KPI Trend Page – Performance Visualization
The KPI Trend Page helps users analyze trends visually.
What This Page Shows
Two interactive combo charts
Comparison of:
Current Year Actual
Previous Year Actual
Target Values
Separate charts for:
MTD performance
YTD performance
KPI Slicer
A KPI slicer on the left allows users to select a specific KPI and analyze its performance instantly.
Because of this design, users can quickly identify performance patterns and anomalies.
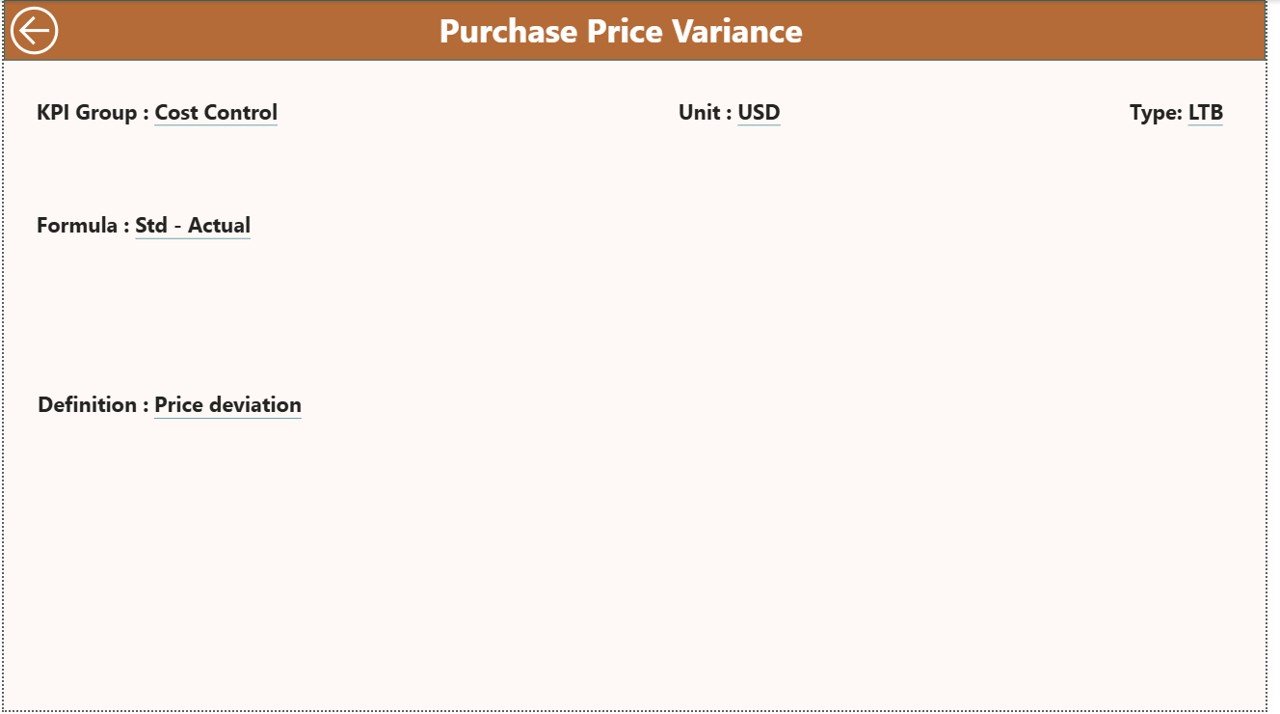
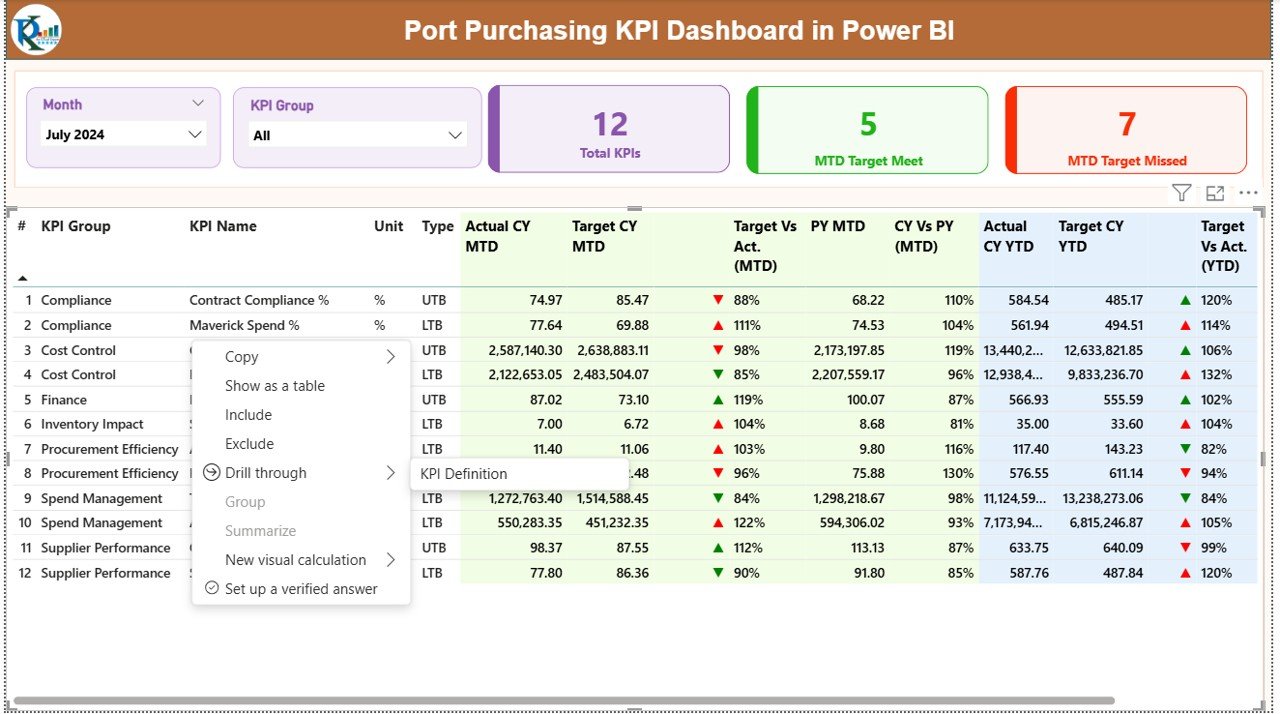
KPI Definition Page – Detailed KPI Explanation
The KPI Definition Page works as a drill-through page.
What This Page Includes
- KPI Formula
- KPI Definition
- KPI Type (LTB / UTB)
- Unit of Measurement
This page helps users understand the logic behind each KPI.
Excel Data Structure Used in the Dashboard
The dashboard uses Excel as the backend data source, which makes it simple and flexible.
Excel Sheets Used
Input_Actual Sheet
This sheet captures actual performance data.
Fields include:
- KPI Name
- Month (use first date of the month)
- MTD Value
- YTD Value
Input_Target Sheet
This sheet stores target values.
Fields include:
- KPI Name
- Month
- MTD Target
- YTD Target
KPI Definition Sheet
This sheet defines each KPI.
Fields include:
- KPI Number
- KPI Group
- KPI Name
- Unit
- Formula
- Definition
- KPI Type (LTB / UTB)
This structure ensures clean data management and easy updates.
Advantages of Port Purchasing KPI Dashboard in Power BI
Improves Decision-Making
The dashboard provides real-time insights, which help managers take faster and better decisions.
Enhances Procurement Visibility
Users can track performance across months, departments, and KPIs.
Reduces Manual Reporting
Since Power BI automates calculations, teams save time and effort.
Supports Target Monitoring
The dashboard clearly shows whether KPIs meet targets or not.
Improves Accountability
Each KPI has a defined owner and measurement method.
Easy to Customize
Users can modify KPIs, targets, and visuals based on business needs.
How Does This Dashboard Help Port Purchasing Teams?
- Tracks procurement efficiency
- Monitors supplier performance
- Controls procurement costs
- Improves forecasting accuracy
- Enhances management reporting
- Supports compliance monitoring
As a result, organizations achieve better control over purchasing operations.
Best Practices for Using Port Purchasing KPI Dashboard
Keep KPI Definitions Clear
Always define KPIs clearly to avoid confusion.
Update Data Regularly
Update Excel sheets monthly to ensure accurate reporting.
Use Consistent Units
Maintain the same unit of measurement across all KPIs.
Review Trends Monthly
Analyze MTD and YTD trends to spot issues early.
Set Realistic Targets
Avoid unrealistic targets that distort performance analysis.
Use Filters Effectively
Use slicers to analyze performance by month and KPI group.
Who Should Use This Dashboard?
This dashboard suits:
- Port Authorities
- Procurement Managers
- Purchase Officers
- Operations Managers
- Finance Teams
- Logistics Managers
- Business Analysts
Any organization handling port purchasing operations can benefit from this dashboard.
Why Choose Power BI for Purchasing KPI Tracking?
Power BI offers:
- Interactive dashboards
- High-speed data processing
- Visual performance tracking
- Easy Excel integration
- Secure data handling
- Scalable reporting
Therefore, Power BI becomes the perfect choice for procurement analytics.
Conclusion
The Port Purchasing KPI Dashboard in Power BI delivers a complete, user-friendly, and powerful solution for monitoring procurement performance. It transforms raw purchasing data into meaningful insights that help organizations reduce costs, improve efficiency, and achieve strategic goals.
Since the dashboard uses Excel as a data source and Power BI for visualization, it remains easy to maintain and highly scalable. Moreover, the clear KPI structure, trend analysis, and performance indicators make it an ideal tool for modern port operations.
If your organization wants better control, higher transparency, and smarter purchasing decisions, this dashboard offers the perfect solution.
Frequently Asked Questions (FAQs)
What is a Port Purchasing KPI Dashboard?
A Port Purchasing KPI Dashboard is a Power BI report that tracks procurement performance using predefined KPIs such as cost, target achievement, and trends.
Can I use Excel as a data source?
Yes, the dashboard uses Excel files for actual data, target data, and KPI definitions.
Does this dashboard support MTD and YTD analysis?
Yes, it includes both Month-to-Date and Year-to-Date performance tracking.
Can I customize the KPIs?
Yes, you can easily add, edit, or remove KPIs using the Excel input sheets.
Is this dashboard suitable for large ports?
Yes, it works for both small and large port operations.
Do I need Power BI expertise to use it?
No, the dashboard comes ready to use and requires only basic Excel knowledge.
Watch the step-by-step video tutorial:
Visit our YouTube channel to learn step-by-step video tutorials