Managing refinery tenders demands precision, transparency, and continuous monitoring. However, many refinery organizations still depend on scattered Excel files, emails, and manual reports. As a result, decision-makers struggle to track profitability, compare bids, and identify risks on time. Therefore, a Refinery Tender Dashboard in Power BI becomes a powerful solution.
In this detailed guide, you will learn everything about the Refinery Tender Dashboard in Power BI, including its features, structure, advantages, best practices, and real-world usage. Moreover, you will understand how this dashboard transforms complex tender data into clear and actionable insights.
Click to Purchases Refinery Tender Dashboard in Power BI
What Is a Refinery Tender Dashboard in Power BI?
A Refinery Tender Dashboard in Power BI is a visual analytics tool that helps refinery organizations track, analyze, and manage tender performance using interactive charts and KPIs.
Instead of reviewing multiple spreadsheets manually, this dashboard consolidates all tender-related data into a single Power BI file. Consequently, users gain instant visibility into profit margins, bid values, estimated costs, vendor performance, and monthly trends.
Moreover, Power BI enables interactive filtering using slicers. Therefore, users can analyze tender performance by state, tender type, category, vendor, refinery, and month with just a few clicks.
Why Do Refineries Need a Tender Dashboard in Power BI?
Refinery tenders involve large budgets, multiple vendors, and strict compliance requirements. Therefore, manual tracking creates risks and inefficiencies.
A Refinery Tender Dashboard in Power BI solves these challenges effectively.
Key Reasons Refineries Need This Dashboard
-
Centralizes all tender data in one place
-
Improves visibility across refineries and vendors
-
Helps identify profitable and risky tenders quickly
-
Enables faster and data-driven decisions
-
Reduces dependency on manual reporting
As a result, refinery management teams gain control, clarity, and confidence in tender decisions.
How Does a Refinery Tender Dashboard in Power BI Work?
The Refinery Tender Dashboard works by connecting Power BI with a structured data source, usually Excel or a database. Once users update the data, Power BI refreshes all visuals automatically.
Additionally, slicers allow users to filter the data instantly. Therefore, stakeholders can analyze tenders by location, vendor, category, tender type, or time period.
This automated process saves time and ensures data accuracy.
Key Features of Refinery Tender Dashboard in Power BI
The Refinery Tender Dashboard in Power BI includes five professionally designed pages, each serving a specific analytical purpose.
Let us explore each page in detail.
Click to Purchases Refinery Tender Dashboard in Power BI
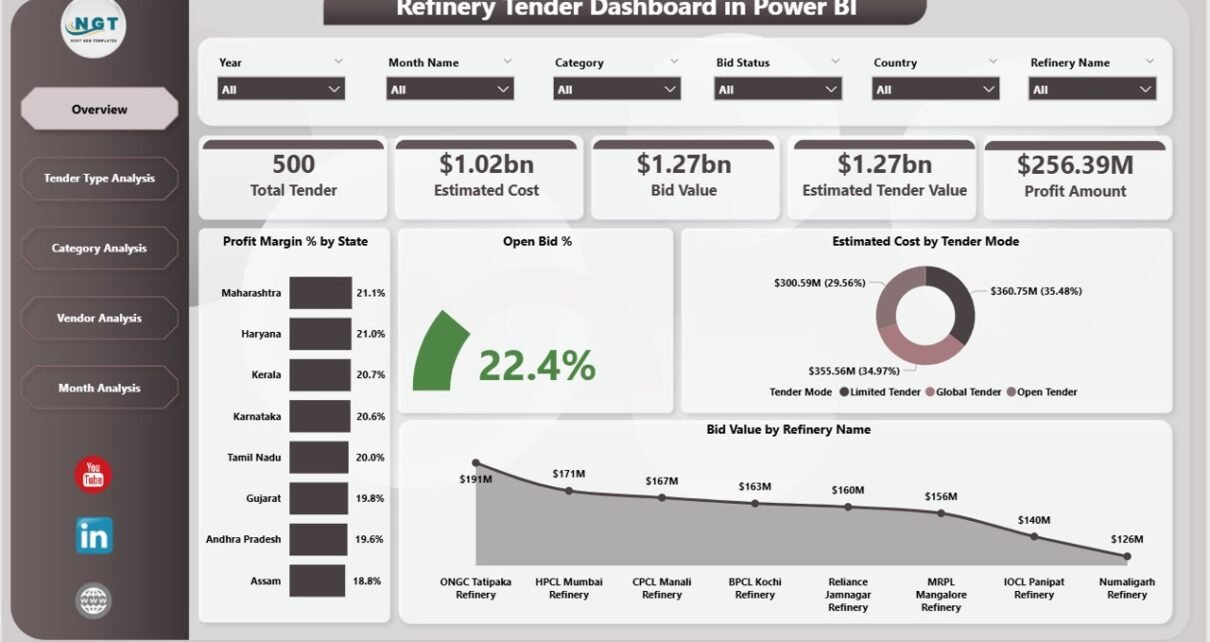
1. Overview Page – How Does It Give a Complete Tender Snapshot?

The Overview Page acts as the main landing page of the dashboard. This page provides a high-level summary of tender performance across all refineries.
Key Elements of the Overview Page
Interactive Slicers
-
Filter data by State, Refinery, Tender Type, Vendor, or Category
-
Instantly update all visuals based on selections
KPI Cards
-
Total Bid Value
-
Total Estimated Cost
-
Overall Profit Margin %
-
Open Bid Percentage
These cards provide quick insights into tender health.
Charts on Overview Page
-
Profit Margin % by State
Helps identify which states generate higher profitability -
Open Bid % by State
Highlights regions with pending tender decisions -
Estimated Cost by Tender Mode
Compares costs across different tender modes -
Bid Value by Refinery Name
Shows tender value distribution across refineries
As a result, management gains a complete overview in seconds.
2. Tender Type Analysis – How Do Different Tender Types Perform?

The Tender Type Analysis Page focuses on performance comparison across different tender types.
Key Insights from Tender Type Analysis
Charts Included
-
Profit Margin % by Tender Type
Identifies the most profitable tender types -
Estimated Cost by Tender Type
Highlights cost-heavy tender categories -
Bid Value by Tender Type
Shows which tender types attract higher bids
This page helps procurement teams decide which tender types deliver better returns.
Click to Purchases Refinery Tender Dashboard in Power BI
3. Category Analysis – Why Is Category-Level Analysis Important?

The Category Analysis Page evaluates tender performance based on categories such as equipment, services, maintenance, or materials.
Key Charts in Category Analysis
-
Profit Margin % by Category
Reveals high-margin categories -
Estimated Cost by Category
Identifies categories with higher spending -
Bid Value by Category
Shows demand and competition across categories
Therefore, refinery teams can focus on profitable categories and control high-cost ones.
4. Vendor Analysis – Which Vendors Deliver the Best Value?

Vendor performance plays a critical role in tender success. Hence, the Vendor Analysis Page focuses entirely on vendor-wise performance.
Vendor Analysis Charts
-
Profit Margin % by Vendor Name
Identifies vendors delivering better margins -
Estimated Cost by Vendor Name
Highlights high-cost vendors -
Bid Value by Vendor Name
Shows vendor participation and bid strength
As a result, procurement teams can negotiate better, shortlist vendors, and reduce risks.
5. Monthly Trends – How Do Tenders Perform Over Time?

The Monthly Trends Page helps users analyze tender performance over time.
Monthly Trend Charts
-
Profit Amount by Month
-
Estimated Cost by Month
-
Bid Value by Month
This page reveals seasonal trends, cost fluctuations, and profit patterns. Therefore, management can plan future tenders more effectively.
Advantages of Refinery Tender Dashboard in Power BI
A Refinery Tender Dashboard in Power BI delivers multiple strategic advantages.
Major Advantages
-
📊 Centralized Tender Monitoring
-
⏱️ Faster Decision-Making
-
📈 Improved Profitability Tracking
-
🔍 Vendor and Category Transparency
-
🎯 Better Cost Control
-
📅 Trend-Based Planning
-
🚀 Reduced Manual Effort
Therefore, refineries gain a competitive edge through data-driven tender management.
How Does This Dashboard Improve Decision-Making?
This dashboard converts raw tender data into visual insights. As a result, decision-makers no longer rely on assumptions.
Instead, they:
-
Identify profitable tenders quickly
-
Detect cost overruns early
-
Compare vendor performance objectively
-
Monitor open and closed bids clearly
Hence, every tender decision becomes strategic and data-backed.
Best Practices for the Refinery Tender Dashboard in Power BI
Click to Purchases Refinery Tender Dashboard in Power BI
Following best practices ensures maximum value from the dashboard.
Best Practices You Should Follow
-
✅ Maintain clean and structured source data
-
✅ Standardize vendor, category, and refinery names
-
✅ Update data regularly
-
✅ Use slicers wisely for focused analysis
-
✅ Review monthly trends for planning
-
✅ Share dashboard access with stakeholders
-
✅ Validate data before refresh
When you follow these practices, the dashboard remains accurate, reliable, and powerful.
Who Can Use a Refinery Tender Dashboard in Power BI?
This dashboard benefits multiple stakeholders.
Ideal Users
-
Refinery Management Teams
-
Procurement Managers
-
Tender Evaluation Committees
-
Finance and Cost Control Teams
-
Vendor Management Teams
-
Strategic Planning Teams
Thus, it serves both operational and strategic needs.
How Is Power BI Better Than Excel for Tender Dashboards?
Although Excel works well for data entry, Power BI offers advanced analytics.
Power BI vs Excel for Tender Analysis
-
Power BI provides interactive visuals
-
Power BI handles large datasets easily
-
Power BI supports real-time filtering
-
Power BI improves collaboration
-
Power BI ensures professional reporting
Therefore, Power BI becomes the ideal platform for enterprise-level tender dashboards.
Can This Dashboard Be Customized?
Yes, this dashboard offers complete flexibility.
Customization Options
-
Add more KPIs
-
Include compliance or risk indicators
-
Integrate live databases
-
Create additional trend pages
-
Customize visuals and layouts
Thus, organizations can tailor the dashboard to their exact needs.
Common Challenges in Tender Management Without a Dashboard
Without a dashboard, organizations face several issues.
Common Problems
-
Data inconsistency
-
Delayed reporting
-
Poor vendor visibility
-
Missed profit opportunities
-
Manual errors
-
Limited historical analysis
A Refinery Tender Dashboard in Power BI eliminates these challenges effectively.
Conclusion: Why Should You Use a Refinery Tender Dashboard in Power BI?
A Refinery Tender Dashboard in Power BI is no longer optional. Instead, it has become essential for modern refinery operations.
This dashboard:
-
Centralizes tender data
-
Improves transparency
-
Enhances profitability analysis
-
Strengthens vendor evaluation
-
Supports strategic planning
Therefore, organizations that adopt this dashboard gain clarity, control, and confidence in every tender decision.
Frequently Asked Questions (FAQs)
What is a Refinery Tender Dashboard in Power BI?
A Refinery Tender Dashboard in Power BI is an interactive reporting tool that tracks and analyzes refinery tender performance using visual analytics.
Can beginners use this dashboard easily?
Yes, the dashboard uses intuitive visuals and slicers, making it easy for beginners.
Does this dashboard require live database integration?
No, you can use Excel as a data source. However, live databases can also integrate.
Can I track vendor performance using this dashboard?
Yes, the Vendor Analysis page provides detailed vendor-wise insights.
Is the dashboard suitable for large refinery organizations?
Yes, Power BI handles large datasets efficiently, making it ideal for enterprise use.
How often should I update the data?
You should update the data monthly or whenever new tenders occur.
Can this dashboard support strategic planning?
Yes, the Monthly Trends and Analysis pages support long-term planning.
Visit our YouTube channel to learn step-by-step video tutorials