Managing electricity contracts demands accuracy, transparency, and constant monitoring. Because electricity contracts involve high contract values, strict regulatory requirements, long durations, and multiple stakeholders, even a small performance gap can lead to serious financial and operational risks. Therefore, organizations need a reliable system that tracks contract KPIs clearly and consistently.
That is exactly why the Electricity Contract KPI Dashboard in Power BI becomes an essential analytical solution.
In this detailed and SEO-friendly article, you will learn what an Electricity Contract KPI Dashboard in Power BI is, how it works, why organizations need it, its page structure, key features, advantages, best practices, and frequently asked questions. By the end, you will clearly understand how this dashboard helps electricity boards, utilities, EPC contractors, and energy companies gain control, visibility, and confidence in contract performance.
Click to buy Electricity Contract KPI Dashboard in Power BI
What Is an Electricity Contract KPI Dashboard in Power BI?
An Electricity Contract KPI Dashboard in Power BI is a centralized reporting and analytics solution designed to track, analyze, and monitor key performance indicators related to electricity contracts.
Instead of working with scattered Excel files and manual reports, this dashboard consolidates all contract KPIs into one interactive Power BI report. As a result, decision-makers can instantly evaluate whether contracts meet targets or miss expectations.
Moreover, because the dashboard uses Excel as a data source and Power BI for visualization, both technical and non-technical users can adopt it easily.
Why Do Organizations Need an Electricity Contract KPI Dashboard?
Electricity contracts remain complex by nature. However, manual tracking methods make them even more difficult to manage. Therefore, organizations increasingly rely on Power BI dashboards for performance tracking.
Here is why this dashboard matters:
- Electricity contracts involve long-term commitments
- Financial exposure remains very high
- Regulatory compliance requires accurate reporting
- Contract KPIs change monthly and yearly
- Management teams need real-time visibility
Because of these challenges, a structured KPI dashboard becomes a necessity rather than a luxury.
How Does the Electricity Contract KPI Dashboard in Power BI Work?
The Electricity Contract KPI Dashboard in Power BI works through a simple yet powerful workflow:
- Data Entry in Excel
Users enter actual, target, and KPI definition data into structured Excel worksheets. - Data Modeling in Power BI
Power BI connects directly to the Excel file and models the data. - Dynamic KPI Calculations
The dashboard calculates MTD, YTD, target vs actual, and year-over-year comparisons. - Interactive Analysis
Users filter data using slicers and explore KPIs visually.
As a result, the entire performance monitoring process becomes faster, clearer, and more reliable.
What Are the Key Features of the Electricity Contract KPI Dashboard in Power BI?
This dashboard comes with a clean, structured, and scalable design. Moreover, it includes three powerful analytical pages that serve different business needs.
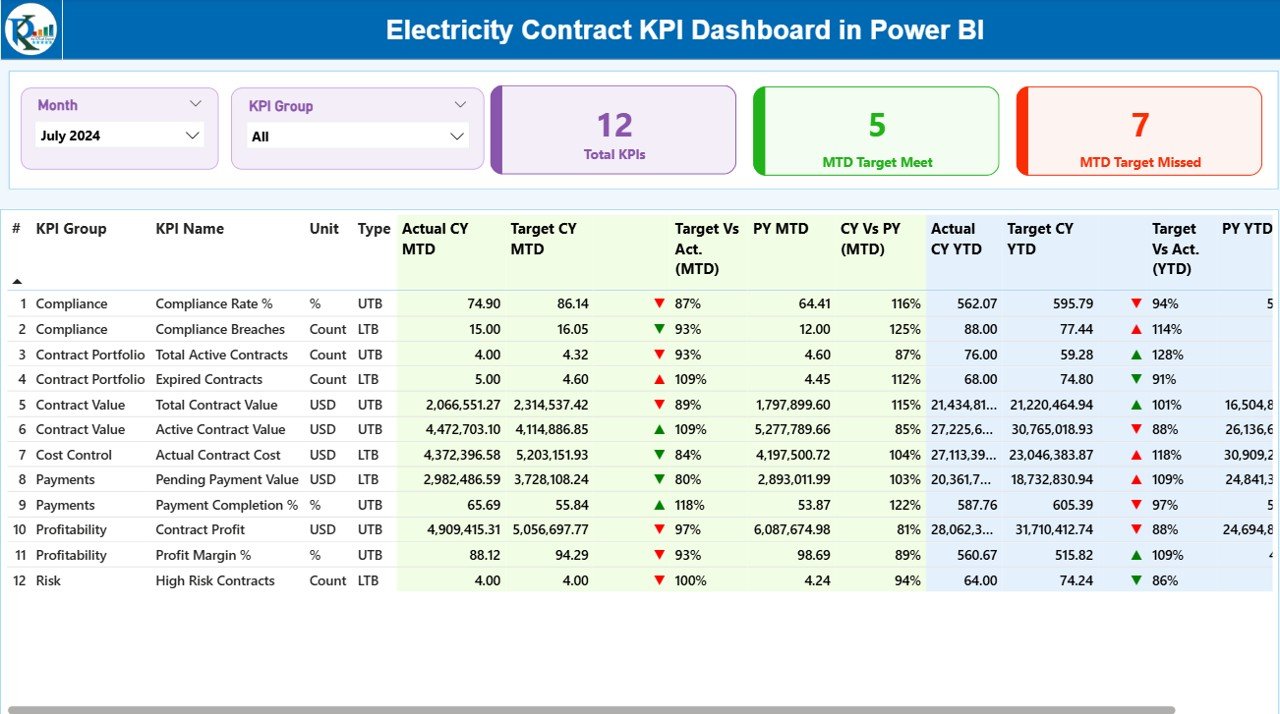
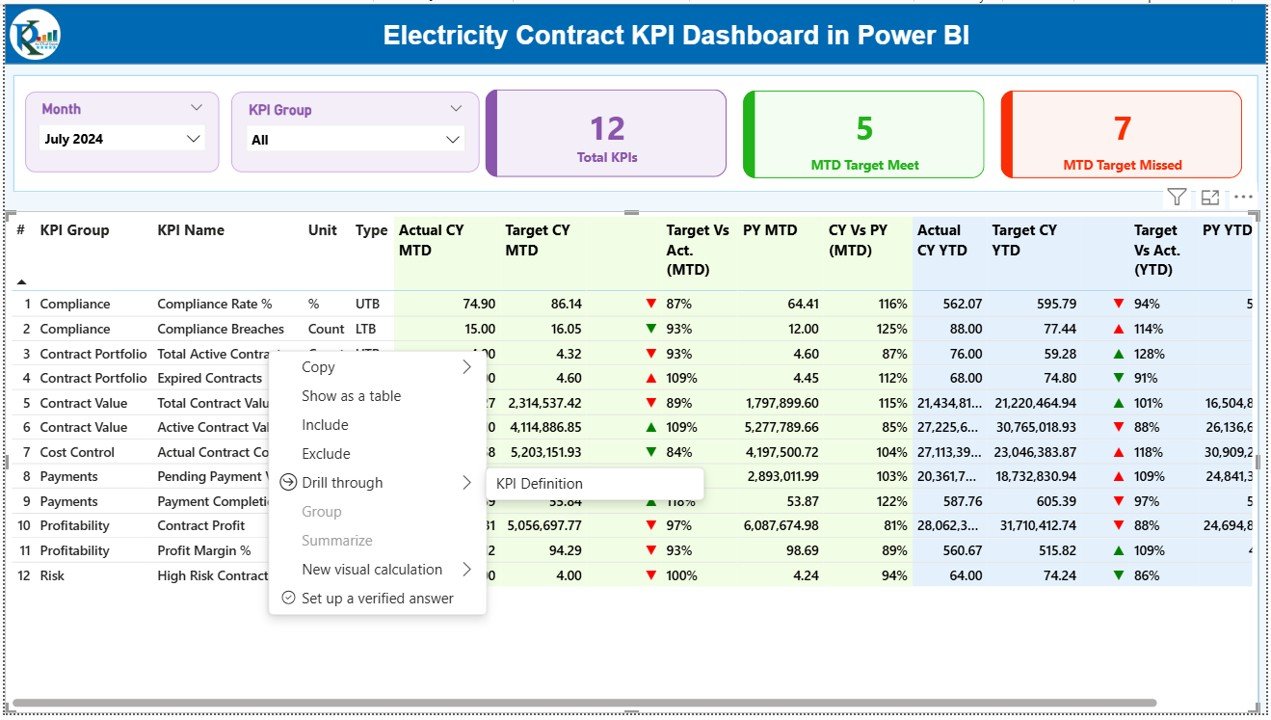
Summary Page: How Does It Help Decision-Makers?
The Summary Page acts as the central control panel of the dashboard. Because decision-makers need quick insights, this page highlights the most critical information at a glance.
Key Elements of the Summary Page
- Month Slicer
Allows users to select a reporting month dynamically. - KPI Group Slicer
Enables filtering KPIs by category or group.
KPI Cards
Total KPIs Count
MTD Target Meet Count
MTD Target Missed Count
These cards instantly show overall performance status.
Detailed KPI Table Explained
Below the cards, the dashboard displays a detailed KPI table that includes:
- KPI Number
Sequence number for easy reference. - KPI Group
Category or group of the KPI. - KPI Name
Name of the performance indicator. - Unit
Measurement unit of the KPI.
Type (LTB or UTB)
LTB: Lower the Better
UTB: Upper the Better
Actual CY MTD
Actual current year month-to-date value.
- Target CY MTD
Target value for current year MTD. - MTD Icon
▲ Green for target met
▼ Red for target missed
- Target vs Actual (MTD %)
Calculated as:
Actual MTD / Target MTD - Previous Year MTD (PY MTD)
MTD value for the same period last year. - CY vs PY (MTD %)
Calculated as:
Current Year MTD / Previous Year MTD - YTD Performance Metrics
The Summary Page also includes Year-to-Date analysis:
- Actual CY YTD
- Target CY YTD
- YTD Icon
- Target vs Actual (YTD %)
- PY YTD
- CY vs PY (YTD %)
Because of this structure, users can analyze short-term and long-term performance together.
Click to buy Electricity Contract KPI Dashboard in Power BI
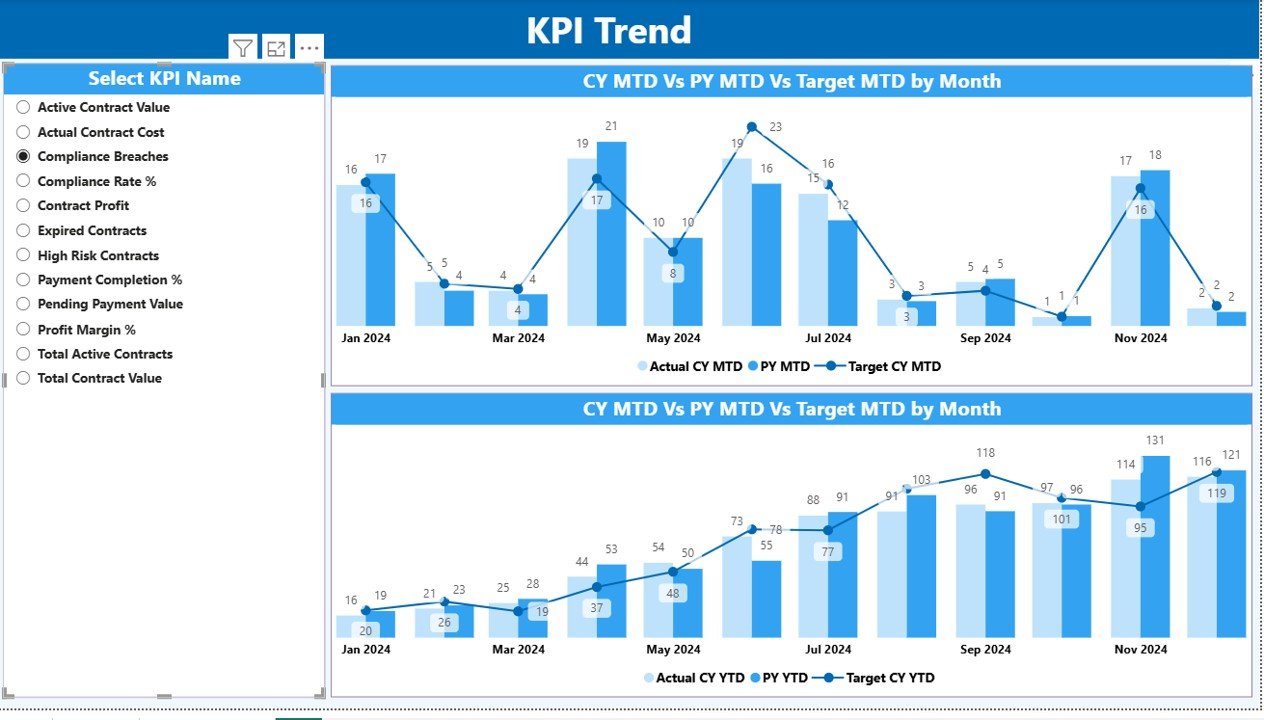
KPI Trend Page: How Can You Analyze Performance Over Time?
The KPI Trend Page focuses on historical and trend-based analysis. While the Summary Page shows status, this page explains behavior over time.
- What Does the KPI Trend Page Show?
- Two Combo Charts
MTD Trend: Actual vs Target vs Previous Year
YTD Trend: Actual vs Target vs Previous Year
- KPI Name Slicer
Users select a specific KPI to analyze its trend. - Because of these visuals, users can quickly identify patterns, seasonality, and performance gaps.
Click to buy Electricity Contract KPI Dashboard in Power BI
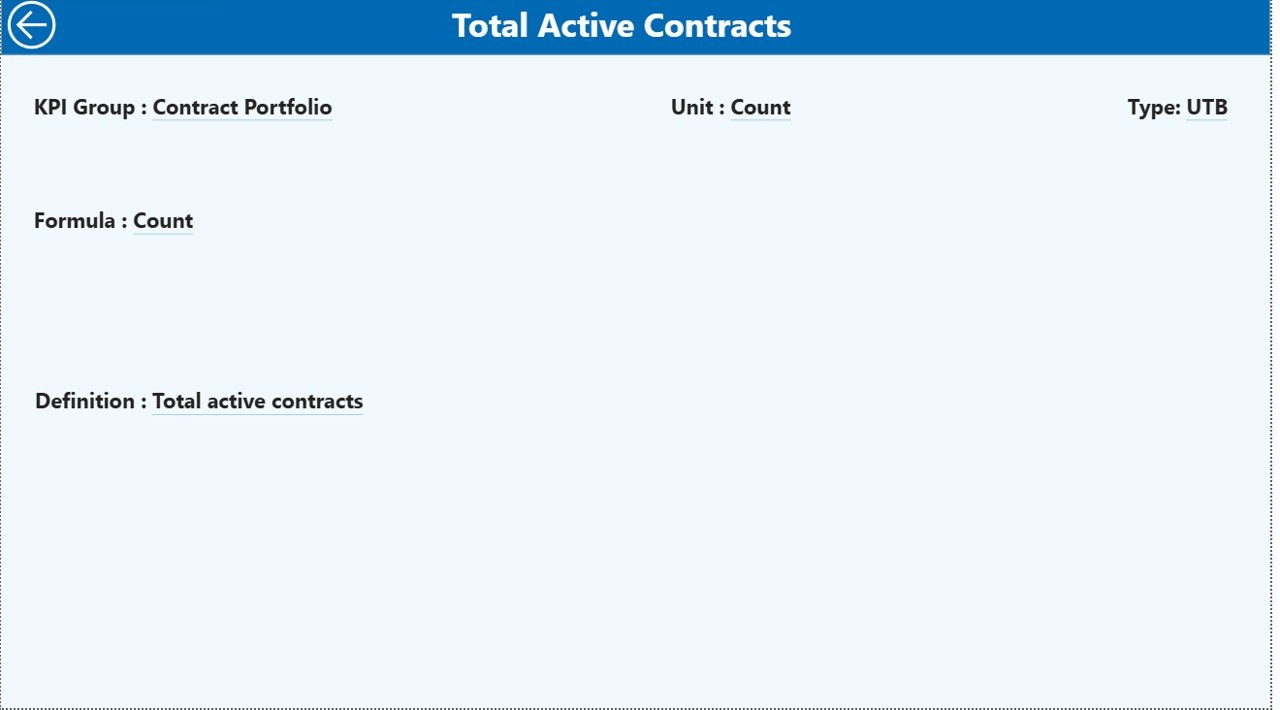
KPI Definition Page: Why Is It Important?
The KPI Definition Page acts as a reference and governance layer.
Key Highlights
- Hidden drill-through page
- Accessible from the Summary Page
- Displays:
KPI Formula
KPI Definition
Unit of Measurement
KPI Type (LTB or UTB)
This page ensures consistency and avoids confusion across teams.
Click to buy Electricity Contract KPI Dashboard in Power BI
How Do You Navigate Back to the Main Page?
The dashboard includes a Back Button on the top-left corner of the KPI Definition Page. With one click, users return to the Summary Page smoothly.
What Excel Data Is Required for This Dashboard?
The Electricity Contract KPI Dashboard uses Excel as its data source. Because of this approach, data maintenance remains simple and flexible.
Input_Actual Sheet: What Should You Enter?
In the Input_Actual sheet, users enter:
- KPI Name
- Month (first date of the month)
- Actual MTD Value
- Actual YTD Value
This sheet captures real performance data.
Input_Target Sheet: How Are Targets Managed?
In the Input_Target sheet, users enter:
- KPI Name
- Month (first date of the month)
- Target MTD Value
- Target YTD Value
Because targets vary over time, this structure supports monthly and yearly planning.
KPI Definition Sheet: Why Is It Critical?
The KPI Definition sheet includes:
- KPI Number
- KPI Group
- KPI Name
- Unit
- Formula
- Definition
- Type (LTB or UTB)
This sheet ensures clarity, standardization, and governance.
Advantages of the Electricity Contract KPI Dashboard in Power BI
Using this dashboard delivers significant benefits across operational, financial, and strategic levels.
- Centralized Contract Performance Monitoring
Instead of managing multiple files, teams track all KPIs in one place.
- Faster Decision-Making
Because insights update dynamically, leaders act faster and with confidence.
- Improved Accountability
Clear KPI ownership and performance visibility increase accountability.
- Reduced Manual Effort
Automation reduces reporting time and human errors.
- Scalable and Flexible Design
Organizations can add new KPIs or contracts without redesigning the dashboard.
Best Practices for the Electricity Contract KPI Dashboard in Power BI
To maximize value, organizations should follow these best practices.
- Define KPIs Clearly
Always document formulas, units, and KPI intent in the KPI Definition sheet.
- Maintain Data Discipline
Update actual and target data regularly and consistently.
- Use LTB and UTB Correctly
Correct KPI type ensures accurate performance indicators.
- Review Trends Monthly
Trend analysis helps identify risks early.
- Train Users
Ensure stakeholders understand slicers, filters, and drill-throughs.
Who Can Benefit from This Dashboard?
This dashboard supports a wide range of stakeholders:
- Electricity Boards
- Power Utilities
- EPC Contractors
- Energy Project Managers
- Contract Management Teams
- Finance and Compliance Teams
- Senior Leadership
How Does This Dashboard Improve Contract Governance?
Because the dashboard combines data, logic, and visualization, it strengthens governance by:
- Ensuring transparency
- Supporting audit readiness
- Improving compliance tracking
- Aligning teams with targets
How Is This Dashboard Different from Manual Excel Reports?
Manual Excel reports often suffer from:
- Data duplication
- Version conflicts
- Calculation errors
- Slow updates
In contrast, this Power BI dashboard offers automation, consistency, and real-time insights.
Conclusion: Is the Electricity Contract KPI Dashboard in Power BI Worth Using?
Absolutely.
The Electricity Contract KPI Dashboard in Power BI transforms complex contract data into clear, actionable insights. Because it combines structured Excel data with interactive Power BI visuals, organizations gain control, transparency, and confidence in contract performance.
Whether you manage government electricity contracts or private energy agreements, this dashboard helps you track targets, identify gaps, and improve outcomes consistently.
Frequently Asked Questions (FAQs)
What is an Electricity Contract KPI Dashboard in Power BI?
It is a Power BI dashboard designed to track and analyze electricity contract KPIs using Excel as a data source.
Can non-technical users use this dashboard?
Yes. Because the dashboard uses simple slicers and visuals, non-technical users can use it easily.
How often should data be updated?
Organizations should update data monthly for accurate MTD and YTD analysis.
Can we add new KPIs to the dashboard?
Yes. You can add new KPIs by updating the Excel input sheets and refreshing Power BI.
Does the dashboard support year-over-year analysis?
Yes. It includes CY vs PY comparisons for both MTD and YTD.
Is this dashboard suitable for large organizations?
Yes. The design supports scalability and multiple KPI groups.
Does it support compliance reporting?
Yes. Clear KPI definitions and audit-friendly structure support compliance needs.
Visit our YouTube channel to learn step-by-step video tutorials
Watch the step-by-step video tutorial:
Click to buy Electricity Contract KPI Dashboard in Power BI