Modern smart cities depend on data, transparency, and speed. Every purchasing decision impacts public spending, service quality, and citizen trust. Therefore, city administrators must track procurement performance clearly and continuously. However, when purchasing data stays scattered across spreadsheets and static reports, decision-makers lose visibility and control.
That is exactly where a Smart Cities Purchasing Dashboard in Power BI becomes a powerful solution. This advanced yet user-friendly dashboard transforms raw purchasing data into actionable insights, interactive visuals, and real-time KPIs. As a result, city leaders can monitor costs, vendor performance, and purchasing efficiency with confidence.
In this in-depth guide, you will learn what a Smart Cities Purchasing Dashboard in Power BI is, why it matters, how it works, its page structure, key metrics, advantages, best practices, and frequently asked questions. By the end of this article, you will clearly understand how this dashboard strengthens smart city purchasing governance.
Click to Purchases Smart Cities Purchasing Dashboard in Power BI
What Is a Smart Cities Purchasing Dashboard in Power BI?
A Smart Cities Purchasing Dashboard in Power BI is a centralized analytical reporting tool designed to monitor, analyze, and visualize city-level purchasing activities across departments, vendors, categories, and time periods.
Instead of manually reviewing purchasing data from multiple files, this dashboard consolidates all information into one interactive Power BI report built using Microsoft Power BI.
Because Power BI supports dynamic filters, drill-downs, and real-time updates, procurement teams can instantly answer critical questions such as:
-
Which departments exceed planned budgets?
-
Which vendors cause the highest cost variance?
-
How do actual costs compare with planned costs?
-
Are pending orders increasing month over month?
As a result, city administrations gain full purchasing visibility, better cost control, and faster decision-making.
Why Do Smart Cities Need a Purchasing Dashboard?
Smart cities manage large-scale procurement operations across infrastructure, utilities, public services, and administration. Therefore, purchasing complexity increases rapidly. Without a structured dashboard, teams face serious challenges.
Common Purchasing Challenges in Smart Cities
-
Fragmented purchasing data across departments
-
Delayed cost tracking and reporting
-
Limited vendor performance visibility
-
Weak budget control and cost variance analysis
-
Manual reporting that consumes time and resources
However, a Smart Cities Purchasing Dashboard in Power BI solves these challenges by centralizing data and automating insights.
How Does a Smart Cities Purchasing Dashboard in Power BI Work?
This dashboard connects purchasing data from structured sources such as Excel files, databases, or ERP systems. Then, Power BI processes the data using data models, measures, and relationships.
After that, the dashboard displays information through:
-
KPI cards
-
Bar and column charts
-
Trend analysis visuals
-
Interactive slicers (filters)
Because slicers allow users to filter by department, vendor, category, city, or month, every stakeholder can analyze data from their own perspective.
What Pages Are Included in the Smart Cities Purchasing Dashboard in Power BI?
This dashboard includes five well-structured analytical pages, each designed to answer specific purchasing questions.
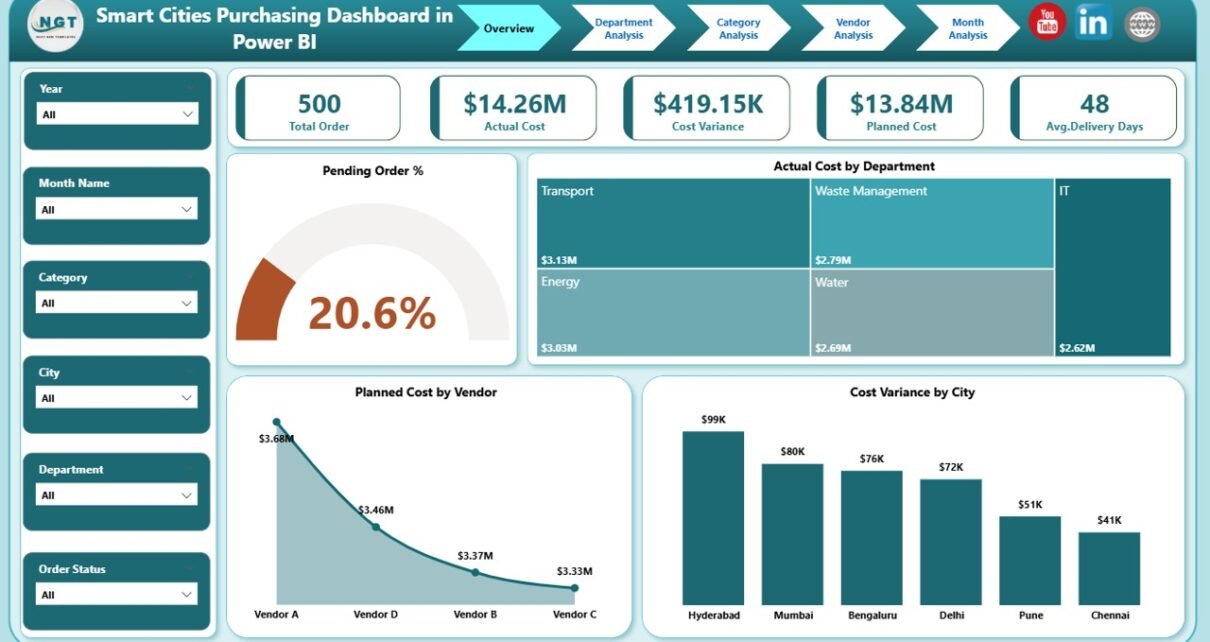
1. Overview Page – How Can City Leaders Get a Quick Purchasing Snapshot?
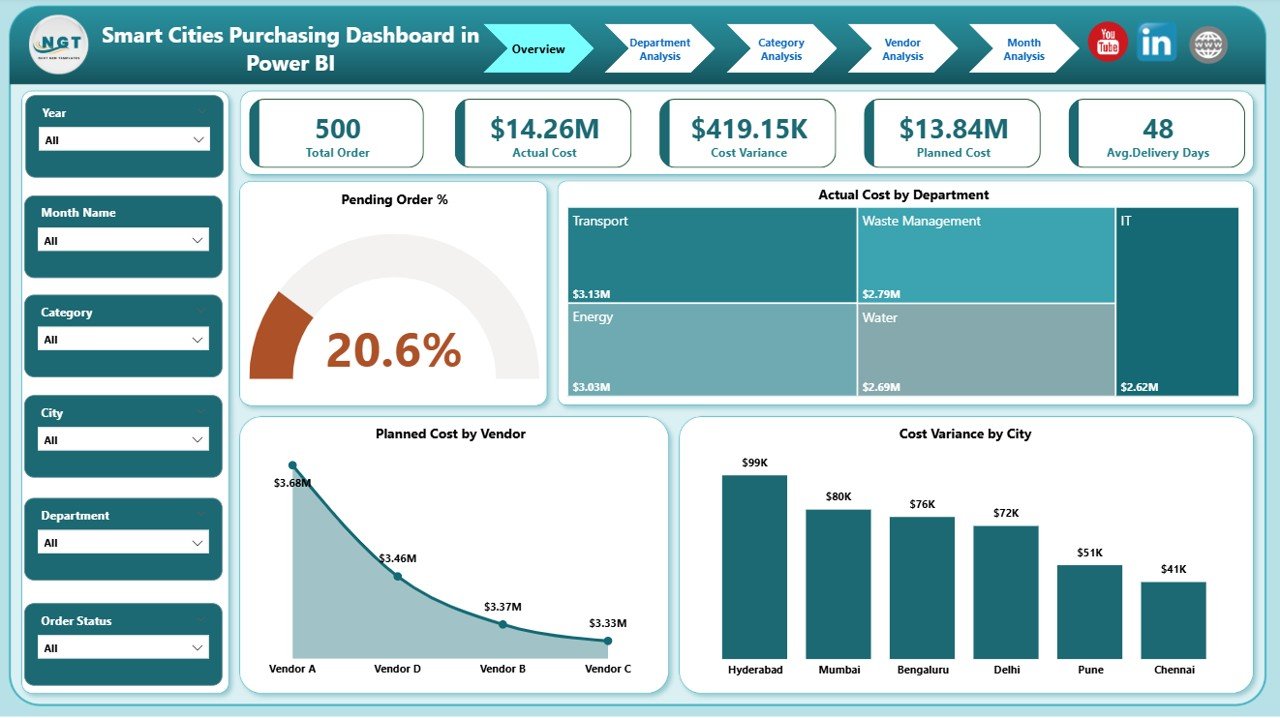
The Overview Page acts as the executive summary of the dashboard. It provides a high-level view of overall purchasing performance.
Key Features of the Overview Page
Slicers (Filters):
-
City
-
Department
-
Vendor
-
Category
-
Month
KPI Cards:
-
Pending Order %
-
Total Planned Cost
-
Total Actual Cost
-
Total Cost Variance
Charts Included:
-
📊 Pending Order %
-
📊 Actual Cost by Department
-
📊 Planned Cost by Vendor
-
📊 Cost Variance by City
Because everything appears on one page, city officials can quickly identify risks, overspending, and bottlenecks.
Click to Purchases Smart Cities Purchasing Dashboard in Power BI
2. Department Analysis – Which Departments Drive Purchasing Costs?
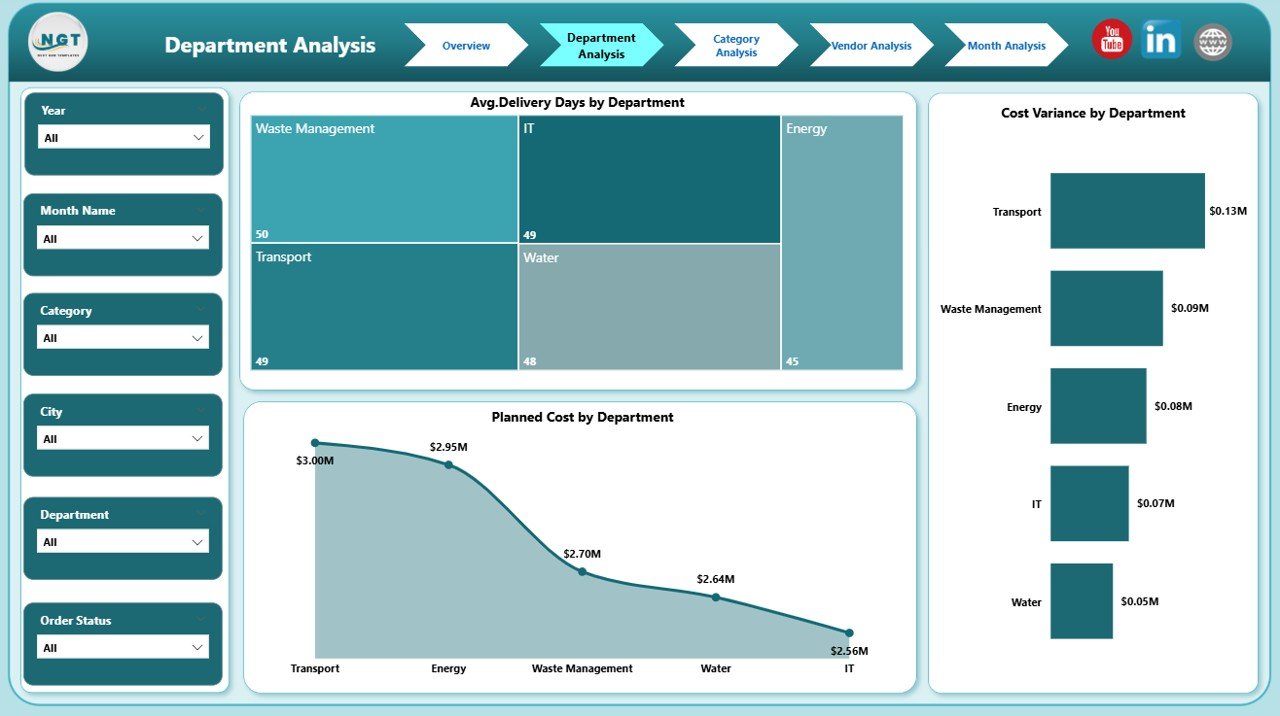
The Department Analysis Page focuses on departmental purchasing performance. As a result, procurement teams can compare departments easily.
Key Charts on Department Analysis Page
-
📈 Average Delivery Days by Department
-
📊 Cost Variance by Department
-
📊 Planned Cost by Department
This page helps city managers:
-
Identify departments with frequent delays
-
Track budget adherence by department
-
Optimize purchasing policies at the departmental level
3. Category Analysis – How Do Purchasing Categories Perform?
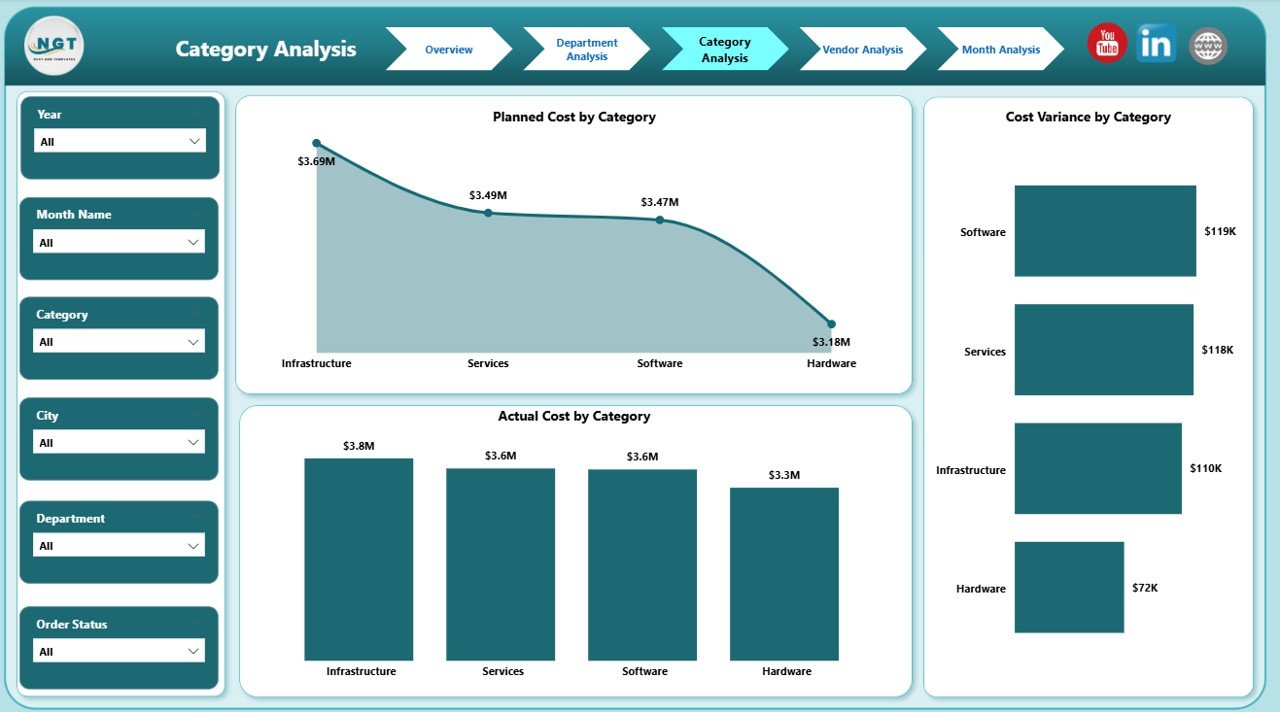
The Category Analysis Page breaks down purchasing data by item or service categories.
Key Charts on Category Analysis Page
-
📊 Planned Cost by Category
-
📊 Cost Variance by Category
-
📊 Actual Cost by Category
With this view, procurement teams can:
-
Detect high-cost categories
-
Reduce overspending in specific purchase types
-
Improve category-level planning
4. Vendor Analysis – Which Vendors Impact City Spending the Most?
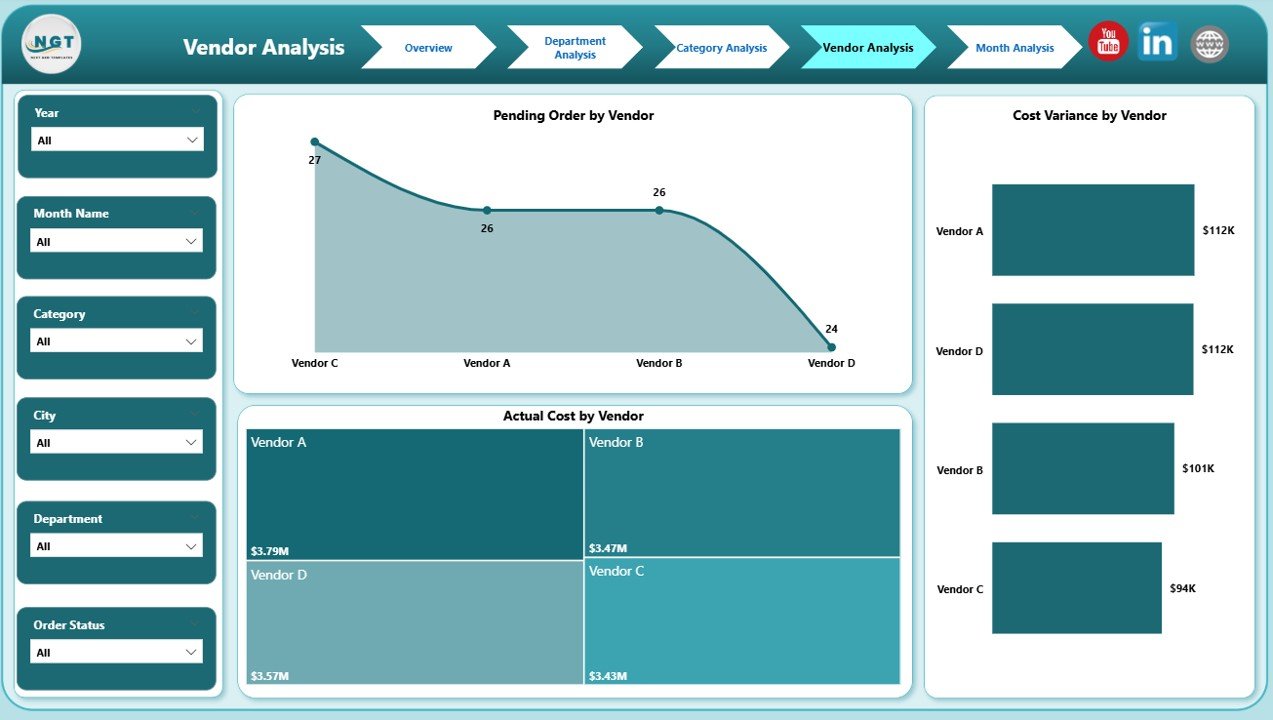
The Vendor Analysis Page focuses on supplier performance and spending patterns.
Key Charts on Vendor Analysis Page
-
📊 Planned Cost by Vendor
-
📊 Cost Variance by Vendor
-
📊 Actual Cost by Vendor
Because vendor performance directly affects city budgets, this page supports:
-
Vendor negotiations
-
Contract renewals
-
Supplier performance reviews
5. Monthly Trends – How Does Purchasing Performance Change Over Time?
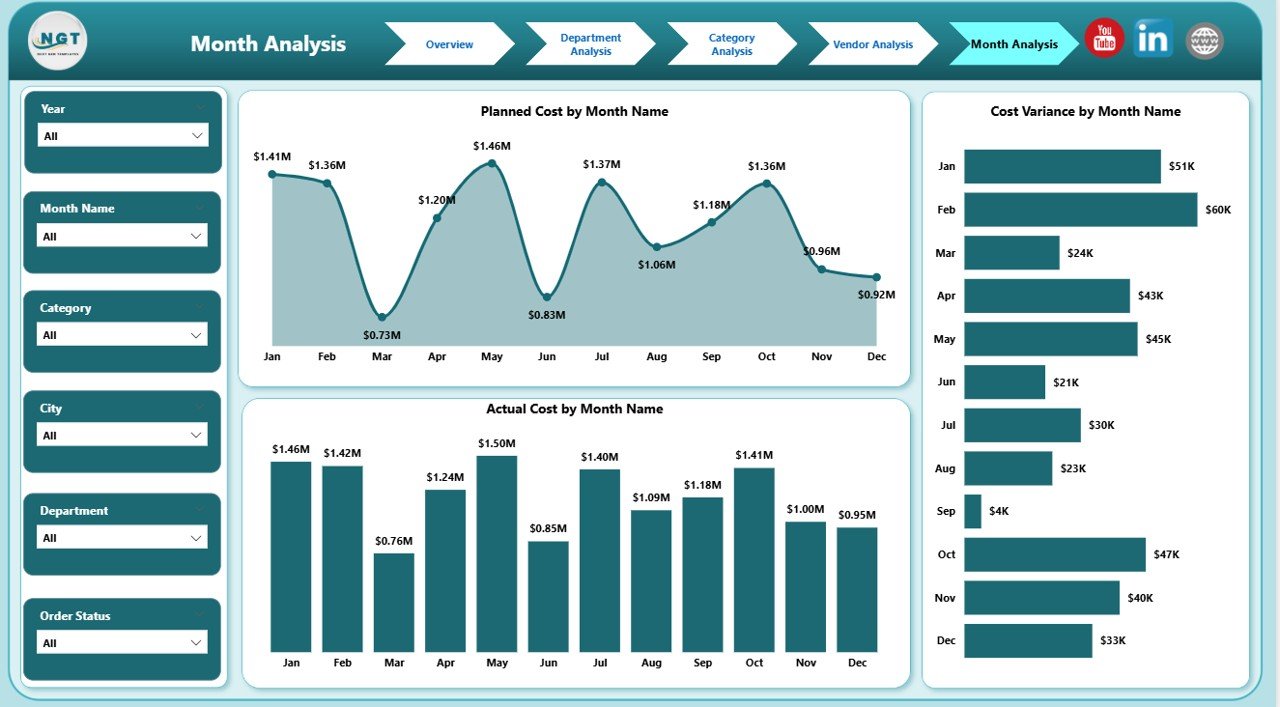
The Monthly Trends Page reveals purchasing patterns over time.
Key Charts on Monthly Trends Page
-
📈 Planned Cost by Month
-
📈 Cost Variance by Month
-
📈 Actual Cost by Month
This page helps decision-makers:
-
Track seasonal spending patterns
-
Identify rising cost trends early
-
Improve future budget forecasts
What KPIs Does a Smart Cities Purchasing Dashboard Track?
Click to Purchases Smart Cities Purchasing Dashboard in Power BI
This dashboard monitors essential purchasing KPIs, including:
-
Planned Cost
-
Actual Cost
-
Cost Variance
-
Pending Order %
-
Average Delivery Days
-
Monthly Spending Trends
-
Department-wise Cost Distribution
-
Vendor-wise Cost Performance
Because these KPIs update dynamically, teams always work with current data.
Advantages of Smart Cities Purchasing Dashboard in Power BI
A Smart Cities Purchasing Dashboard in Power BI delivers significant operational and strategic advantages.
Key Advantages
-
✅ Centralized purchasing data across the city
-
✅ Real-time cost monitoring
-
✅ Improved budget control
-
✅ Faster decision-making
-
✅ Better vendor performance tracking
-
✅ Reduced manual reporting effort
-
✅ Enhanced transparency and accountability
Moreover, Power BI visuals make insights easy to understand for both technical and non-technical users.
How Does This Dashboard Improve Smart City Governance?
Purchasing transparency plays a critical role in smart city governance. Therefore, this dashboard supports governance by:
-
Standardizing reporting across departments
-
Highlighting cost overruns early
-
Supporting audit and compliance requirements
-
Strengthening public trust through data accuracy
As a result, city administrations can demonstrate responsible spending.
Who Can Use a Smart Cities Purchasing Dashboard in Power BI?
This dashboard supports multiple stakeholders:
-
City procurement departments
-
Finance and budget teams
-
Urban planning authorities
-
Vendor management teams
-
City leadership and administrators
-
Policy and compliance officers
Because the dashboard remains interactive and intuitive, each user can extract relevant insights easily.
Best Practices for the Smart Cities Purchasing Dashboard in Power BI
To maximize the dashboard’s value, follow these proven best practices.
Best Practices
-
🔹 Standardize purchasing data before loading it into Power BI
-
🔹 Use consistent department, vendor, and category naming
-
🔹 Refresh data regularly to maintain accuracy
-
🔹 Define clear KPI formulas for cost variance
-
🔹 Train users to use slicers and filters effectively
-
🔹 Review monthly trends for proactive planning
-
🔹 Use vendor insights for better contract negotiations
By following these practices, cities can ensure reliable and actionable insights.
How Does Power BI Enhance Smart City Purchasing Analytics?
Power BI enhances analytics through:
-
Interactive dashboards
-
Drill-down capabilities
-
Dynamic filtering
-
Automated calculations
-
Secure data sharing
-
Scalable reporting
Therefore, Power BI remains an ideal platform for smart city purchasing intelligence.
How Can Cities Customize This Dashboard?
Cities can customize this dashboard by:
-
Adding more KPIs
-
Including compliance or sustainability metrics
-
Integrating ERP or financial systems
-
Applying city branding and color themes
-
Expanding trend analysis periods
Because Power BI remains flexible, customization stays simple and cost-effective.
Conclusion: Why Is a Smart Cities Purchasing Dashboard in Power BI Essential?
A Smart Cities Purchasing Dashboard in Power BI transforms complex purchasing data into clear, actionable insights. It empowers city leaders to control costs, improve vendor performance, and enhance transparency. Moreover, it replaces manual reports with automated, real-time analytics.
As smart cities continue to grow, data-driven purchasing decisions will define success. Therefore, implementing this dashboard becomes not just beneficial but essential.
Frequently Asked Questions (FAQs)
What is a Smart Cities Purchasing Dashboard in Power BI?
It is a centralized Power BI report that tracks purchasing performance across departments, vendors, categories, and time periods for smart cities.
Can this dashboard handle large city-level datasets?
Yes, Power BI efficiently processes large datasets and supports scalable city-wide analytics.
Does this dashboard support real-time data updates?
Yes, the dashboard supports scheduled and real-time data refresh based on data source connections.
Can non-technical users use this dashboard?
Yes, the dashboard uses intuitive visuals and slicers that make analysis easy for all users.
Can cities customize KPIs in this dashboard?
Yes, cities can add, remove, or modify KPIs based on procurement policies and reporting needs.
Does this dashboard improve budget control?
Absolutely. It highlights cost variance, overspending, and trends early, enabling proactive budget management.
Visit our YouTube channel to learn step-by-step video tutorials