Managing forex services without clear performance tracking feels like navigating a fast-moving market without charts. Rates fluctuate every second, volumes change daily, and margins remain tight. Therefore, forex service providers need a structured, reliable, and easy-to-use performance monitoring system. That is exactly where a Forex Services KPI Dashboard in Excel becomes essential.
In this detailed guide, you will learn what a Forex Services KPI Dashboard in Excel is, why it matters, how it works, and how you can use it to improve business decisions. Moreover, you will also explore its advantages, best practices, and frequently asked questions.
By the end of this article, you will clearly understand how this dashboard helps you gain visibility, improve control, and drive profitability—without complex tools or heavy IT dependency.
Click to buy Forex Services KPI Dashboard in Excel
What Is a Forex Services KPI Dashboard in Excel?
A Forex Services KPI Dashboard in Excel is a centralized performance tracking tool that monitors key operational, financial, and compliance-related metrics of a forex business.
Instead of managing multiple reports, spreadsheets, and emails, this dashboard brings all critical forex KPIs into one structured Excel file. As a result, decision-makers gain instant clarity across trading volumes, revenue, margins, customer activity, and performance trends.
Moreover, Excel makes this dashboard flexible, transparent, and easy to maintain. You can update data monthly, track trends, and analyze results without technical complexity.
Why Do Forex Service Providers Need a KPI Dashboard?
Forex services operate in a highly dynamic environment. Therefore, relying on intuition or static reports leads to missed opportunities and delayed responses.
A Forex Services KPI Dashboard in Excel helps because:
- It provides real-time-like performance visibility
- It ensures data-driven decisions
- It highlights gaps between targets and actuals
- It tracks monthly and yearly performance trends
- It supports regulatory and internal reviews
Most importantly, it allows forex managers to focus on strategy instead of manual reporting.
What KPIs Does a Forex Services KPI Dashboard Track?
Although KPIs vary by business model, most forex service dashboards track the following areas:
Financial Performance KPIs
- Revenue from forex transactions
- Gross margin percentage
- Cost per transaction
- Profit variance vs target
Operational KPIs
- Number of trades executed
- Average transaction value
- Trade success rate
- Processing turnaround time
Customer KPIs
- Active customers
- New customer onboarding
- Customer churn rate
- Average revenue per customer
Compliance & Risk KPIs
- Exception rate
- Error rate
- Regulatory breaches
- Exposure variance
By tracking these KPIs consistently, forex businesses gain a balanced performance view.
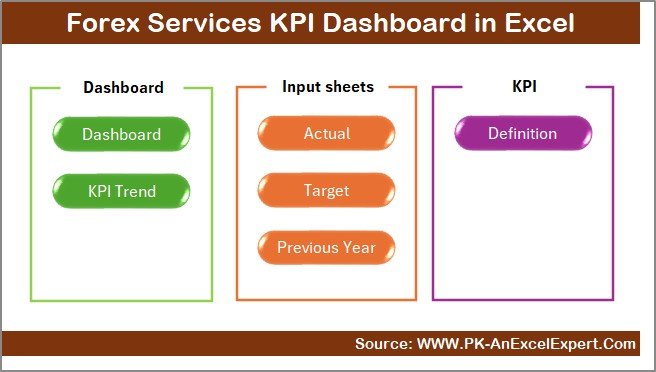
How Is the Forex Services KPI Dashboard Structured in Excel?
This Forex Services KPI Dashboard in Excel uses a structured, business-ready layout with seven interconnected worksheets. Each worksheet serves a clear purpose and improves usability.
Summary Page – How Does It Improve Navigation?
The Summary Page acts as an index and navigation hub for the dashboard.
Key Highlights of the Summary Page
- Provides six navigation buttons
- Allows users to jump directly to any worksheet
- Improves usability for non-technical users
- Reduces time spent searching for data
Because of this layout, users move across the dashboard smoothly and efficiently.
Click to buy Forex Services KPI Dashboard in Excel
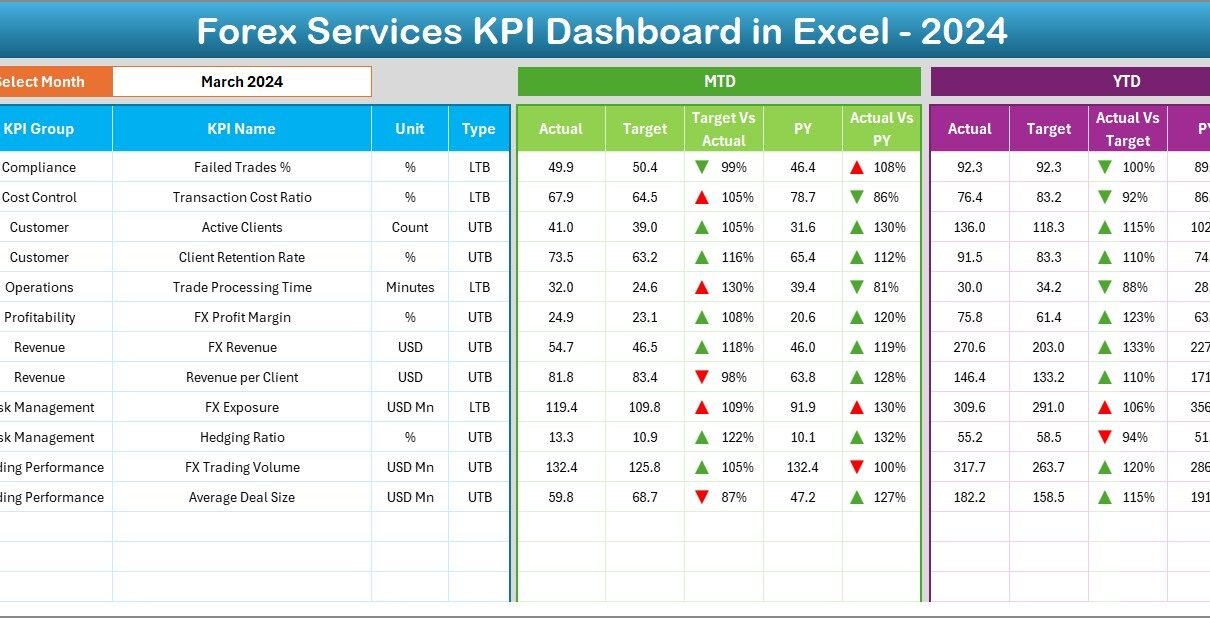
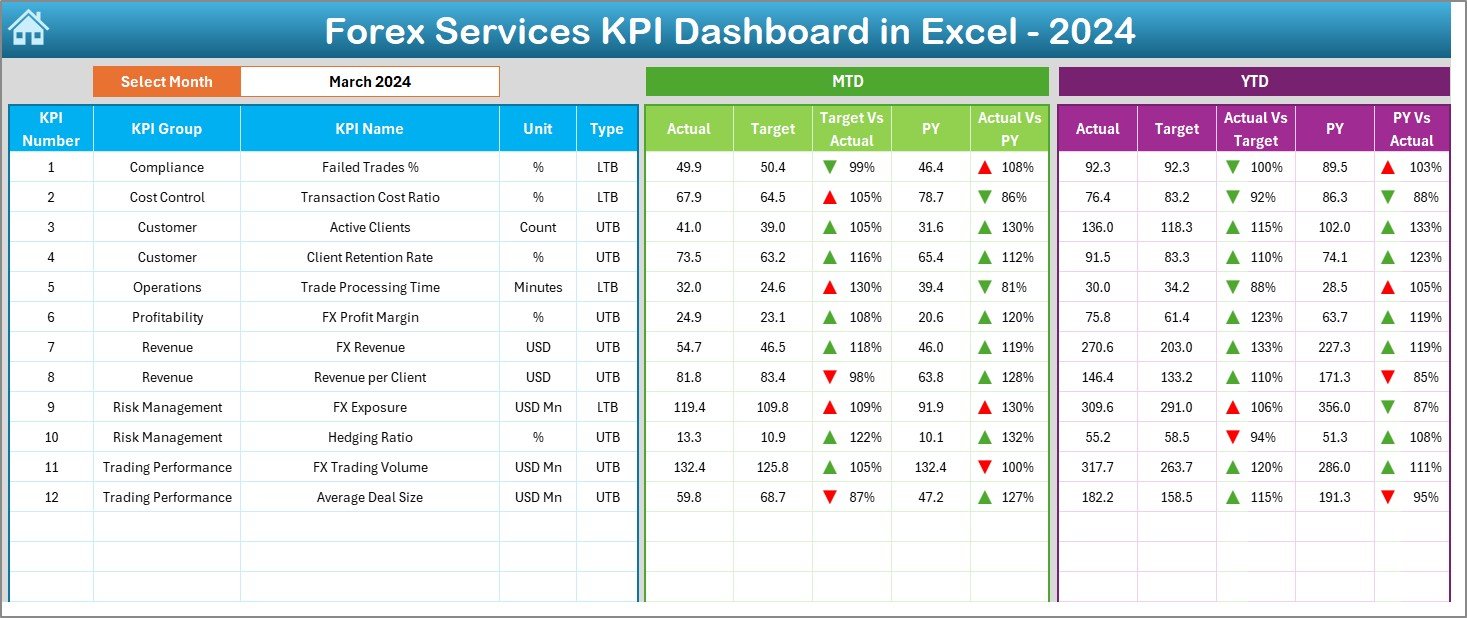
Dashboard Sheet – Where Do All KPIs Come Together?
The Dashboard Sheet serves as the core of the Forex Services KPI Dashboard in Excel.
Key Features of the Dashboard Sheet
- Month selector available in cell D3
- Automatic updates across all KPIs when the month changes
- Displays MTD (Month-to-Date) metrics
- Displays YTD (Year-to-Date) metrics
KPIs Displayed on the Dashboard
- MTD Actual, Target, and Previous Year values
- Target vs Actual comparison
- Previous Year vs Actual comparison
- YTD Actual, Target, and Previous Year values
Why Conditional Formatting Matters
- Up arrows indicate positive performance
- Down arrows indicate underperformance
- Colors help users identify issues instantly
As a result, managers spot trends and exceptions at a glance.
Click to buy Forex Services KPI Dashboard in Excel
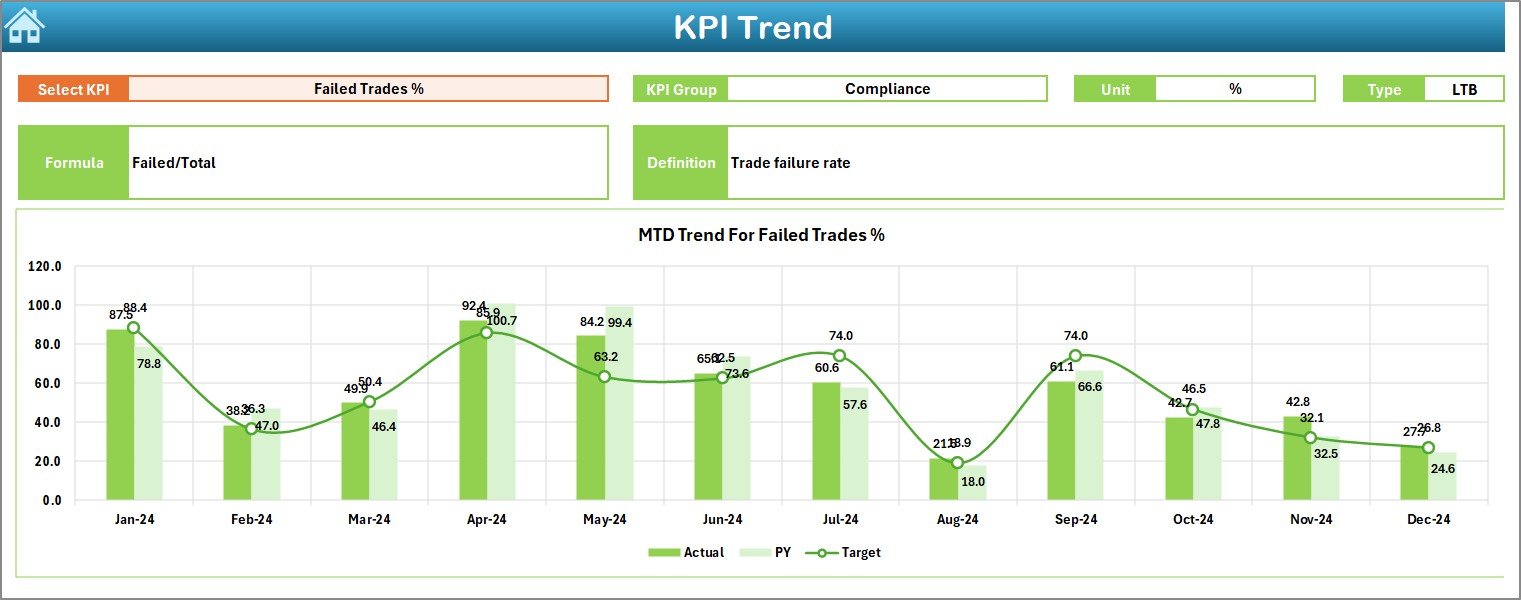
Trend Sheet – How Do You Analyze KPI Behavior Over Time?
The Trend Sheet focuses on in-depth KPI analysis.
How the Trend Sheet Works
KPI selection dropdown in cell C3
Displays:
KPI Group
KPI Unit
KPI Type (Upper the Better or Lower the Better)
KPI Formula
KPI Definition
Trend Analysis Charts
- MTD trend for Actual, Target, and Previous Year
- YTD trend for Actual, Target, and Previous Year
Because of this design, users understand not only current performance but also long-term behavior.
Click to buy Forex Services KPI Dashboard in Excel
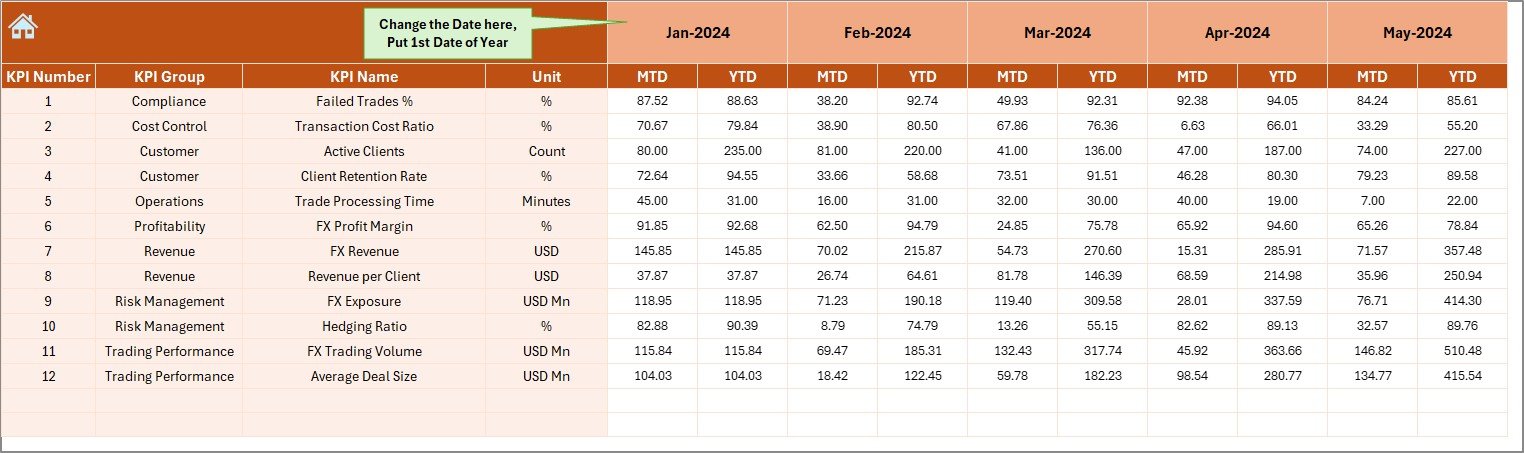
Actual Numbers Input Sheet – How Do You Enter Data Easily?
The Actual Numbers Input Sheet handles actual performance data entry.
Key Input Features
- Month selector in cell E1
- Entry of MTD and YTD actual values
- Structured input layout to reduce errors
This sheet ensures data consistency and improves accuracy across the dashboard.
Click to buy Forex Services KPI Dashboard in Excel
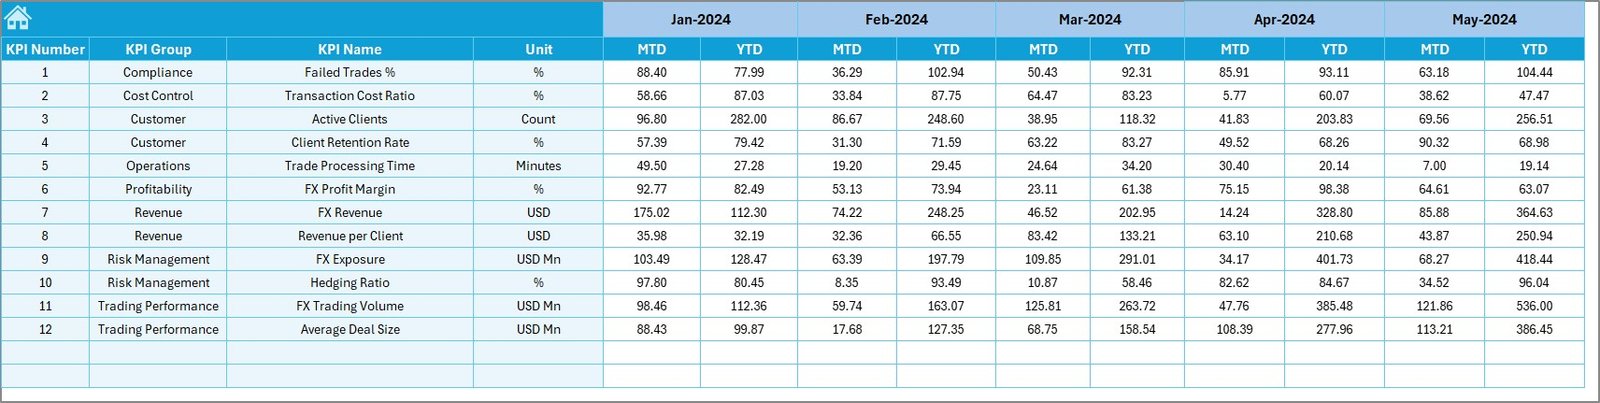
Target Sheet – How Do You Set Performance Goals?
The Target Sheet captures planned performance targets.
Why This Sheet Is Important
- Stores monthly MTD and YTD targets
- Enables variance analysis
- Supports performance benchmarking
Since targets drive accountability, this sheet plays a critical role.
Click to buy Forex Services KPI Dashboard in Excel
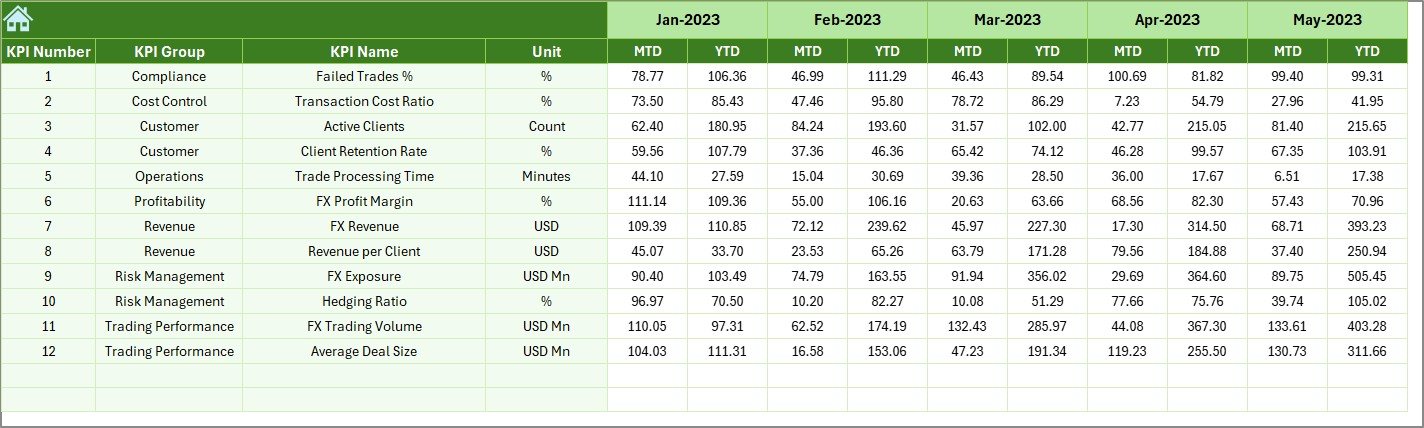
Previous Year Number Sheet – Why Compare Historical Data?
The Previous Year Number Sheet stores last year’s performance data.
Benefits of Previous Year Comparison
- Identifies growth patterns
- Highlights seasonal trends
- Measures long-term progress
By comparing current results with historical data, managers make better forecasts.
Click to buy Forex Services KPI Dashboard in Excel
KPI Definition Sheet – Why Is KPI Clarity Important?
The KPI Definition Sheet documents all KPIs clearly.
Information Captured
- KPI Name
- KPI Group
- Unit
- Formula
- KPI Definition
This sheet ensures clarity, consistency, and alignment across teams.

Click to buy Forex Services KPI Dashboard in Excel
What Are the Advantages of a Forex Services KPI Dashboard in Excel?
Using a Forex Services KPI Dashboard in Excel offers multiple advantages.
Key Advantages
- Centralized KPI tracking
- Easy-to-use Excel interface
- No expensive software required
- Customizable KPIs and layouts
- Clear MTD and YTD visibility
- Faster decision-making
- Improved accountability
- Better forecasting and planning
Because Excel remains familiar, adoption becomes fast and smooth.
How Does This Dashboard Support Better Decision-Making?
This dashboard supports decision-making by:
- Highlighting performance gaps early
- Showing trend-based insights
- Aligning targets with actuals
- Supporting strategic planning discussions
As a result, leadership teams act proactively instead of reactively.
Who Can Benefit from a Forex Services KPI Dashboard in Excel?
This dashboard helps multiple stakeholders:
- Forex service providers
- Currency exchange firms
- Treasury teams
- Finance managers
- Operations managers
- Compliance teams
- Business owners
Because of its flexible design, it adapts across roles and business sizes.
Best Practices for the Forex Services KPI Dashboard in Excel
Following best practices ensures long-term success.
- Define KPIs Clearly
Always document KPI definitions, formulas, and units.
- Update Data Regularly
Ensure timely updates for accurate insights.
- Keep Targets Realistic
Set achievable yet challenging targets.
- Review Trends Monthly
Do not rely only on monthly numbers—analyze trends.
- Use Conditional Formatting Wisely
Avoid overuse and keep visuals meaningful.
- Train Users
Ensure team members understand how to read and interpret KPIs.
- Maintain Data Validation
Reduce errors by using controlled inputs.
What Challenges Can This Dashboard Help Solve?
This dashboard addresses common forex business challenges:
- Scattered data sources
- Manual reporting errors
- Delayed performance reviews
- Lack of KPI clarity
- Poor trend visibility
By solving these issues, the dashboard improves operational efficiency.
How Does Excel Make This Dashboard More Powerful?
Excel enhances this dashboard because it offers:
- Flexible formulas
- Pivot-based analysis
- Easy data validation
- Visual formatting
- Familiar interface
Therefore, businesses gain power without complexity.
Conclusion: Why Should You Use a Forex Services KPI Dashboard in Excel?
A Forex Services KPI Dashboard in Excel transforms raw forex data into actionable insights. It brings structure, clarity, and control to performance management. Moreover, it empowers teams to track results, analyze trends, and improve outcomes—without relying on complex systems.
If you want better visibility, faster decisions, and stronger performance control, this dashboard becomes a must-have tool for your forex business.
Frequently Asked Questions (FAQs)
What is a Forex Services KPI Dashboard in Excel used for?
It tracks and analyzes financial, operational, and customer KPIs related to forex services in one centralized Excel file.
Can I customize KPIs in the dashboard?
Yes, you can add, modify, or remove KPIs based on business needs.
Does this dashboard require advanced Excel skills?
No, basic Excel knowledge is enough to use and maintain it.
How often should I update the dashboard?
Ideally, you should update it monthly for accurate MTD and YTD analysis.
Can small forex firms use this dashboard?
Yes, the dashboard suits both small and large forex service providers.
Does it support trend analysis?
Yes, the Trend Sheet provides MTD and YTD trend charts for each KPI.
Is Excel secure for forex performance data?
Yes, with proper access control and file management, Excel remains secure.
Visit our YouTube channel to learn step-by-step video tutorials
Watch the step-by-step video tutorial:
Click to buy Forex Services KPI Dashboard in Excel