Managing agricultural machinery efficiently has become more important than ever. Modern farming depends heavily on tractors, harvesters, planters, sprayers, and other equipment. However, when machinery performance data remains scattered across registers, notebooks, or unstructured Excel files, decision-making becomes slow and unreliable. That is exactly why an Agricultural Machinery KPI Dashboard in Excel plays a critical role in today’s agriculture operations.
An Agricultural Machinery KPI Dashboard in Excel helps farm owners, equipment managers, agribusiness companies, and operations teams monitor machinery performance, utilization, maintenance efficiency, and cost trends in one centralized view. Moreover, it converts raw numbers into clear insights using KPIs, comparisons, and trends. As a result, you can reduce downtime, control maintenance costs, and maximize machine productivity.
In this detailed blog post, you will learn what an Agricultural Machinery KPI Dashboard in Excel is, how it works, its worksheet structure, advantages, best practices, and frequently asked questions. You will also understand how this dashboard supports better operational and strategic decisions.
Click to Purchases Agricultural Machinery KPI Dashboard in Excel
What Is an Agricultural Machinery KPI Dashboard in Excel?
An Agricultural Machinery KPI Dashboard in Excel is a ready-to-use performance management tool designed to track and analyze key performance indicators related to agricultural equipment. Instead of reviewing raw data tables, this dashboard presents MTD, YTD, target, and previous year performance in a visual and easy-to-understand format.
Because the dashboard works entirely in Excel, it does not require any complex BI tools. At the same time, it provides a structured and scalable approach to machinery performance monitoring. Moreover, it supports both Lower the Better (LTB) and Upper the Better (UTB) KPIs, which ensures accurate interpretation of different metrics such as breakdown rates, utilization, and productivity.
Why Do Agricultural Operations Need a Machinery KPI Dashboard?
Agricultural machinery represents a significant investment. Therefore, poor tracking and delayed reporting can lead to higher downtime, increased repair costs, and reduced output. A KPI dashboard solves these problems by providing visibility and control.
Here is why agricultural operations need a machinery KPI dashboard:
-
It centralizes all machinery KPIs in one place
-
It compares actual performance with targets
-
It highlights performance gaps using visual indicators
-
It supports month-wise and year-wise trend analysis
-
It enables data-driven maintenance planning
As a result, farm managers and agribusiness leaders can make faster and more confident decisions.
How Does an Agricultural Machinery KPI Dashboard in Excel Work?
The working structure of this dashboard remains simple, logical, and effective.
-
Data Entry in Input Sheets
First, users enter actual, target, and previous year values in dedicated Excel sheets. -
KPI Definitions and Logic
Next, KPI formulas, units, and types are defined clearly in the KPI Definition sheet. -
Automated Dashboard Update
Finally, users select a month, and the dashboard updates automatically for MTD and YTD analysis.
Because of this design, the dashboard remains easy to maintain and business-ready.
What Worksheets Are Included in the Agricultural Machinery KPI Dashboard in Excel?
This dashboard includes 7 well-structured worksheets, each serving a specific purpose.
Click to Purchases Agricultural Machinery KPI Dashboard in Excel
1. Home Sheet: How Does It Improve Usability?
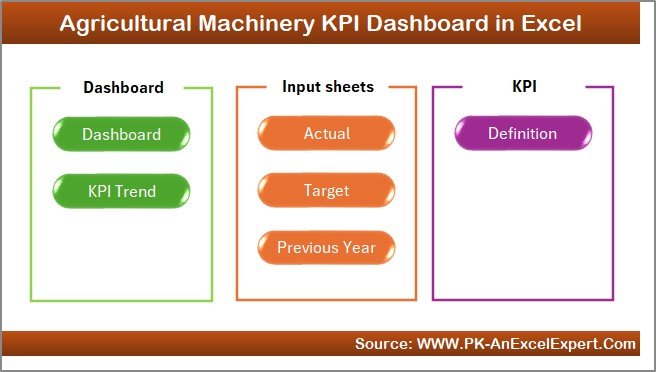
The Home Sheet acts as the index page of the dashboard.
Key Features of the Home Sheet
-
Provides 6 navigation buttons
-
Enables one-click access to all worksheets
-
Improves user experience for non-technical users
Therefore, users can navigate the dashboard quickly without confusion.
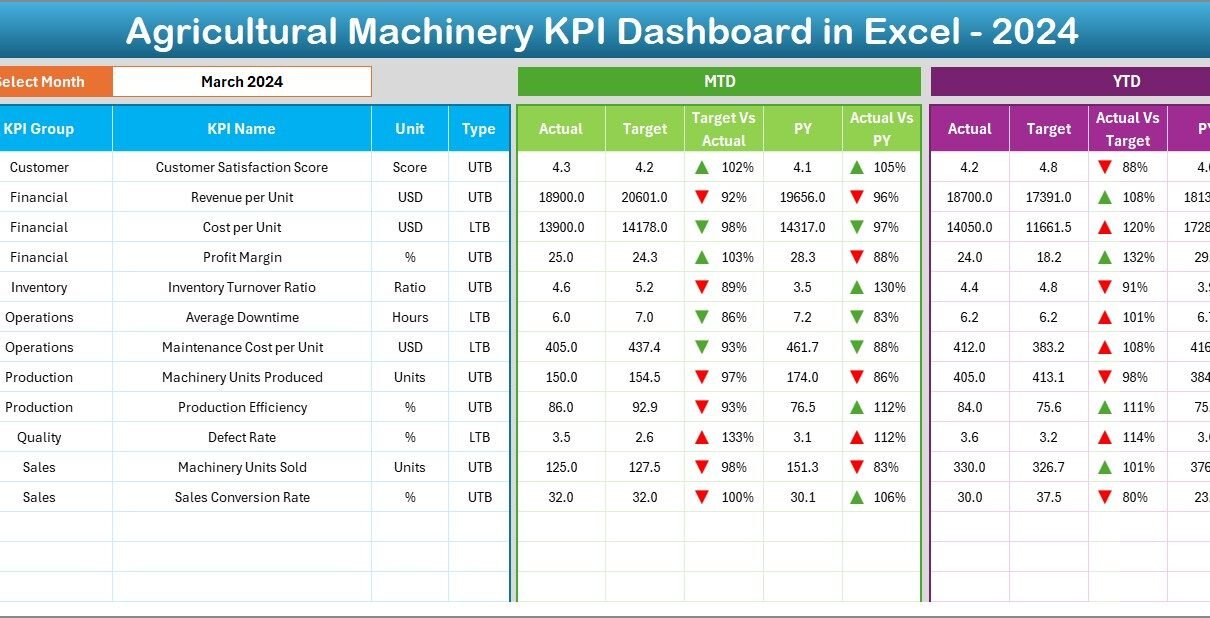
2. Dashboard Sheet: How Can You Monitor Machinery KPIs Effectively?
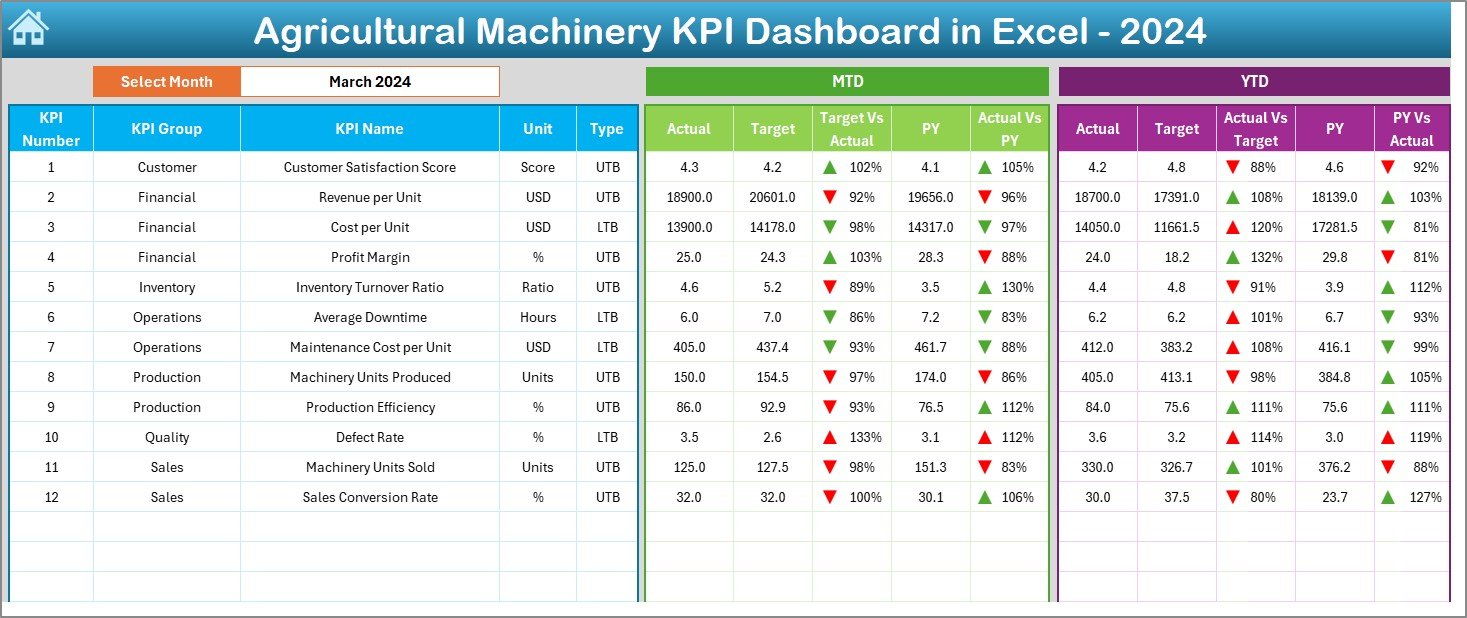
The Dashboard Sheet is the core reporting page where all KPI performance comes together.
How Does the Month Selection Work?
On cell D3, users select the month from a drop-down list. Immediately, the entire dashboard updates for that selected month. As a result, month-wise analysis becomes effortless.
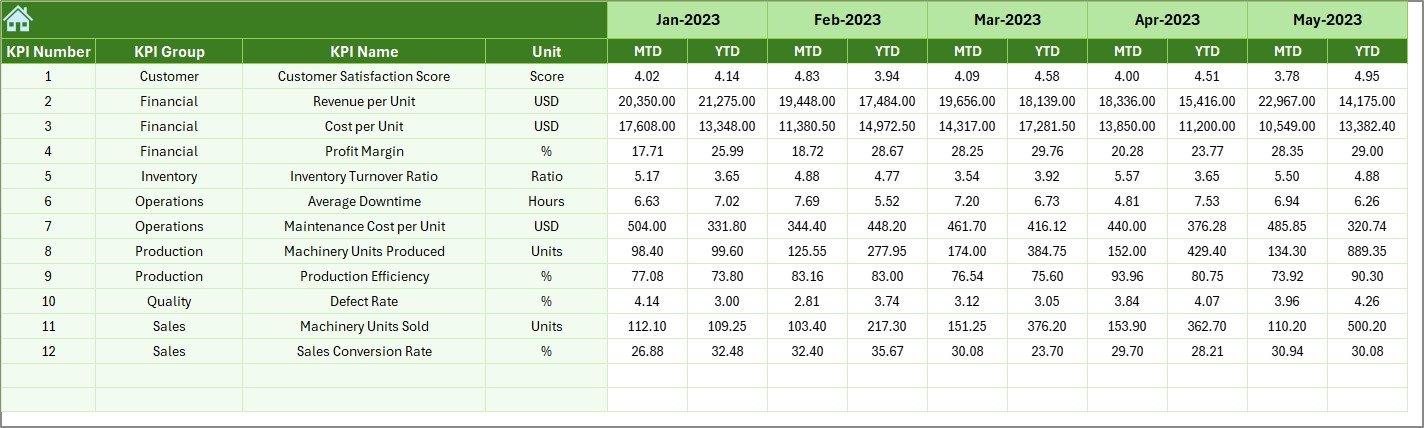
What Information Does the Dashboard Display?
The dashboard shows MTD and YTD performance along with targets and previous year comparisons.
MTD Metrics Displayed
-
MTD Actual
-
MTD Target
-
Previous Year MTD
-
Target vs Actual (%)
-
Previous Year vs Actual (%)
Conditional formatting with up and down arrows highlights whether performance meets expectations.
YTD Metrics Displayed
-
YTD Actual
-
YTD Target
-
Previous Year YTD
-
Target vs Actual (%)
-
Previous Year vs Actual (%)
Because YTD numbers represent cumulative performance, management teams can evaluate long-term efficiency and progress.
Why Are Visual Indicators Important?
Visual indicators such as arrows and colors help users identify issues instantly. Therefore, instead of analyzing numbers line by line, managers can focus on problem areas quickly.
3. KPI Trend Sheet: How Can You Analyze Machinery Performance Trends?
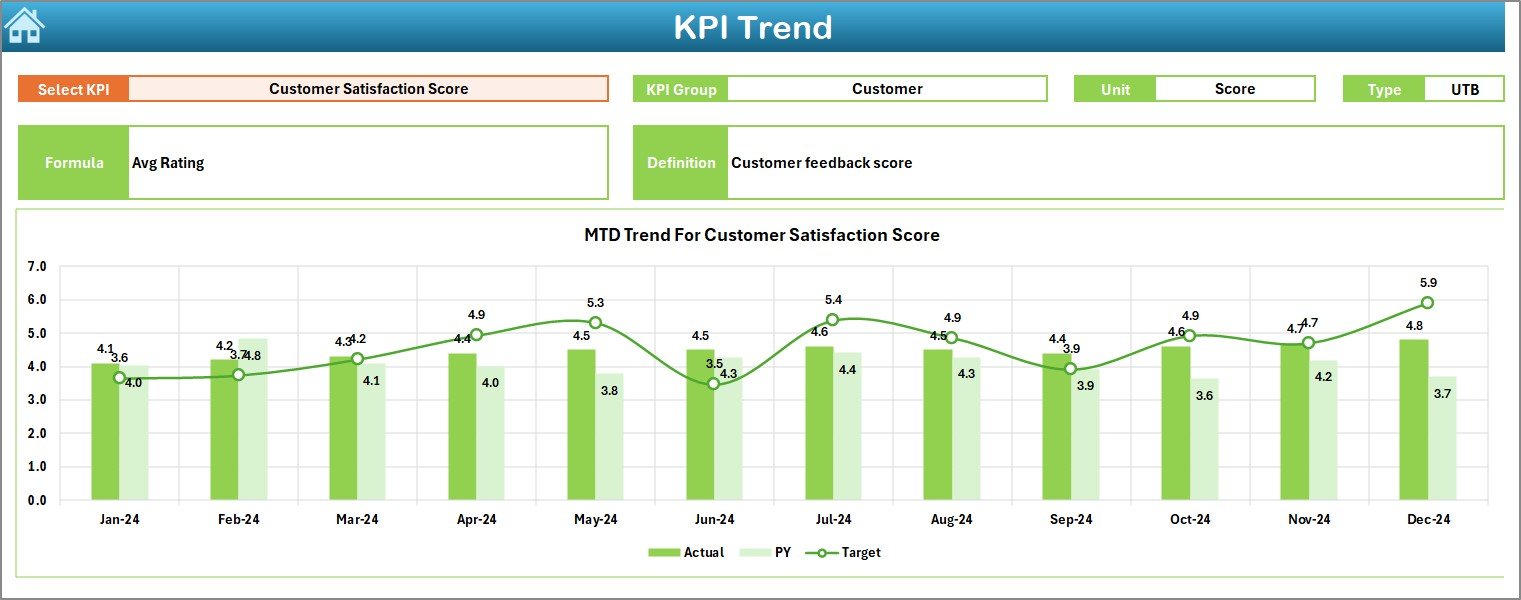
The KPI Trend Sheet focuses on trend-based analysis for individual KPIs.
How Do You Select a KPI?
Users select a KPI name from the drop-down available in cell C3. Once selected, all KPI details and charts update automatically.
What KPI Details Are Shown?
This sheet displays:
-
KPI Group
-
KPI Unit
-
KPI Type (LTB or UTB)
-
KPI Formula
-
KPI Definition
As a result, users clearly understand the KPI context before reviewing trends.
What Trend Charts Are Included?
The sheet shows MTD and YTD trend charts for:
-
Actual values
-
Target values
-
Previous year values
These charts help users identify:
-
Seasonal equipment usage patterns
-
Maintenance performance trends
-
Target achievement consistency
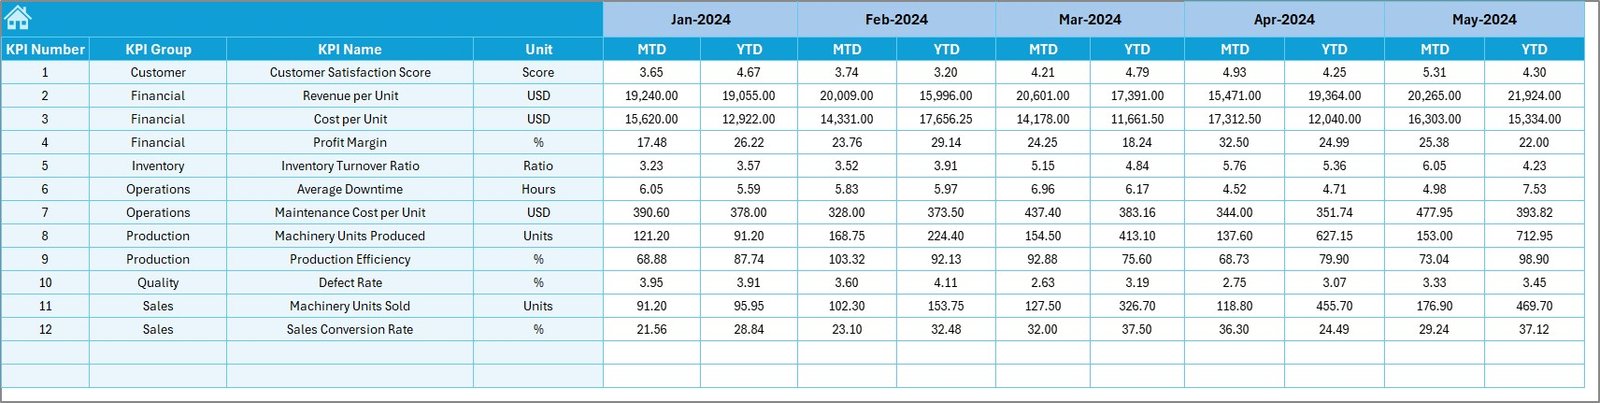
4. Actual Numbers Input Sheet: How Do You Enter Current Performance Data?
The Actual Numbers Input Sheet captures current-year machinery performance data.
How Does Month Control Work?
On cell E1, users enter the first month of the year. After that, they can change months easily while entering MTD and YTD values.
What Data Is Entered in This Sheet?
Users enter:
-
KPI Name
-
Month
-
MTD Actual values
-
YTD Actual values
Because the structure remains consistent, data accuracy improves significantly.
Click to Purchases Agricultural Machinery KPI Dashboard in Excel
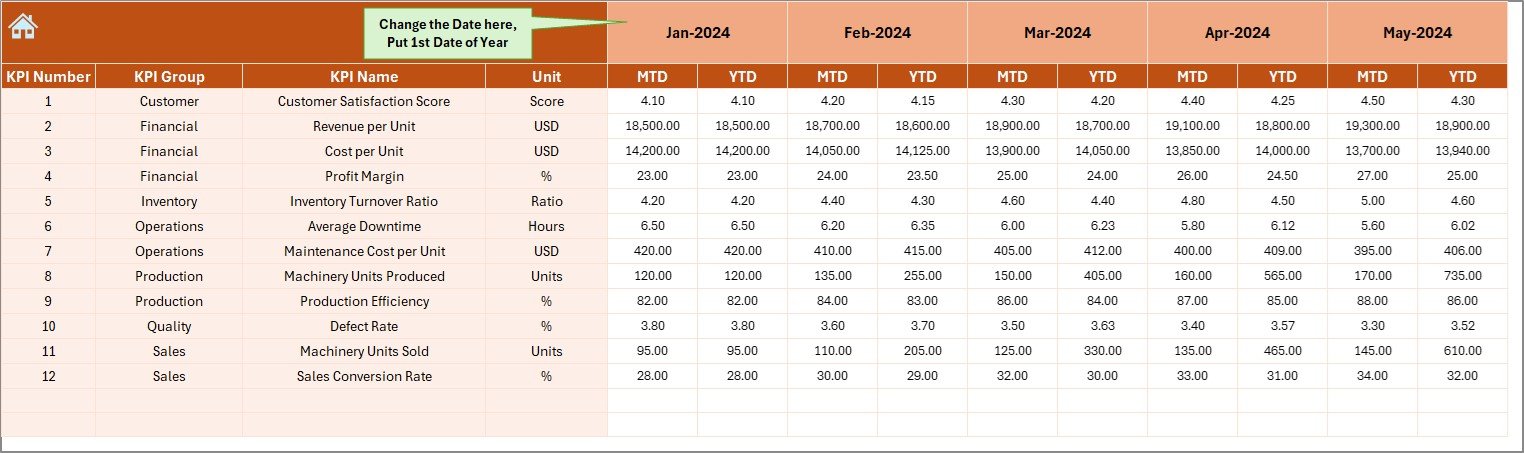
5. Target Sheet: How Are Machinery Performance Goals Defined?
The Target Sheet stores monthly and yearly performance targets.
What Values Are Entered?
Users enter:
-
KPI Name
-
Month
-
MTD Target values
-
YTD Target values
The dashboard then calculates Target vs Actual percentages automatically.
6. Previous Year Number Sheet: Why Is Historical Data Important?
The Previous Year Number Sheet stores last year’s machinery performance data.
How Does This Help?
Historical data allows teams to:
-
Compare year-over-year performance
-
Identify productivity improvements or declines
-
Set realistic future targets
Because the structure matches current-year data, comparisons remain accurate.
7. KPI Definition Sheet: Why Is This Sheet Critical?
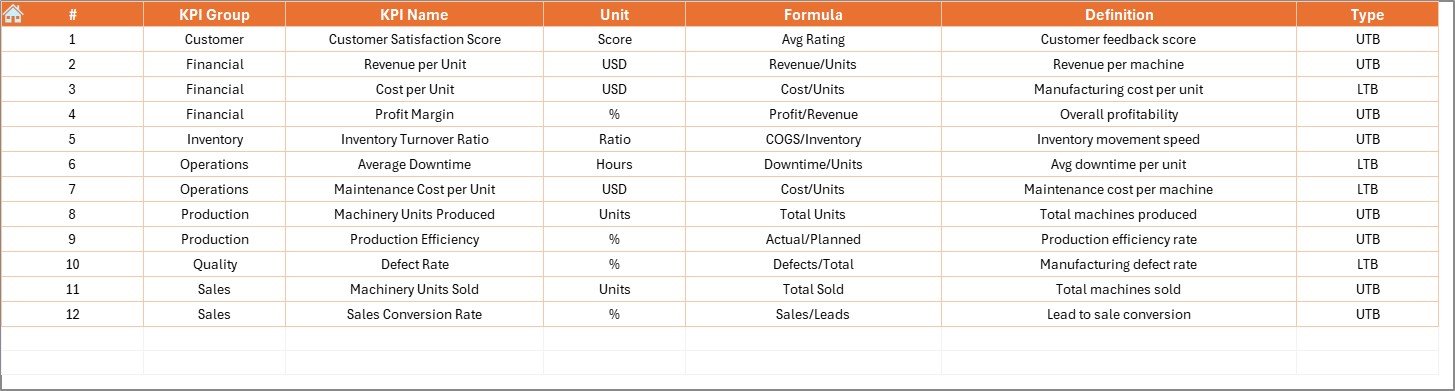
The KPI Definition Sheet acts as the foundation of the entire dashboard.
What Information Is Maintained Here?
-
KPI Name
-
KPI Group
-
Unit
-
Formula
-
KPI Definition
By clearly defining KPIs, organizations ensure consistent interpretation across teams.
Advantages of Agricultural Machinery KPI Dashboard in Excel
Using an Agricultural Machinery KPI Dashboard in Excel provides several key benefits.
1. Centralized Machinery Performance Tracking
All machinery KPIs stay available in one interactive dashboard.
2. Reduced Downtime
Early visibility into performance issues helps prevent unexpected breakdowns.
3. Improved Maintenance Planning
Trend analysis supports proactive maintenance scheduling.
4. Cost Control
Tracking efficiency and utilization helps reduce operating and repair costs.
5. Easy Adoption
Excel-based design ensures quick adoption without training overhead.
Click to Purchases Agricultural Machinery KPI Dashboard in Excel
Best Practices for the Agricultural Machinery KPI Dashboard in Excel
To get maximum value, follow these best practices.
Define KPIs Clearly
Always maintain accurate formulas and definitions in the KPI Definition sheet.
Keep KPI Names Consistent
Use the same KPI names across Actual, Target, and Previous Year sheets.
Update Data Regularly
Monthly updates ensure reliable MTD and YTD analysis.
Group KPIs Logically
Group KPIs such as Utilization, Maintenance, Fuel Efficiency, and Productivity.
Avoid Tracking Too Many KPIs
Focus only on KPIs that drive actionable decisions.
How Does This Dashboard Support Agricultural Business Growth?
An Agricultural Machinery KPI Dashboard in Excel supports growth by:
-
Improving equipment utilization
-
Reducing maintenance-related losses
-
Enhancing operational transparency
-
Supporting data-driven investment decisions
-
Increasing overall farm productivity
Because insights become visible and timely, management teams perform better consistently.
Conclusion: Why Should You Use an Agricultural Machinery KPI Dashboard in Excel?
An Agricultural Machinery KPI Dashboard in Excel transforms raw equipment data into actionable insights. It helps agricultural businesses track MTD and YTD performance, compare targets with actuals, and analyze trends with ease.
Moreover, its structured worksheet design, conditional formatting, and trend charts make it a practical, scalable, and cost-effective solution. In an industry where efficiency and reliability matter the most, this dashboard becomes an essential performance management tool.
Frequently Asked Questions (FAQs)
What is an Agricultural Machinery KPI Dashboard in Excel?
It is an Excel-based dashboard that tracks and analyzes key performance indicators related to agricultural equipment.
Who can use this dashboard?
Farm owners, machinery managers, agribusiness companies, and operations teams can use it.
What do MTD and YTD mean?
MTD means Month-to-Date, and YTD means Year-to-Date performance.
What is the difference between LTB and UTB KPIs?
LTB means Lower the Better, while UTB means Upper the Better.
How often should machinery data be updated?
Monthly updates work best for accurate performance tracking.
Can new machinery KPIs be added later?
Yes, users can add new KPIs by updating the KPI Definition and input sheets.
Does this dashboard support trend analysis?
Yes, it includes MTD and YTD trend charts for each KPI.
Is Excel sufficient for large agricultural operations?
Excel works well for most operations. Larger enterprises may later integrate BI tools.
Can this dashboard be customized?
Yes, the dashboard can be customized based on machinery type and business needs.
Why is KPI tracking important for agricultural machinery?
KPI tracking improves efficiency, reduces downtime, and supports better decision-making.
Click to Purchases Agricultural Machinery KPI Dashboard in Excel
Visit our YouTube channel to learn step-by-step video tutorials