Managing security incidents has become more complex than ever. Organizations face cyber threats, compliance risks, system vulnerabilities, and operational disruptions every day. Therefore, teams must track incidents, monitor risks, and respond quickly. However, when security data stays scattered across emails, logs, and multiple Excel files, decision-making slows down. As a result, risks increase and response quality drops.
That is exactly why a Security Dashboard in Excel plays a critical role in modern organizations.
A Security Dashboard in Excel converts raw incident data into meaningful visuals, KPIs, and trends. Because Excel remains widely used, flexible, and powerful, security teams can track performance without expensive tools. Moreover, Excel dashboards help leaders see the complete security picture at a glance and take action with confidence.
In this in-depth and SEO-friendly article, you will learn what a Security Dashboard in Excel is, how it works, what each dashboard page shows, its advantages, best practices, and frequently asked questions. Additionally, this guide uses simple language so anyone can understand and apply these insights easily.
Click to buy Security Dashboard in Excel
What Is a Security Dashboard in Excel?
A Security Dashboard in Excel is a ready-to-use analytical template built in Microsoft Excel. It visually tracks security incidents, resolution performance, impact costs, severity levels, and compliance metrics.
Instead of reviewing long tables of data, teams can instantly monitor:
- Total security incidents
- Open, closed, and resolved incidents
- Incident trends by type, severity, and location
- Estimated impact costs
- Compliance rates by teams
- Resolution efficiency
Because Excel supports pivot tables, charts, and slicers, users can filter data dynamically and focus on what matters most. As a result, security teams improve visibility, accountability, and response speed.
Why Do Organizations Need a Security Dashboard in Excel?
Security incidents can disrupt operations, damage reputation, and cause financial losses. Therefore, organizations must act quickly and decisively. However, without centralized reporting, teams struggle to identify priorities.
A Security Dashboard in Excel solves this problem because:
- It centralizes all security data in one place
- It highlights risks before they escalate
- It improves incident response coordination
- It supports compliance and audit readiness
- It enables data-driven security decisions
Moreover, Excel dashboards eliminate manual reporting and reduce dependency on complex tools. Consequently, teams save time and focus on prevention instead of firefighting.
How Does a Security Dashboard in Excel Work?
A Security Dashboard in Excel works by connecting structured incident data with pivot tables and charts. First, teams maintain a clean data sheet with incident details such as type, severity, status, location, and dates. Then, pivot tables summarize this data into KPIs. Finally, charts and cards visualize trends and performance.
Because Excel allows slicers and filters, users can easily analyze data by month, incident type, severity level, or location. Therefore, the dashboard remains interactive and insightful.
What Sheets Are Available in a Security Dashboard in Excel?
This ready-to-use Security Dashboard in Excel includes multiple analytical sheet tabs. Each sheet focuses on a specific aspect of security performance. Let us explore each one in detail.
Overview Sheet Show
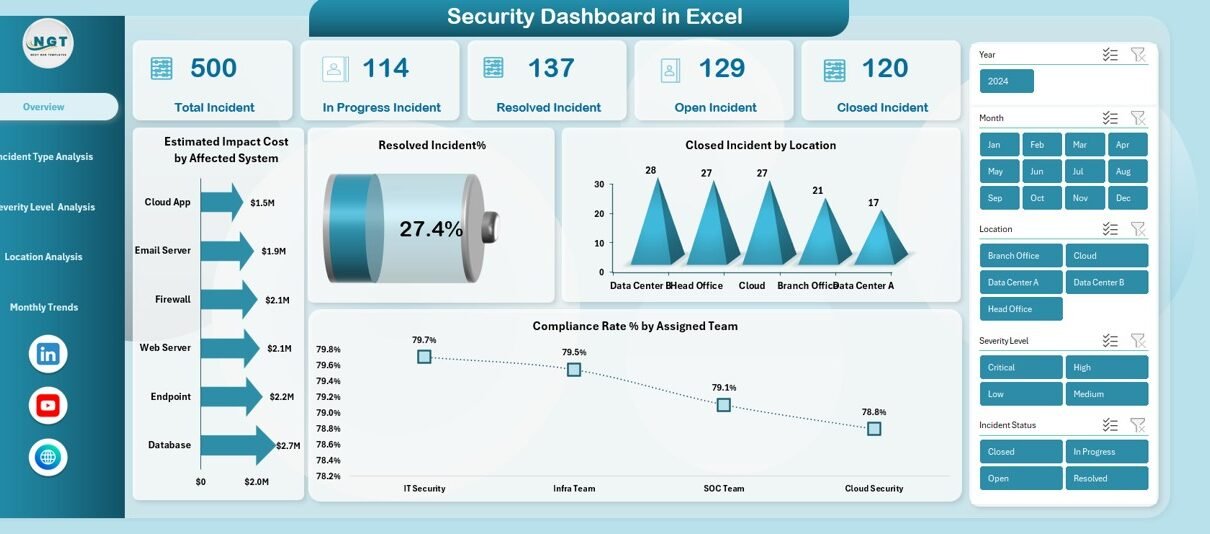
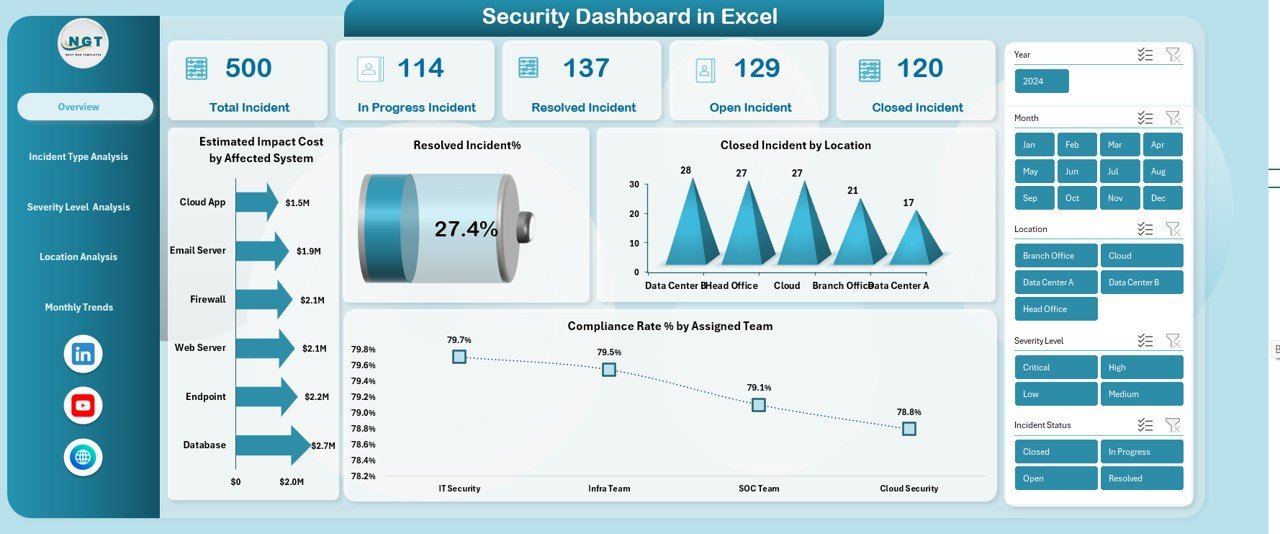
The Overview Sheet serves as the main page of the dashboard. It provides a high-level summary of security performance and incident status. Because decision-makers often need quick insights, this page focuses on key metrics.
Key KPIs on the Overview Sheet
- Total Incidents
Displays the total number of security incidents recorded. - In Progress Incidents
Shows incidents that teams are actively investigating or resolving. - Resolved Incidents
Highlights incidents that teams successfully fixed. - Open Incidents
Indicates unresolved or pending incidents that require attention.
Key Charts on the Overview Sheet
- Estimated Impact Cost by Affected System
Helps identify which systems create the highest financial risk. - Resolved Incident %
Measures how efficiently teams close incidents. - Closed Incidents by Location
Shows geographic distribution of resolved incidents. - Compliance Rate % by Assigned Team
Tracks how well teams follow security and compliance standards.
Because this page delivers instant clarity, leaders can quickly assess overall security health.
Click to buy Security Dashboard in Excel
Incident Type Analysis
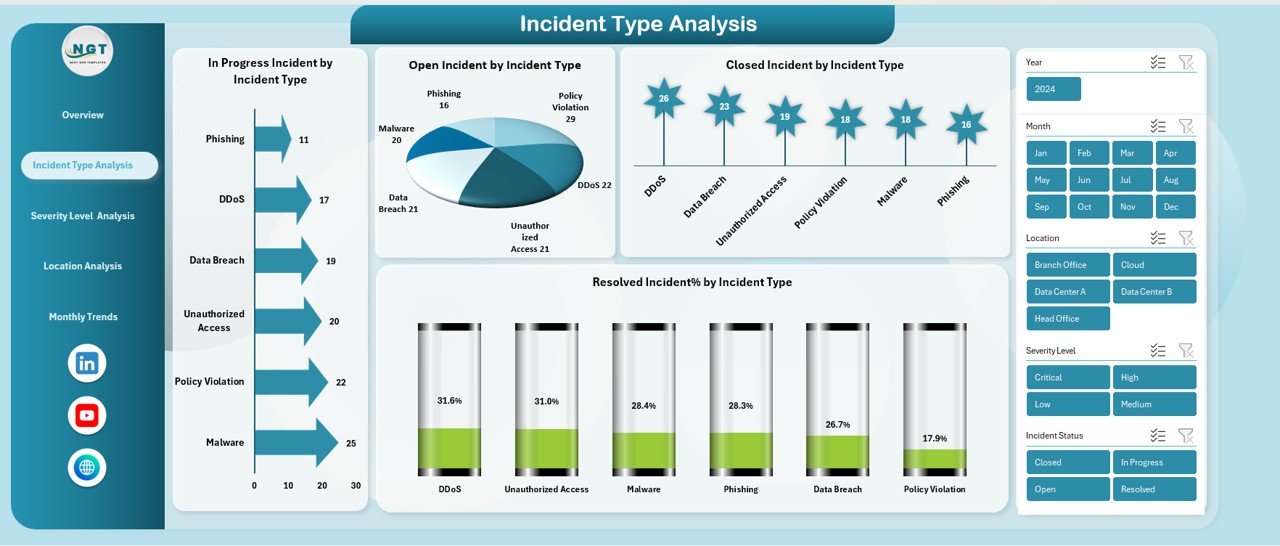
The Incident Type Analysis sheet focuses on understanding patterns across different incident categories. Because not all incidents carry the same risk, this analysis supports prioritization.
Key Insights from Incident Type Analysis
- In Progress Incidents by Incident Type
Identifies which types cause longer resolution cycles. - Open Incidents by Incident Type
Highlights risk areas that need immediate attention. - Closed Incidents by Incident Type
Shows which incident types teams handle effectively. - Resolved Incident % by Incident Type
Measures resolution success across categories.
By analyzing incident types, security teams can improve controls, update policies, and reduce recurring threats.
Click to buy Security Dashboard in Excel
Severity Level Analysis
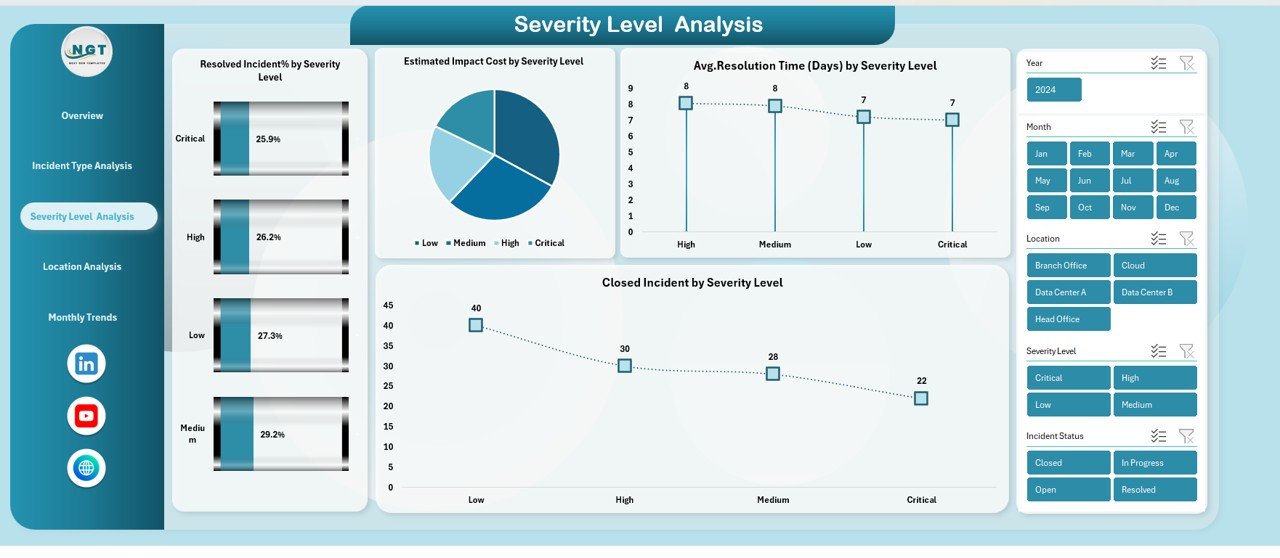
Severity defines the urgency and impact of security incidents. Therefore, Severity Level Analysis plays a crucial role in risk management.
Key Metrics in Severity Level Analysis
- Resolved Incident % by Severity Level
Shows how efficiently teams resolve critical, high, medium, and low incidents. - Estimated Impact Cost by Severity Level
Highlights which severity levels cause the highest financial losses. - Average Resolution Time (Days) by Severity Level
Measures how long teams take to resolve incidents at each severity. - Closed Incidents by Severity Level
Indicates workload distribution across severity levels.
Because this analysis links severity with cost and time, organizations can allocate resources more effectively.
Click to buy Security Dashboard in Excel
Location Analysis
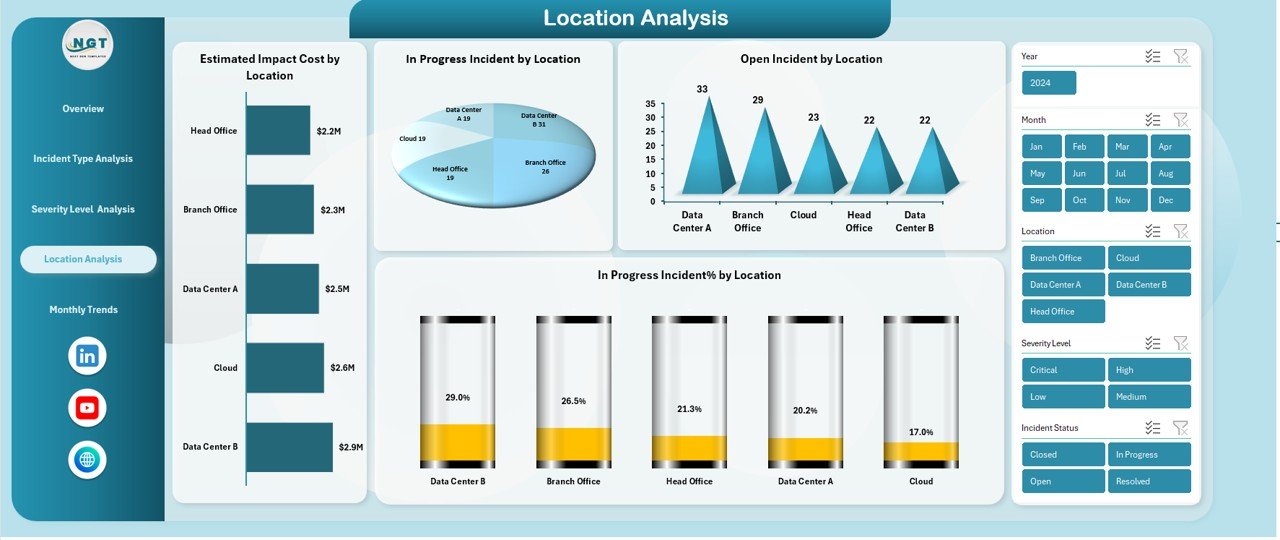
Security risks often vary by location due to infrastructure, regulations, or operational complexity. Therefore, the Location Analysis sheet provides valuable insights.
Key Charts in Location Analysis
- Estimated Impact Cost by Location
Identifies high-risk locations with higher financial exposure. - In Progress Incidents by Location
Shows where teams currently face active threats. - Open Incidents by Location
Highlights locations with unresolved risks. - In Progress Incident % by Location
Measures incident handling efficiency across regions.
With these insights, leaders can strengthen local controls and improve regional security strategies.
Click to buy Security Dashboard in Excel
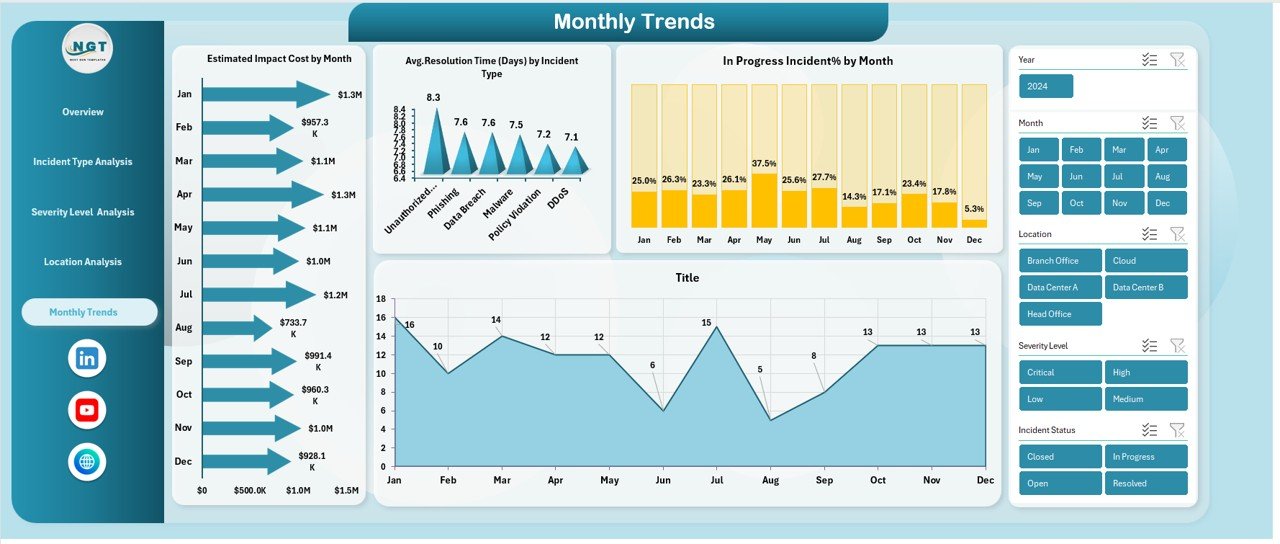
Monthly Trends
Trends help organizations move from reactive to proactive security management. Therefore, the Monthly Trends sheet focuses on time-based analysis.
Key Monthly Trend Metrics
- Estimated Impact Cost by Month
Reveals cost fluctuations and seasonal risk patterns. - Average Resolution Time (Days) by Incident Type
Tracks efficiency improvements or delays over time. - In Progress Incident % by Month
Monitors backlog trends and workload pressure.
Because trends highlight patterns, teams can forecast risks and plan preventive measures more effectively.
Click to buy Security Dashboard in Excel
Advantages of Security Dashboard in Excel
A Security Dashboard in Excel offers several strong advantages for organizations of all sizes.
Key Advantages
- Centralized Visibility
All security data stays in one dashboard. - Faster Decision-Making
Visual insights support quick actions. - Cost-Effective Solution
No need for expensive security tools. - Customizable Analysis
Modify KPIs, charts, and metrics easily. - Improved Compliance Tracking
Monitor compliance rates and audit readiness. - Better Team Accountability
Track performance by team and location.
Because Excel remains flexible and familiar, adoption becomes easy and fast.
Opportunities for Improvement in a Security Dashboard in Excel
Although Excel dashboards offer strong value, organizations can enhance them further.
Improvement Opportunities
- Add automated data refresh using Power Query
- Introduce role-based access controls
- Include SLA breach indicators
- Add trend-based alerts and thresholds
- Integrate incident root cause analysis
By implementing these improvements, teams can increase dashboard maturity and reliability.
Best Practices for the Security Dashboard in Excel
Following best practices ensures accuracy, usability, and long-term value.
Best Practices
- Keep data clean and standardized
- Use consistent incident status definitions
- Limit the number of KPIs per page
- Use clear labels and readable charts
- Update data regularly
- Validate formulas and pivot tables
- Protect sheets with passwords
Because good practices improve trust, decision-makers rely more on the dashboard.
Who Can Use a Security Dashboard in Excel?
A Security Dashboard in Excel supports many roles across the organization.
Key Users
- Security Managers
- IT Operations Teams
- Risk and Compliance Officers
- Audit Teams
- Senior Management
- Business Continuity Teams
Because the dashboard uses simple visuals, both technical and non-technical users benefit.
How Does a Security Dashboard in Excel Support Compliance and Audits?
Compliance requires proof, documentation, and performance tracking. Therefore, Excel dashboards simplify audits.
They help organizations:
- Track compliance rates by team
- Maintain incident resolution history
- Demonstrate response effectiveness
- Provide visual audit evidence
As a result, audit preparation becomes faster and less stressful.
Conclusion: Why a Security Dashboard in Excel Is a Smart Choice
A Security Dashboard in Excel transforms raw security data into actionable intelligence. It improves visibility, strengthens accountability, and supports proactive risk management. Moreover, because Excel remains flexible and accessible, organizations can deploy this dashboard quickly without high costs.
By tracking incidents, severity, locations, and trends, teams gain control over security operations. Therefore, a Security Dashboard in Excel becomes an essential tool for modern, data-driven organizations.
Frequently Asked Questions (FAQs)
What is a Security Dashboard in Excel used for?
A Security Dashboard in Excel helps organizations track security incidents, risks, costs, and compliance performance in a visual and centralized way.
Can small businesses use a Security Dashboard in Excel?
Yes, small businesses benefit greatly because Excel dashboards offer powerful insights without expensive software.
How often should a Security Dashboard in Excel be updated?
Teams should update the dashboard daily or weekly, depending on incident volume and risk level.
Does a Security Dashboard in Excel require advanced Excel skills?
No, basic Excel knowledge works well. However, pivot tables and charts improve dashboard effectiveness.
Can I customize a Security Dashboard in Excel?
Yes, Excel dashboards are fully customizable. You can add KPIs, charts, and filters as needed.
Is a Security Dashboard in Excel suitable for audits?
Absolutely. It provides clear documentation, trends, and compliance tracking for audits.
Visit our YouTube channel to learn step-by-step video tutorials
Watch the step-by-step video tutorial:
Click to buy Security Dashboard in Excel