E-logistics startups operate in a fast-moving, data-driven environment. Every delivery, warehouse movement, customer interaction, and cost decision directly affects profitability and growth. Therefore, startups must track performance continuously and act quickly on insights. However, many e-logistics teams still depend on scattered Excel files, manual reports, or delayed summaries. As a result, leaders struggle to understand what works and what needs improvement.E-logistics Startups KPI Dashboard in Excel
That is exactly why an E-Logistics Startups KPI Dashboard in Excel becomes a powerful performance management solution.
In this comprehensive and SEO-friendly guide, you will learn what an E-Logistics Startups KPI Dashboard in Excel is, why it matters, how it works, and how each worksheet supports data-driven decisions. Moreover, this article explains the advantages, best practices, and frequently asked questions so you can confidently use this dashboard to scale your e-logistics operations.E-logistics Startups KPI Dashboard in Excel
Click to buy E-logistics Startups KPI Dashboard in Excel
What Is an E-Logistics Startups KPI Dashboard in Excel?
An E-Logistics Startups KPI Dashboard in Excel is a structured and interactive Excel-based tool designed to track, analyze, and visualize key performance indicators related to digital logistics operations.E-logistics Startups KPI Dashboard in Excel
Instead of managing multiple spreadsheets for operations, finance, delivery, and customer service, this dashboard consolidates all KPIs into one centralized system. As a result, founders, operations managers, and analysts gain instant visibility into operational health.E-logistics Startups KPI Dashboard in Excel
Because Excel remains familiar and flexible, startups can adopt this dashboard quickly without investing in complex BI tools. Moreover, Excel dashboards allow complete control over formulas, KPIs, and visual formats.E-logistics Startups KPI Dashboard in Excel
Why Do E-Logistics Startups Need a KPI Dashboard?
E-logistics startups grow fast, but growth without control creates inefficiencies. Therefore, tracking KPIs becomes essential.
Here is why a KPI dashboard matters:
- First, it provides real-time performance visibility
- Second, it highlights delivery delays and cost overruns
- Third, it supports faster and smarter decisions
- Moreover, it aligns teams around measurable goals
- Finally, it improves investor and stakeholder reporting
Without a centralized dashboard, teams react late. However, with a KPI dashboard, leaders act early.
Which KPIs Matter Most for E-Logistics Startups?
Every startup focuses on different priorities. Still, most e-logistics KPIs fall into the following categories:E-logistics Startups KPI Dashboard in Excel
Operational KPIs
- On-time delivery percentage
- Average delivery time
- Order fulfillment rate
- Failed delivery rate
Financial KPIs
- Cost per delivery
- Revenue per order
- Gross margin
- Operating cost variance
Warehouse KPIs
- Order picking accuracy
- Inventory turnover
- Storage utilization
- Stock-out rate
Customer Experience KPIs
- Customer satisfaction score
- Complaint resolution time
- Return rate
The KPI Definition sheet in the dashboard ensures clarity and consistency across teams.
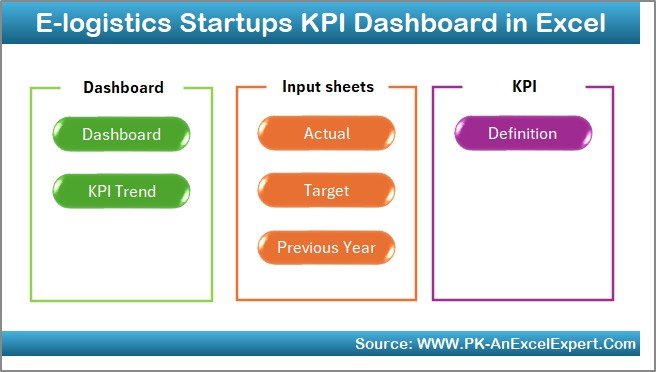
How Does the E-Logistics KPI Dashboard in Excel Work?
This dashboard follows a logical and user-friendly structure. Each worksheet plays a specific role, while all sheets connect dynamically.
Let us explore each worksheet in detail.
Summary Page
The Summary Page works as the index and navigation hub of the dashboard.
Key Highlights of the Summary Page
- Provides buttons to jump to key sheets
- Acts as a landing page for users
- Improves usability and navigation
- Makes the dashboard beginner-friendly
Because startups often involve multiple users, this summary page ensures everyone finds the right information quickly.
Click to buy E-logistics Startups KPI Dashboard in Excel
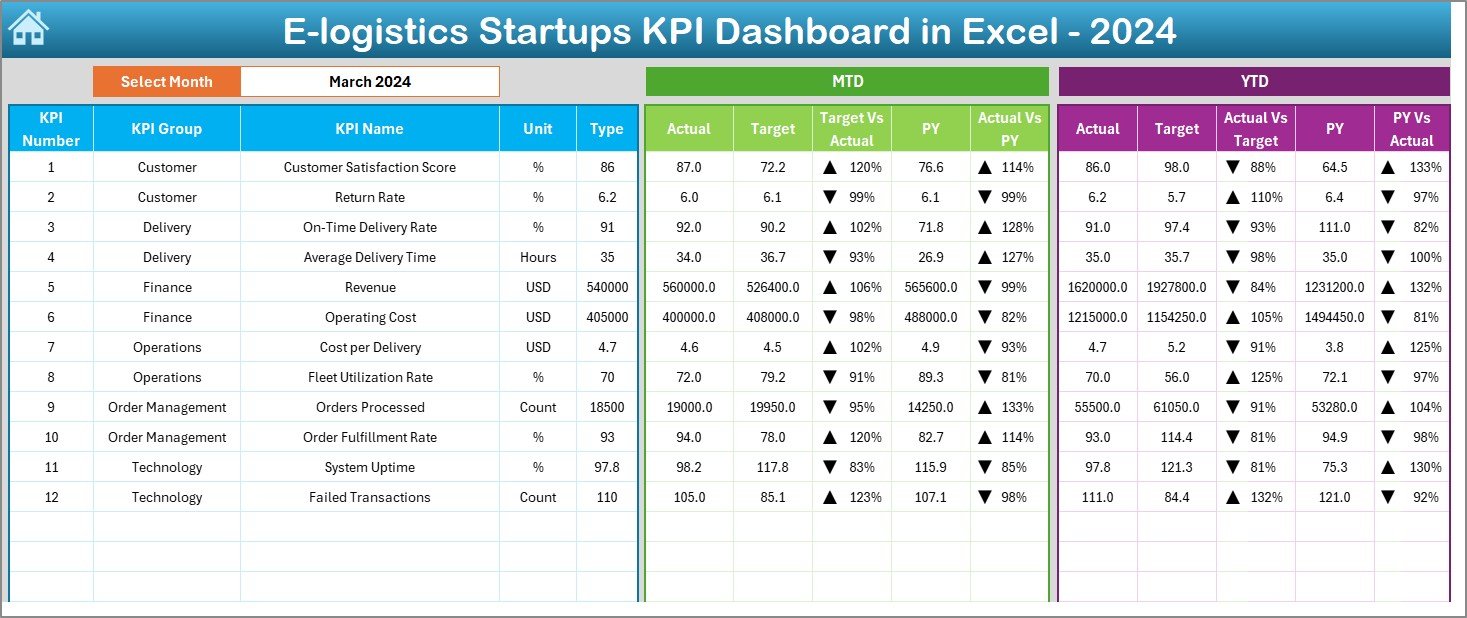
Dashboard Sheet
The Dashboard sheet serves as the core analytical page.
Key Features of the Dashboard Sheet
- Month selector available at cell D3
- Automatically updates all visuals based on selected month
- Displays both MTD (Month-to-Date) and YTD (Year-to-Date) metrics
Metrics Shown on the Dashboard
- MTD Actual vs Target
- MTD Actual vs Previous Year
- YTD Actual vs Target
- YTD Actual vs Previous Year
Additionally, the dashboard uses conditional formatting arrows to highlight performance direction. Therefore, users instantly identify whether KPIs improve or decline.
Click to buy E-logistics Startups KPI Dashboard in Excel
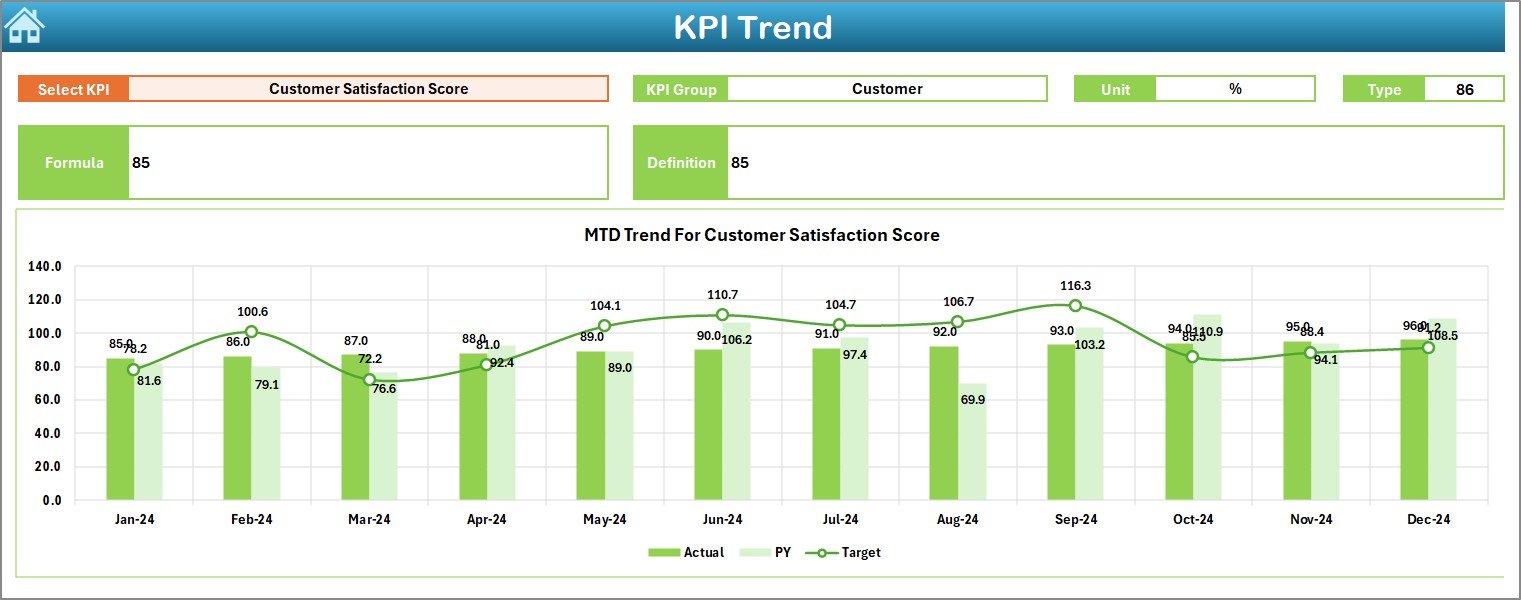
Trend Sheet
The Trend Sheet focuses on deep KPI analysis.
Key Functionalities of the Trend Sheet
- KPI selector at cell C3
- Displays KPI Group, Unit, Type, Formula, and Definition
- Shows both MTD and YTD trend charts
Why Trend Analysis Matters
Trend analysis helps startups:
- Identify seasonal patterns
- Detect performance improvement or decline
- Compare targets against actuals over time
Because trends tell stories, this sheet becomes essential for strategic planning.
Click to buy E-logistics Startups KPI Dashboard in Excel
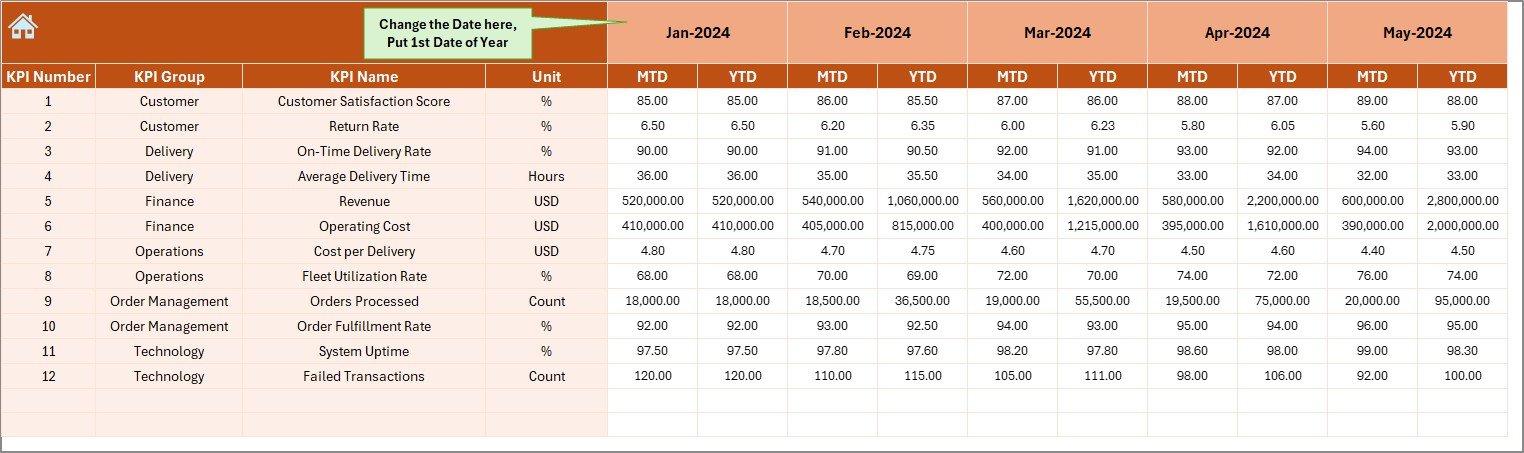
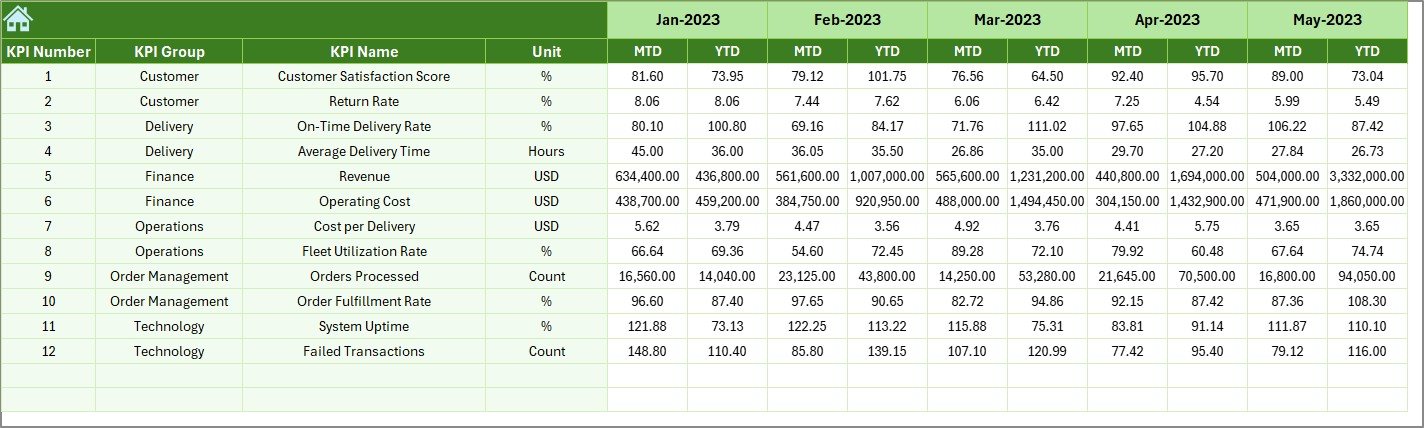
Actual Numbers Input Sheet
The Actual Numbers Input Sheet captures real performance data.
How This Sheet Works
- Select the first month of the year in cell E1
- Enter MTD and YTD actual values for each KPI
- The dashboard updates automatically
This design reduces errors and ensures consistency across months.
Click to buy E-logistics Startups KPI Dashboard in Excel
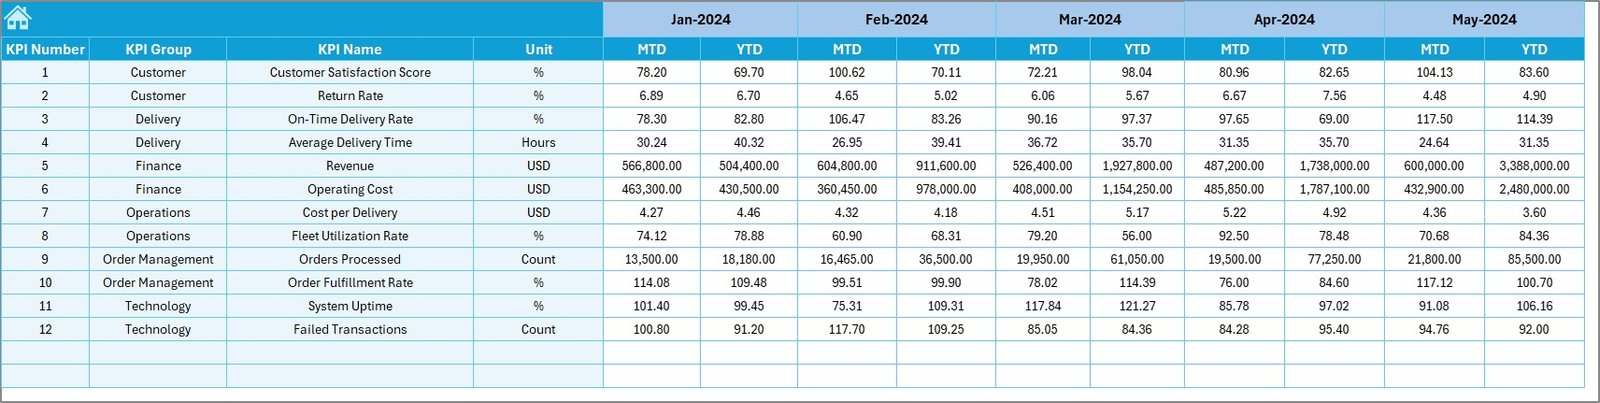
Target Sheet
The Target Sheet defines performance expectations.
Key Responsibilities of the Target Sheet
- Stores monthly MTD targets
- Stores cumulative YTD targets
- Enables gap analysis
Because targets guide performance, this sheet ensures accountability across teams.
Click to buy E-logistics Startups KPI Dashboard in Excel
Previous Year Number Sheet
The Previous Year Number Sheet enables historical comparison.
Benefits of Previous Year Comparison
- Measures growth or decline
- Highlights operational improvements
- Supports realistic target setting
By comparing current performance with last year, startups gain valuable perspective.
Click to buy E-logistics Startups KPI Dashboard in Excel
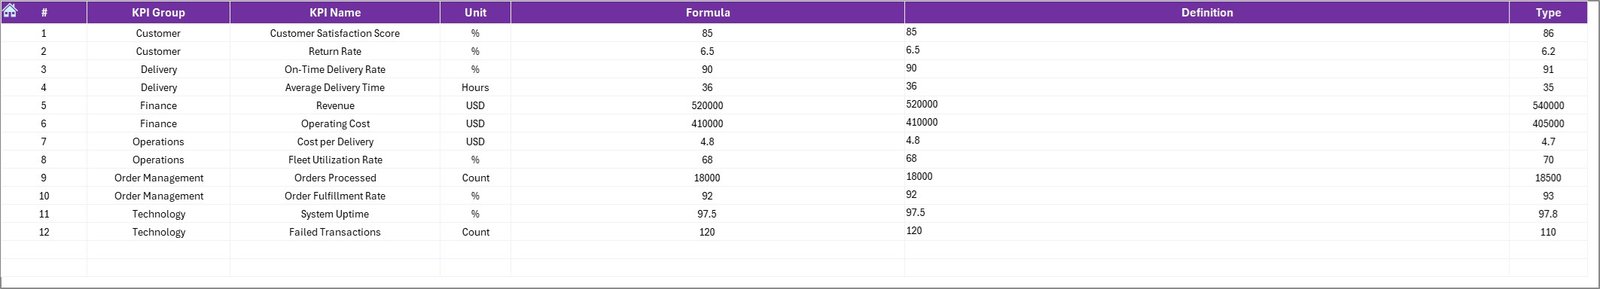
KPI Definition Sheet
The KPI Definition Sheet acts as the backbone of the dashboard.
What This Sheet Contains
- KPI Name
- KPI Group
- Unit of Measurement
- Formula
- Definition
- KPI Type (LTB or UTB)
Because clarity drives accuracy, this sheet prevents confusion and misinterpretation.
Click to buy E-logistics Startups KPI Dashboard in Excel
Advantages of E-Logistics Startups KPI Dashboard in Excel
Using this dashboard delivers several strategic advantages.
Centralized Performance Tracking
All KPIs remain in one place. Therefore, teams save time and avoid data silos.
Better Decision-Making
Clear visuals and trends support faster decisions.
Improved Operational Efficiency
The dashboard highlights bottlenecks and inefficiencies quickly.
Cost Control and Profitability
Tracking cost-related KPIs helps startups control expenses.
Scalability
Startups can easily add new KPIs as operations expand.
No Additional Software Cost
Excel works without expensive licenses or integrations.
How Does This Dashboard Support Startup Growth?
Startups grow in stages. Therefore, performance tracking must evolve.
This dashboard supports growth by:
- Standardizing KPI measurement
- Supporting data-driven investor discussions
- Improving operational discipline
- Enabling performance benchmarking
As startups mature, they can also integrate this dashboard with Power BI or other tools.
Best Practices for the E-Logistics Startups KPI Dashboard in Excel
To get the best results, follow these proven best practices.
Define KPIs Clearly
Always maintain clear formulas and definitions.
Update Data Regularly
Daily or weekly updates improve accuracy.
Avoid Too Many KPIs
Focus on what truly matters.
Review Trends Monthly
Trends reveal insights that snapshots miss.
Train Team Members
Ensure users understand how to read the dashboard.
Maintain Data Validation
Use dropdowns and controls to reduce errors.
How Does This Dashboard Improve Team Alignment?
This dashboard creates a single source of truth. As a result:
- Operations teams focus on delivery KPIs
- Finance teams monitor cost and margin KPIs
- Leadership tracks overall performance
Because everyone sees the same data, alignment improves naturally.
Can This Dashboard Support Investor Reporting?
Yes, absolutely.
Founders can:
- Share KPI snapshots with investors
- Demonstrate operational discipline
- Show performance trends and improvements
Therefore, this dashboard becomes a strategic reporting tool.
Conclusion: Why Every E-Logistics Startup Needs This Dashboard
E-logistics startups operate under constant pressure to deliver faster, cheaper, and better. Without structured performance tracking, growth becomes risky.
The E-Logistics Startups KPI Dashboard in Excel offers a practical, affordable, and powerful solution. It centralizes KPIs, improves visibility, and supports data-driven decisions. Moreover, its structured worksheets ensure clarity, accuracy, and scalability.
By using this dashboard consistently, startups gain control over operations and confidence in growth.
Frequently Asked Questions (FAQs)
What is an E-Logistics KPI Dashboard in Excel?
It is an Excel-based tool that tracks and visualizes key logistics performance indicators for startups.
Who should use this dashboard?
Founders, operations managers, analysts, and logistics teams benefit most.
Can I customize KPIs in this dashboard?
Yes, you can easily add or modify KPIs using the KPI Definition sheet.
Does this dashboard support monthly and yearly analysis?
Yes, it supports both MTD and YTD analysis with trend charts.
Do I need advanced Excel skills to use it?
No. Basic Excel knowledge is enough to operate this dashboard.
Can this dashboard scale as my startup grows?
Yes. The flexible structure allows easy expansion.
Visit our YouTube channel to learn step-by-step video tutorials
Watch the step-by-step video tutorial:
Click to buy E-logistics Startups KPI Dashboard in Excel