Knowledge Process Outsourcing (KPO) organizations operate in highly specialized, data-intensive, and outcome-driven environments. They deliver research, analytics, financial modeling, legal support, market intelligence, and advanced consulting services to global clients. Therefore, performance tracking cannot rely on intuition or fragmented reports.
That is exactly why a Knowledge Process Outsourcing (KPO) KPI Dashboard in Excel becomes a critical management tool.
Knowledge Process Outsourcing (KPO) KPI Dashboard in Excel This detailed, SEO-friendly guide explains what a KPO KPI Dashboard in Excel is, why it is essential, how it works, and how each worksheet supports operational excellence. Moreover, you will learn about its advantages, best practices, and frequently asked questions so that you can confidently implement it in your organization.
Click to Purchases Knowledge Process Outsourcing (KPO) KPI Dashboard in Excel
What Is a Knowledge Process Outsourcing (KPO) KPI Dashboard in Excel?
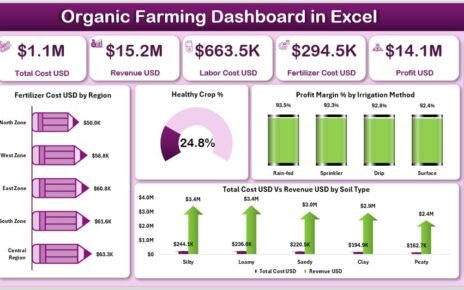
A Knowledge Process Outsourcing (KPO) KPI Dashboard in Excel is a ready-to-use performance management tool that tracks, analyzes, and visualizes key performance indicators related to productivity, quality, delivery, cost efficiency, and client satisfaction.
Instead of reviewing multiple Excel files or manual reports, this dashboard consolidates all KPIs into a single, structured workbook built in Microsoft Excel.
As a result, leadership teams gain:
-
Clear visibility into service delivery performance
-
Accurate MTD and YTD tracking
-
Easy comparison with targets and previous-year benchmarks
Why Do KPO Organizations Need a KPI Dashboard?
KPO services depend heavily on skilled talent, accuracy, timelines, and client outcomes. However, without structured KPI tracking, organizations often face performance blind spots.
Because of that, many KPO firms struggle with:
-
Delayed performance reviews
-
Inconsistent KPI definitions
-
Difficulty tracking productivity and quality together
-
Limited visibility into trends across months and years
A KPO KPI Dashboard in Excel solves these challenges by delivering centralized reporting, clear performance indicators, and actionable insights.
How Does a KPO KPI Dashboard in Excel Work?
The dashboard combines manual data input with automated Excel calculations and visuals.
Workflow Overview
-
Users enter actual, target, and previous-year KPI values
-
Excel formulas calculate MTD, YTD, and variances
-
Dashboards update automatically based on selected month
-
Teams analyze performance and take corrective actions
Therefore, teams spend less time preparing reports and more time improving service quality.
Click to Purchases Knowledge Process Outsourcing (KPO) KPI Dashboard in Excel
What Worksheets Are Included in the KPO KPI Dashboard in Excel?
The dashboard contains 7 structured worksheets, each designed for a specific role in performance management.
1) Home Sheet: How Does It Improve Navigation and Usability?
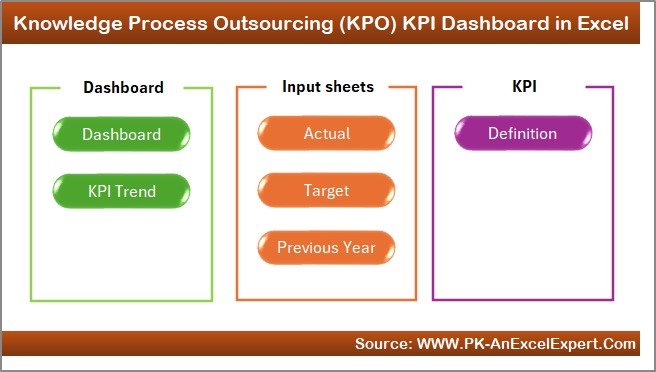
The Home Sheet acts as the index page of the dashboard.
Key Features
-
Six navigation buttons
-
Direct access to all major worksheets
-
Simple, user-friendly layout
Because of this design, managers and executives can move across reports quickly without technical complexity.
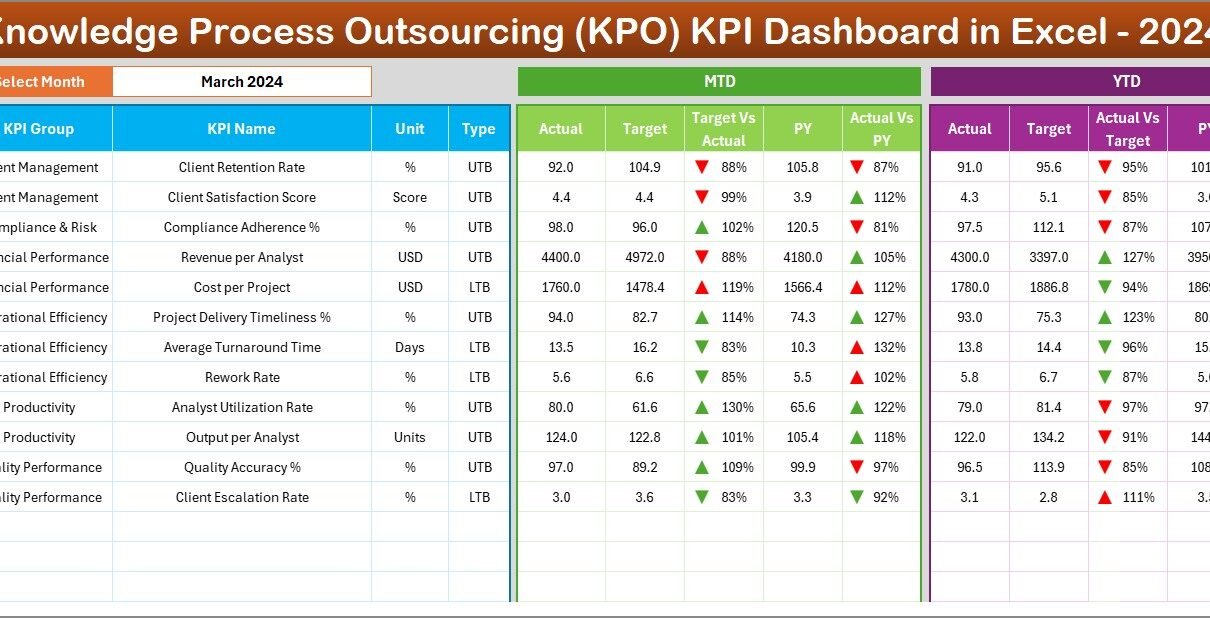
2) Dashboard Sheet: How Does It Provide a Complete KPI Overview?
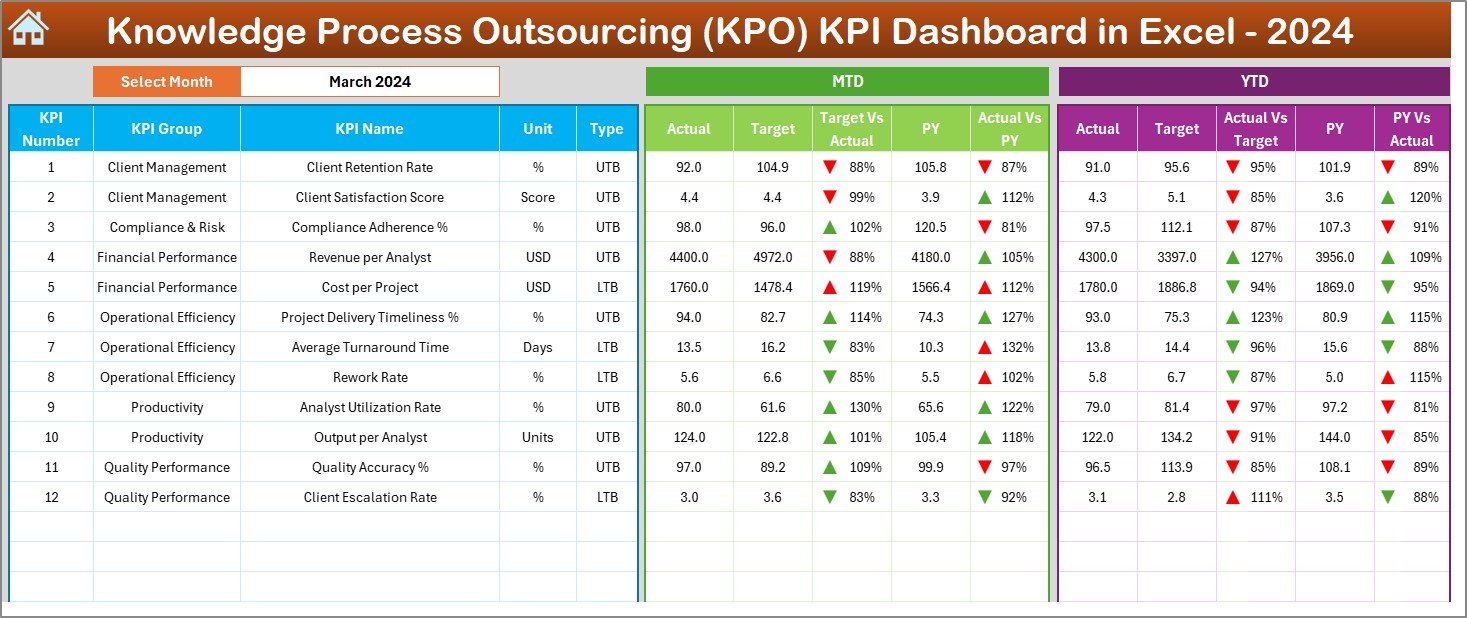
The Dashboard Sheet is the core analytical page of the workbook.
Month Selection
Users can select the reporting month from cell D3. Once the month changes, the entire dashboard refreshes automatically.
KPIs Displayed on the Dashboard
The dashboard shows both Month-to-Date (MTD) and Year-to-Date (YTD) performance, which ensures balanced analysis.
Month-to-Date (MTD) Metrics
-
Actual MTD
-
Target MTD
-
Previous Year MTD
-
Target vs Actual %
-
PY vs Actual %
-
Conditional formatting arrows (▲ green / ▼ red)
These indicators help managers quickly identify short-term performance gaps.
Year-to-Date (YTD) Metrics
-
Actual YTD
-
Target YTD
-
Previous Year YTD
-
Target vs Actual %
-
PY vs Actual %
-
Conditional formatting arrows (▲ green / ▼ red)
Because of YTD metrics, leadership can evaluate long-term progress toward strategic goals.
Why Conditional Formatting Matters
Conditional arrows immediately highlight:
-
KPIs meeting or exceeding targets
-
KPIs that require corrective action
As a result, managers can prioritize attention effectively.
3) KPI Trend Sheet: How Can You Analyze KPI Behavior Over Time?
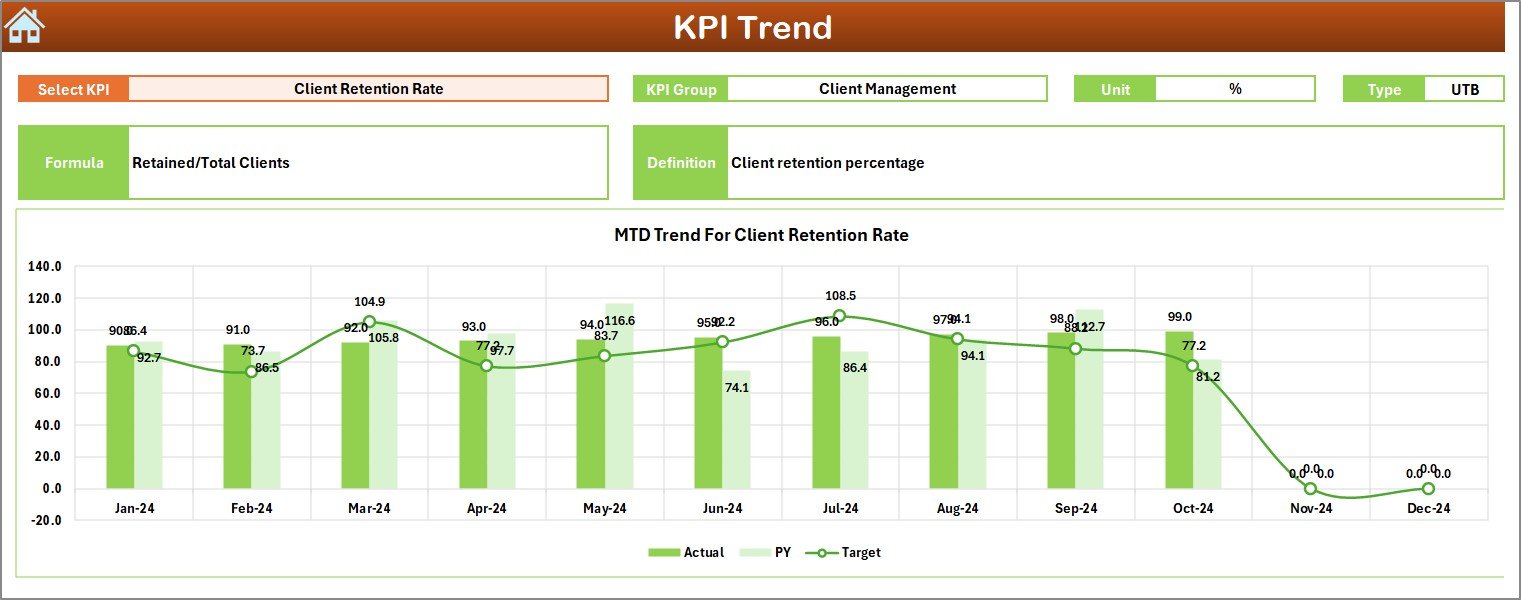
The KPI Trend Sheet supports deep-dive analysis for individual KPIs.
KPI Selection
Users select a KPI name from the drop-down list available in cell C3.
KPI Details Displayed
Once selected, the sheet shows:
-
KPI Group
-
Unit of Measurement
-
KPI Type (Lower the Better or Upper the Better)
-
KPI Formula
-
KPI Definition
This information ensures KPI clarity and alignment across teams.
Trend Charts
The sheet displays MTD and YTD trend charts for:
-
Actual values
-
Target values
-
Previous year values
Therefore, users can identify:
-
Performance improvement patterns
-
Seasonal workload changes
-
Long-term productivity trends
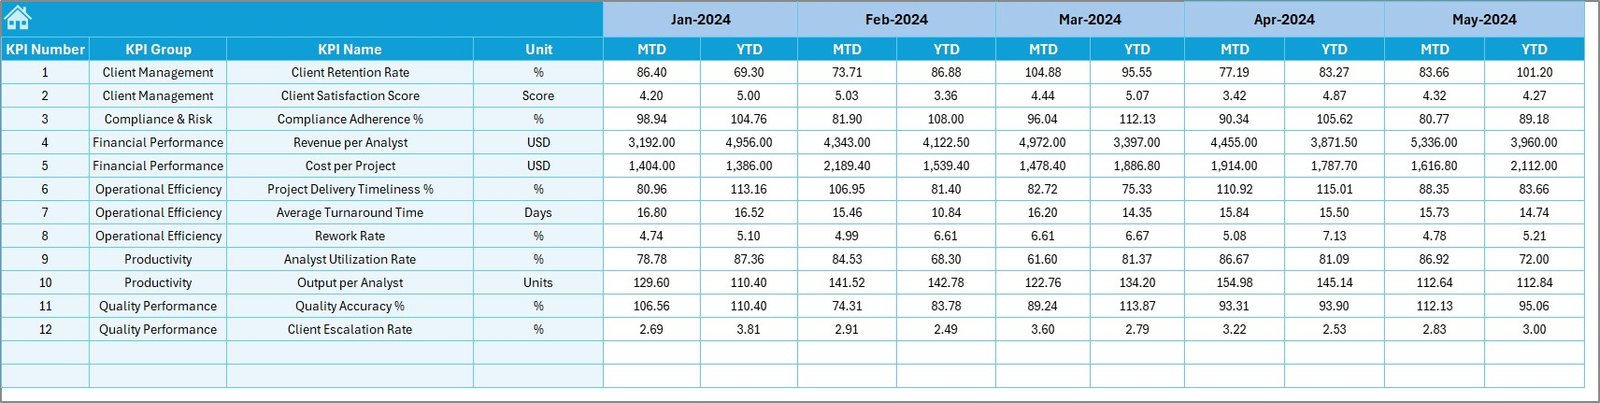
4) Actual Numbers Input Sheet: How Do You Enter Data Correctly?
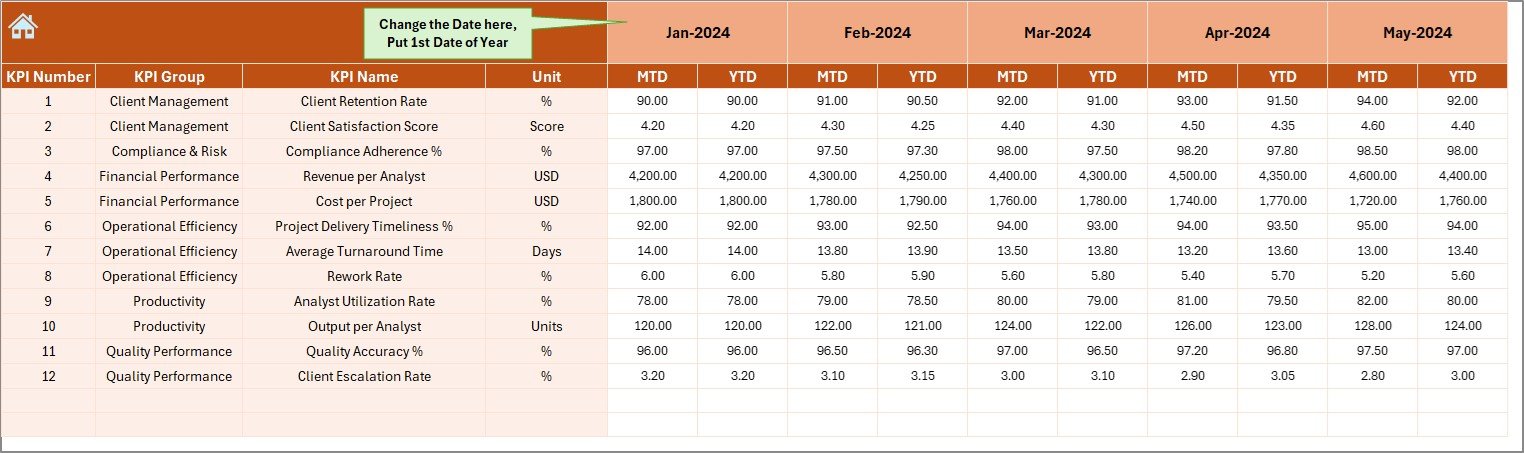
The Actual Numbers Input Sheet captures current-year performance data.
How It Works
-
Enter MTD and YTD actual values for each KPI
-
Control reporting months from cell E1
-
Always enter the first month of the year in E1
Because of this structure, all calculations remain accurate throughout the year.
Click to Purchases Knowledge Process Outsourcing (KPO) KPI Dashboard in Excel
5) Target Sheet: How Are Performance Goals Defined?
The Target Sheet stores KPI benchmarks.
What You Enter
-
KPI-wise monthly targets
-
MTD target values
-
YTD target values
This setup allows the dashboard to calculate Target vs Actual performance automatically.
6) Previous Year Number Sheet: Why Is Historical Comparison Important?
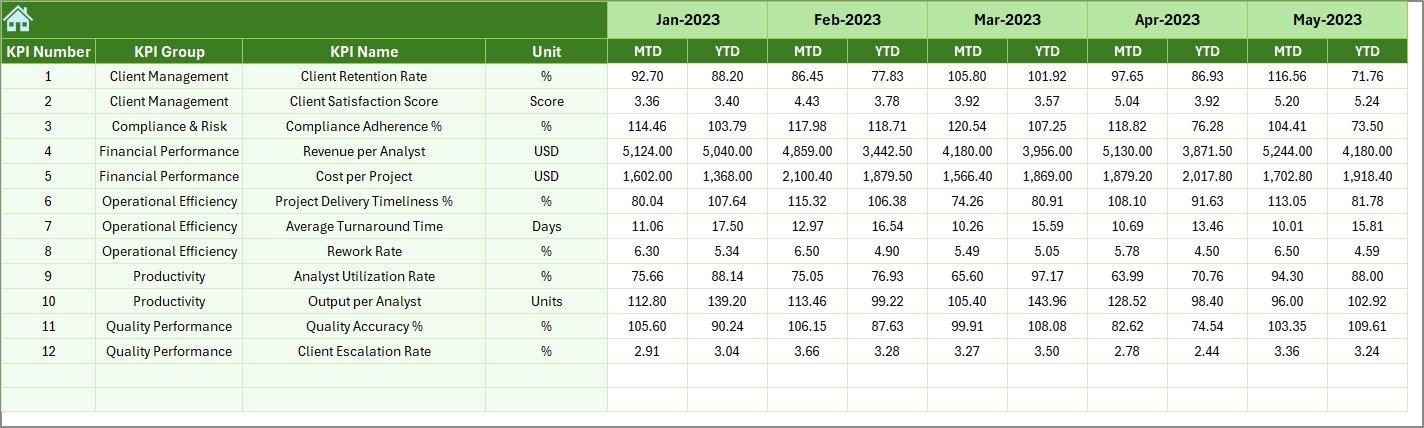
The Previous Year Number Sheet captures last year’s KPI values.
Why This Matters
-
Enables year-over-year performance comparison
-
Highlights improvement or decline
-
Supports strategic planning and forecasting
Because of PY comparison, leadership can assess whether process improvements deliver real impact.
7) KPI Definition Sheet: Why Is KPI Standardization Critical in KPO?
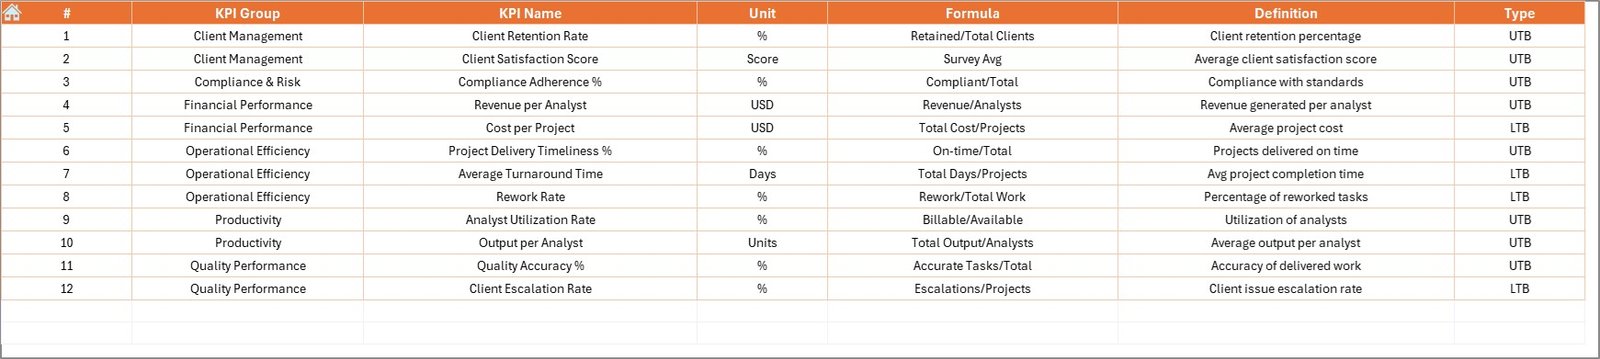
The KPI Definition Sheet defines every KPI clearly.
Fields Included
-
KPI Name
-
KPI Group
-
Unit
-
Formula
-
KPI Definition
This sheet ensures consistent understanding of KPIs across analysts, managers, and leadership.
What KPIs Can a KPO Dashboard Track?
A KPO KPI Dashboard in Excel can track KPIs across multiple dimensions, such as:
-
Productivity per analyst
-
Turnaround time
-
Quality accuracy rate
-
Rework percentage
-
Utilization rate
-
Cost per deliverable
-
Client satisfaction score
-
SLA adherence
You can easily extend the dashboard as services expand.
Advantages of Knowledge Process Outsourcing (KPO) KPI Dashboard in Excel
Why Should KPO Organizations Use This Dashboard?
📊 Centralized Performance Tracking
All KPIs remain in one structured workbook.
⏱ Faster Performance Reviews
MTD and YTD insights become instantly available.
🎯 Clear Target Monitoring
Target vs Actual comparisons highlight gaps early.
📈 Strong Trend Visibility
Trend charts reveal long-term performance patterns.
🔍 Improved KPI Transparency
Clear definitions reduce misinterpretation.
💼 Better Client Delivery Outcomes
Data-driven insights improve service quality and consistency.
How Does a KPO KPI Dashboard Improve Operational Efficiency?
Because the dashboard replaces manual reporting, teams can:
-
Reduce reporting effort
-
Improve accuracy
-
Focus on value-added analysis
-
Respond quickly to performance issues
As a result, operational efficiency improves across projects and teams.
Best Practices for the Knowledge Process Outsourcing (KPO) KPI Dashboard in Excel
How Can You Maximize Dashboard Effectiveness?
✔ Standardize KPI Definitions
Ensure formulas and units remain consistent.
✔ Update Data on a Fixed Schedule
Monthly updates maintain reporting discipline.
✔ Review MTD and YTD Together
Short-term performance should align with long-term goals.
✔ Monitor LTB and UTB KPIs Carefully
Interpret KPI direction correctly to avoid wrong conclusions.
✔ Train Stakeholders
Ensure teams understand how to read and use the dashboard.
✔ Validate Data Before Reviews
Accurate input leads to reliable decisions.
Click to Purchases Knowledge Process Outsourcing (KPO) KPI Dashboard in Excel
Who Can Benefit from a KPO KPI Dashboard in Excel?
This dashboard is ideal for:
-
KPO service providers
-
Research and analytics firms
-
Consulting organizations
-
Shared service centers
-
Operations managers
-
Strategy and planning teams
Because it runs on Excel, both small firms and large enterprises can use it effectively.
How Does This Dashboard Support Client Satisfaction?
By tracking productivity, quality, and turnaround KPIs together, teams can:
-
Identify delivery risks early
-
Maintain SLA compliance
-
Improve consistency
-
Strengthen client trust
As a result, client satisfaction improves steadily.
Conclusion: Why Is a KPO KPI Dashboard in Excel a Strategic Asset?
A Knowledge Process Outsourcing (KPO) KPI Dashboard in Excel transforms complex service data into clear, actionable insights. It enables better performance tracking, stronger accountability, and smarter decision-making.
By combining structured data input with interactive dashboards, KPO organizations can improve productivity, maintain quality, and achieve sustainable growth.
In a knowledge-driven services environment, this dashboard is not just helpful—it is essential.
Frequently Asked Questions (FAQs)
What is the main purpose of a KPO KPI Dashboard in Excel?
It helps track productivity, quality, and delivery KPIs against targets and previous-year benchmarks.
Do I need advanced Excel skills to use this dashboard?
No. Basic Excel knowledge is sufficient for data entry and analysis.
Can I customize KPIs in the dashboard?
Yes. You can easily add, remove, or modify KPIs.
How often should I update the dashboard?
Most organizations update it monthly, but weekly updates also work.
Is this dashboard suitable for large KPO firms?
Yes. The structure supports both small teams and large enterprises.
Can this dashboard support management reporting?
Yes. It provides clear, executive-ready performance insights.
Click to Purchases Knowledge Process Outsourcing (KPO) KPI Dashboard in Excel
Visit our YouTube channel to learn step-by-step video tutorials