Managing municipal services has become more complex than ever. Cities and local governments must handle service requests, labor resources, material costs, citizen complaints, and satisfaction scores—all at the same time. However, when data stays scattered across multiple Excel files or manual registers, decision-making slows down and errors increase.
That is exactly why a Municipal Services Dashboard in Excel plays a crucial role in modern urban management.
This ready-to-use dashboard converts raw municipal data into clear, visual insights. As a result, city officials, administrators, and operations teams gain instant visibility into costs, efficiency, resolution time, and citizen satisfaction—without using complex software.
In this detailed article, you will learn what a Municipal Services Dashboard in Excel is, how it works, its sheet-wise structure, advantages, best practices, and frequently asked questions.
Click to buy Municipal Services Dashboard in Excel
What Is a Municipal Services Dashboard in Excel?
A Municipal Services Dashboard in Excel is a centralized reporting and analytics tool designed to monitor and analyze city service operations. Instead of reviewing long spreadsheets, users can track key performance indicators through charts, cards, and slicers.
Moreover, this dashboard helps municipalities:
- Monitor material and labor costs
- Analyze resolution time of service requests
- Track citizen satisfaction percentage
- Compare performance by department, channel, season, priority, and month
- Identify cost-saving and efficiency improvement opportunities
Because the dashboard runs in Microsoft Excel, teams can use it offline, customize it easily, and share reports without extra licenses.
Why Do Municipal Bodies Need a Dashboard Instead of Manual Reports?
Manual reporting consumes time and increases the risk of errors. On the other hand, a dashboard delivers instant insights.
Here is why municipalities prefer dashboards:
- Data updates automatically with new entries
- Visual charts improve understanding
- Trends become easy to identify
- Decision-making becomes faster
- Transparency improves across departments
Therefore, a Municipal Services Dashboard in Excel acts as a single source of truth for operational performance.
How Is the Municipal Services Dashboard in Excel Structured?
This ready-to-use dashboard contains multiple sheet tabs, each designed for a specific type of analysis. Let us explore each sheet in detail.
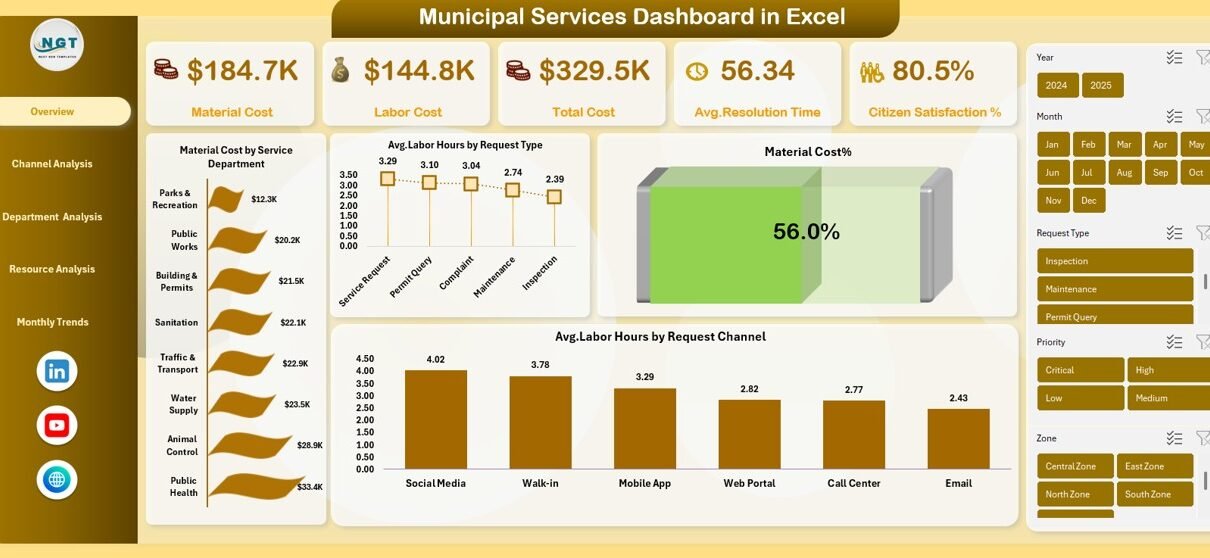
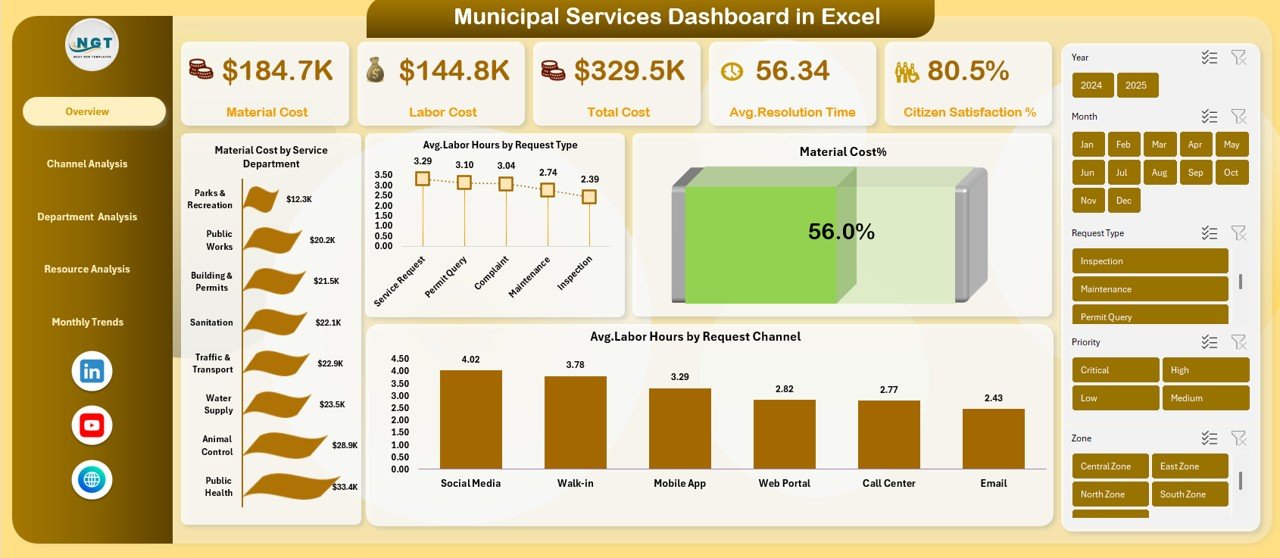
Overview Sheet
The Overview sheet works as the control center of the dashboard. It provides a high-level summary of municipal service performance.
Key KPI Cards on the Overview Sheet
The dashboard displays the following KPI cards:
- Material Cost
- Labor Cost
- Total Cost
- Average Resolution Time (Hours)
- Citizen Satisfaction %
These cards help decision-makers understand overall performance at a glance.
Key Charts in the Overview Sheet
The Overview sheet also includes powerful visualizations such as:
- Material Cost by Service Department
- Average Labor Hours by Request Type
- Material Cost %
- Average Labor Hours by Request Channel
As a result, administrators can quickly identify high-cost departments and labor-intensive request types.
Click to buy Municipal Services Dashboard in Excel
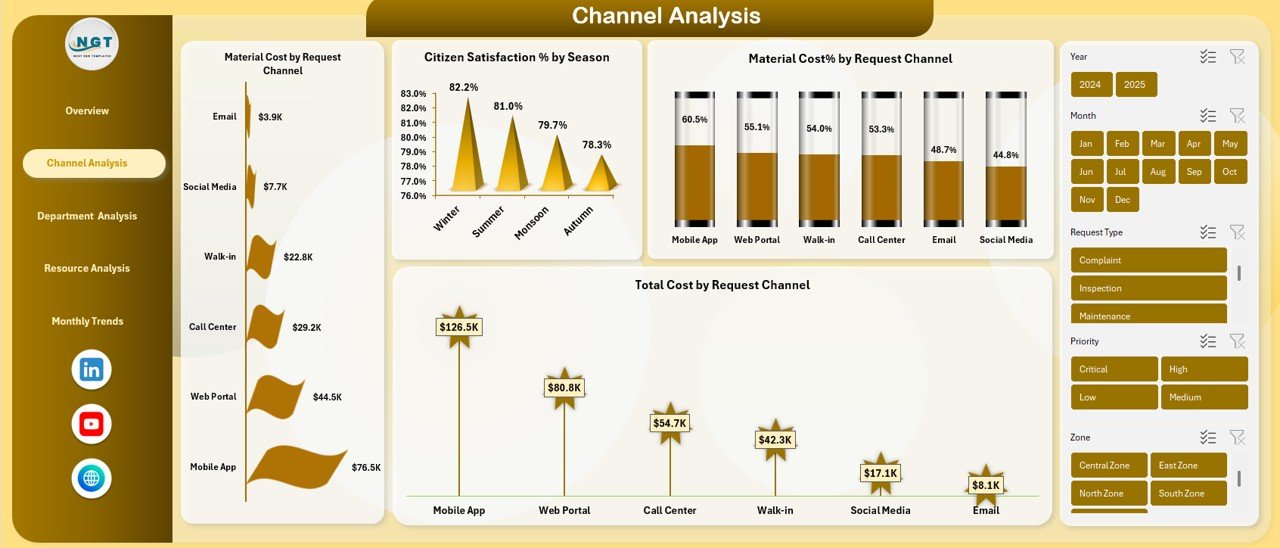
Channel Analysis
Citizens submit service requests through different channels such as phone, mobile apps, email, or walk-ins. Therefore, analyzing performance by channel becomes essential.
Key Insights in the Channel Analysis Sheet
The Channel Analysis sheet includes:
- Material Cost by Request Channel
- Citizen Satisfaction % by Season
- Material Cost % by Request Channel
- Total Cost by Request Channel
Because of this analysis, municipalities can:
- Identify costly service channels
- Improve underperforming channels
- Enhance citizen experience
- Allocate resources efficiently
Click to buy Municipal Services Dashboard in Excel
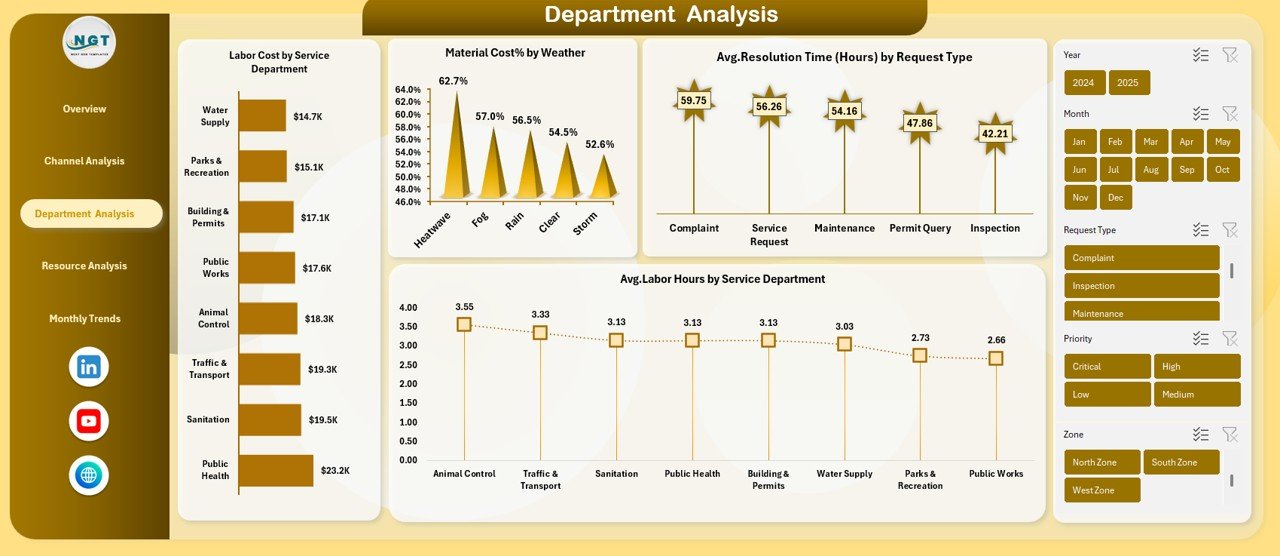
Department Analysis
Different municipal departments handle different services such as water supply, sanitation, roads, and electricity. Hence, department-level performance analysis matters.
Charts Available in the Department Analysis Sheet
This sheet includes:
- Labor Cost by Service Department
- Material Cost % by Weather
- Average Resolution Time (Hours) by Request Type
- Average Labor Hours by Service Department
With these insights, leaders can compare department efficiency and justify budget allocations.
Click to buy Municipal Services Dashboard in Excel
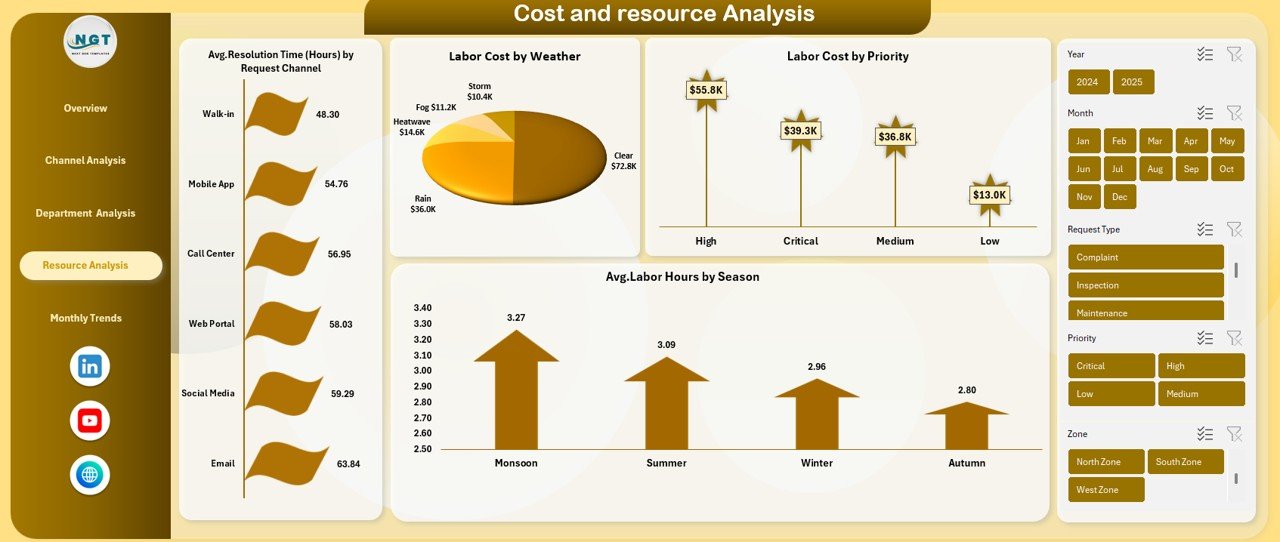
Resource Analysis
Resources such as labor and materials directly impact service quality and costs. Therefore, resource optimization becomes critical.
Key Metrics in the Resource Analysis Sheet
The Resource Analysis sheet displays:
- Average Resolution Time (Hours) by Request Channel
- Labor Cost by Weather
- Labor Cost by Priority
- Average Labor Hours by Season
This analysis helps municipalities prepare for seasonal demand and prioritize urgent requests effectively.
Click to buy Municipal Services Dashboard in Excel
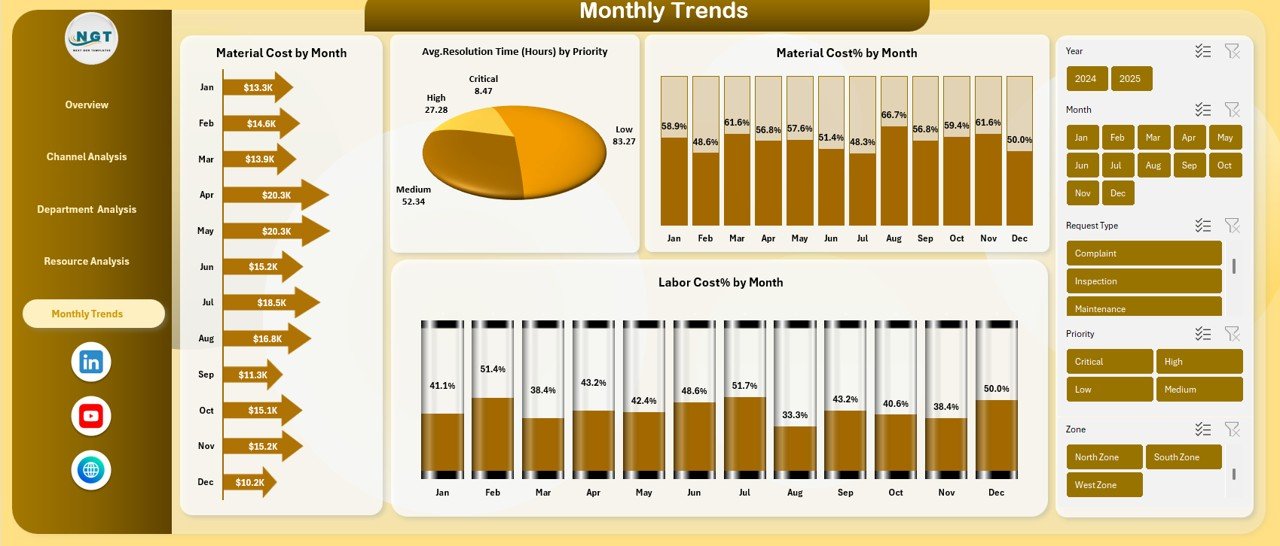
Monthly Trends
Short-term performance matters, but long-term trends drive strategic planning.
Monthly Trends Sheet Explained
The Monthly Trends sheet focuses on time-based analysis, including:
- Average Resolution Time (Hours) by Priority
- Material Cost % by Month
- Labor Cost % by Month
Using this sheet, city officials can:
- Track cost patterns over the year
- Identify peak workload periods
- Improve future budgeting accuracy
Click to buy Municipal Services Dashboard in Excel
What Makes This Municipal Services Dashboard Ready to Use?
This dashboard comes fully structured and does not require advanced Excel knowledge.
Key Ready-to-Use Features
- Pre-built charts and KPIs
- Clean layout and navigation
- Filter-friendly design
- Scalable data structure
- Easy customization
As a result, municipalities can start using it immediately.
Advantages of Municipal Services Dashboard in Excel
Why Should Municipalities Use This Dashboard?
Using this dashboard delivers multiple advantages.
- Centralized Data Visibility
All service-related data stays in one place, which reduces confusion and duplication.
- Faster Decision-Making
Visual insights allow leaders to act quickly and confidently.
- Improved Cost Control
Material and labor cost tracking helps identify savings opportunities.
- Better Citizen Satisfaction
Monitoring satisfaction scores enables service quality improvements.
- Enhanced Accountability
Department-wise metrics increase transparency and responsibility.
- No Additional Software Cost
Because Excel powers the dashboard, municipalities avoid extra license fees.
Who Can Benefit from a Municipal Services Dashboard in Excel?
This dashboard suits many stakeholders, including:
- Municipal commissioners
- City administrators
- Operations managers
- Public works departments
- Urban planning teams
- Finance and budgeting teams
How Does This Dashboard Improve Citizen Trust?
Transparency builds trust. When municipalities track performance openly, citizens gain confidence in public services.
Moreover, this dashboard helps:
- Reduce service delays
- Improve complaint resolution
- Enhance communication across departments
Therefore, data-driven governance strengthens citizen relationships.
Best Practices for the Municipal Services Dashboard in Excel
How Can You Get the Best Results from This Dashboard?
Follow these best practices to maximize value.
- Maintain Clean and Consistent Data
Always enter accurate data with standardized formats.
- Update Data Regularly
Frequent updates keep insights relevant and reliable.
- Review Dashboards Monthly
Monthly reviews help identify trends early.
- Train Staff on Dashboard Usage
Basic training improves adoption and accuracy.
- Customize KPIs as Needed
Adapt metrics based on local service priorities.
- Use Insights for Action
Turn dashboard insights into clear action plans.
Can This Dashboard Support Smart City Initiatives?
Yes, it can. While the dashboard runs in Excel, it supports data-driven governance, which forms the foundation of smart cities.
By tracking performance metrics, municipalities can:
- Improve service efficiency
- Reduce operational waste
- Enhance citizen engagement
How Secure Is a Municipal Services Dashboard in Excel?
Excel allows password protection and controlled access. Therefore, municipalities can secure sensitive operational data effectively.
Conclusion: Why Is a Municipal Services Dashboard in Excel a Must-Have Tool?
A Municipal Services Dashboard in Excel transforms how cities manage services, costs, and performance. Instead of relying on manual reports, municipalities gain instant insights through a single, visual platform.
Because the dashboard tracks material cost, labor cost, resolution time, and citizen satisfaction across departments and channels, it empowers leaders to make informed decisions.
Ultimately, this dashboard supports efficient governance, improved service quality, and higher citizen trust.
Frequently Asked Questions (FAQs)
- What is a Municipal Services Dashboard in Excel used for?
It tracks service costs, labor efficiency, resolution time, and citizen satisfaction in a single Excel file.
- Do I need advanced Excel skills to use this dashboard?
No, the dashboard is ready to use and beginner-friendly.
- Can I customize the dashboard for my city?
Yes, you can modify KPIs, charts, and categories easily.
- How often should data be updated?
You should update data weekly or monthly for accurate insights.
- Does this dashboard support multiple departments?
Yes, it supports department-wise, channel-wise, and priority-wise analysis.
- Can small municipalities use this dashboard?
Absolutely. The dashboard suits both small towns and large cities.
- Is this dashboard suitable for budgeting purposes?
Yes, cost trends and breakdowns support better budgeting and forecasting.
Click to buy Municipal Services Dashboard in Excel
Watch the step-by-step video tutorial:
Visit our YouTube channel to learn step-by-step video tutorials