In today’s highly competitive outsourcing industry, data-driven decision-making defines success. Business Process Outsourcing (BPO) and Knowledge Process Outsourcing (KPO) organizations manage large workforces, strict SLAs, multiple clients, and complex processes. Therefore, relying on static reports or manual tracking no longer delivers results.
That is exactly where an Outsourcing (BPO and KPO) KPI Dashboard in Power BI becomes a game-changing solution.
In this in-depth and practical article, you will learn what an Outsourcing KPI Dashboard in Power BI is, why BPO and KPO organizations need it, how it works, its page-wise structure, key advantages, best practices, and frequently asked questions. Moreover, this guide uses clear language, simple explanations, and real-world logic so you can apply everything immediately.
Click to Purchases Outsourcing (BPO and KPO) KPI Dashboard in Power BI
What Is an Outsourcing (BPO and KPO) KPI Dashboard in Power BI?
An Outsourcing (BPO and KPO) KPI Dashboard in Power BI is an interactive business intelligence solution that helps outsourcing organizations track, analyze, and visualize key performance indicators in real time.
Instead of reviewing multiple Excel files or static PDFs, this dashboard consolidates operational, quality, financial, and SLA KPIs into a single, dynamic Power BI report. As a result, leaders gain instant visibility into performance gaps, trends, and improvement opportunities.
Most importantly, Power BI transforms raw Excel data into meaningful insights through slicers, visuals, icons, and drill-through capabilities.
Why Do BPO and KPO Organizations Need a KPI Dashboard in Power BI?
BPO and KPO businesses operate under constant pressure to deliver quality, productivity, and cost efficiency. At the same time, clients expect transparency and consistent reporting.
Here is why a KPI Dashboard in Power BI becomes essential:
-
It provides real-time performance visibility
-
It compares actual vs target vs previous year
-
It supports MTD and YTD performance tracking
-
It highlights target met and target missed KPIs
-
It enables data-driven operational decisions
Without a dashboard, managers rely on assumptions. However, with Power BI, they rely on facts.
What KPIs Are Commonly Tracked in a BPO and KPO Power BI Dashboard?
An effective Outsourcing KPI Dashboard in Power BI supports multiple KPI categories.
Operational KPIs
-
Productivity per FTE
-
Average Handling Time (AHT)
-
Turnaround Time (TAT)
-
Utilization Rate
-
Volume Processed
Quality KPIs
-
Quality Score %
-
Error Rate
-
Rework %
-
First Call Resolution (FCR)
Financial KPIs
-
Cost per Transaction
-
Revenue per FTE
-
Billing Accuracy
-
Margin %
SLA and Compliance KPIs
-
SLA Compliance %
-
On-Time Delivery %
-
Escalation Rate
This dashboard structure supports all these KPIs with clarity and consistency.
Click to Purchases Outsourcing (BPO and KPO) KPI Dashboard in Power BI
How Does the Outsourcing KPI Dashboard in Power BI Work?
The Outsourcing KPI Dashboard in Power BI uses Excel as the data source and Power BI for visualization and analytics.
The workflow works like this:
-
Users enter data in structured Excel input sheets
-
Power BI connects to the Excel file
-
Measures calculate MTD, YTD, and comparisons
-
Visuals update automatically
-
Users interact with slicers and drill-through pages
As a result, reporting becomes faster, accurate, and scalable.
What Is the Page-Wise Structure of the Outsourcing KPI Dashboard in Power BI?
This ready-to-use dashboard contains 3 well-designed pages in the Power BI Desktop application. Each page serves a specific analytical purpose.
Let us explore each page in detail.
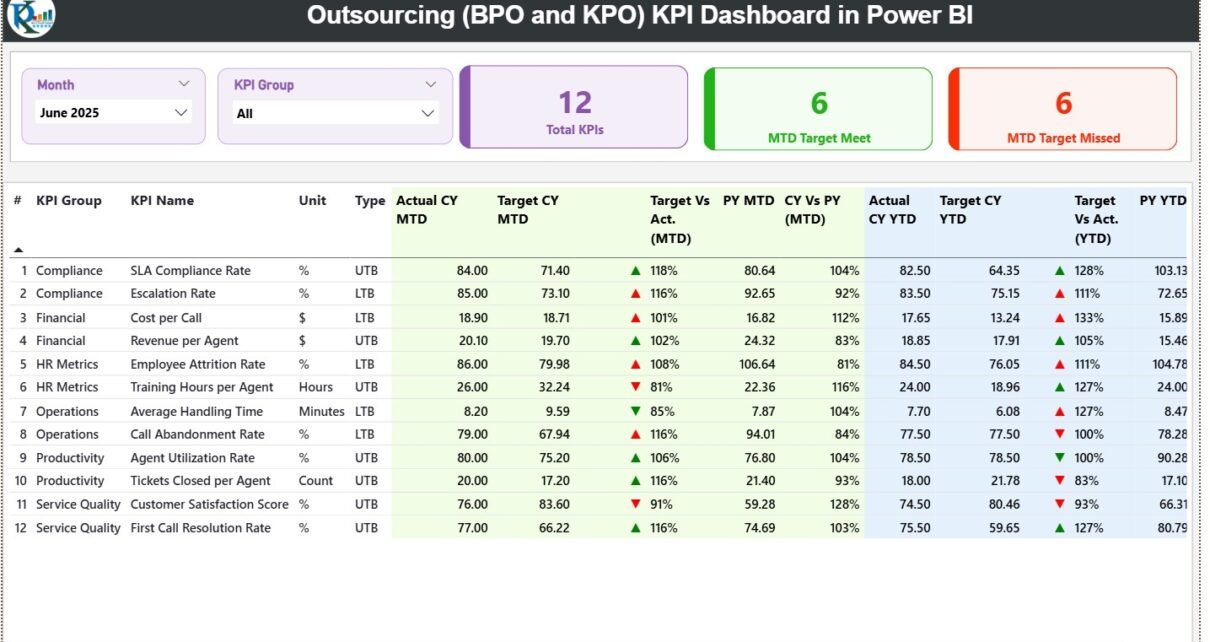
1) What Is the Summary Page in the Outsourcing KPI Dashboard?
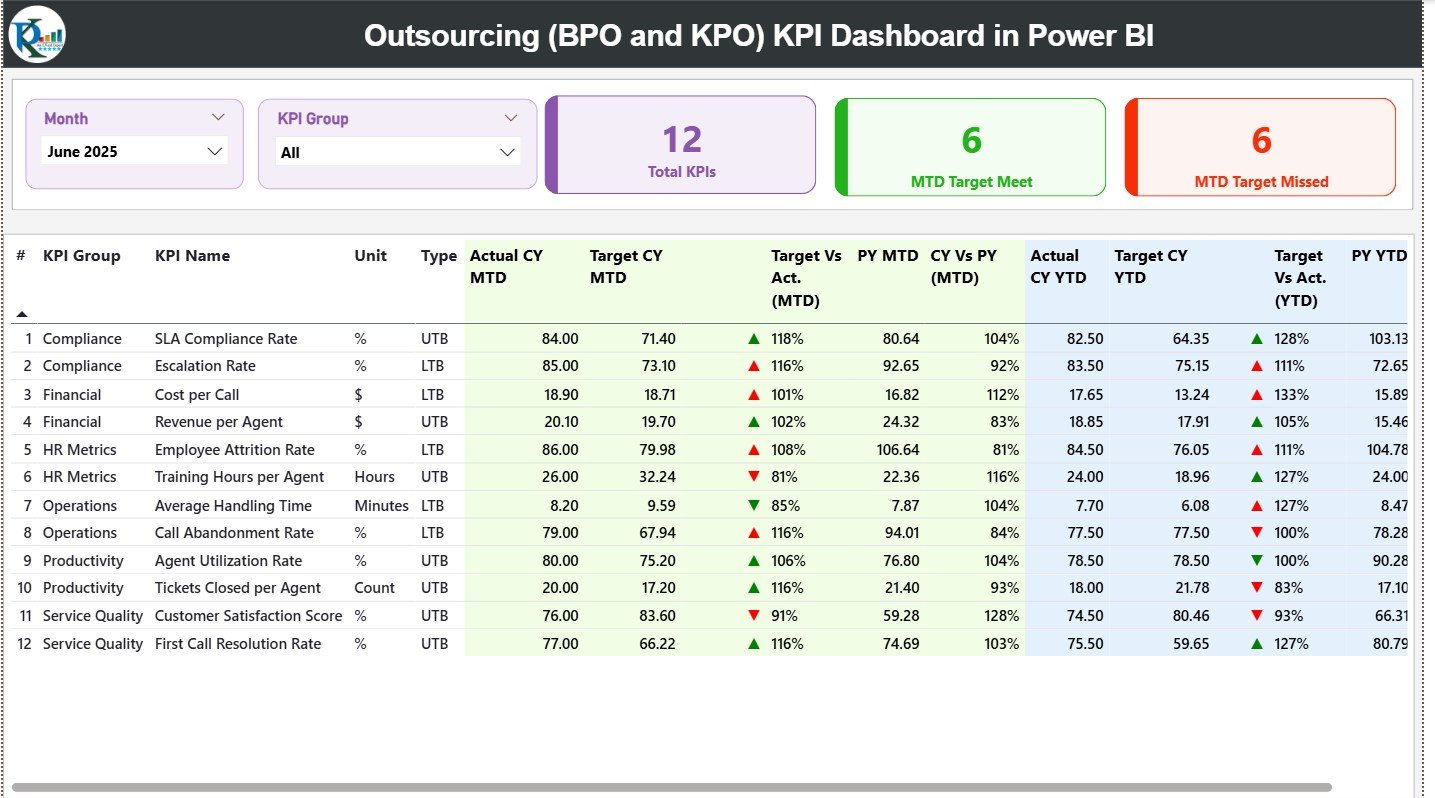
The Summary Page is the main landing page of the dashboard. It provides a consolidated view of all KPIs.
Key Features of the Summary Page
-
Month slicer at the top
-
KPI Group slicer at the top
-
Three KPI cards for quick insights
KPI Cards on the Summary Page
-
Total KPIs Count
-
MTD Target Met Count
-
MTD Target Missed Count
These cards immediately highlight overall performance health.
Click to Purchases Outsourcing (BPO and KPO) KPI Dashboard in Power BI
What Information Does the Detailed KPI Table Show?
Below the KPI cards, the Summary Page displays a detailed KPI table with rich insights.
Columns in the KPI Table
-
KPI Number – Sequential number of KPIs
-
KPI Group – Category of the KPI
-
KPI Name – Name of the KPI
-
Unit – Unit of measurement
-
Type – KPI type (LTB or UTB)
MTD Performance Columns
-
Actual CY MTD
-
Target CY MTD
-
MTD Icon (▲ / ▼ with green and red color)
-
Target vs Actual (MTD %)
-
PY MTD
-
CY vs PY (MTD %)
YTD Performance Columns
-
Actual CY YTD
-
Target CY YTD
-
YTD Icon (▲ / ▼ with green and red color)
-
Target vs Actual (YTD %)
-
PY YTD
-
CY vs PY (YTD %)
Because of this layout, users quickly identify which KPIs perform well and which need attention.
How Do Icons Improve KPI Interpretation?
Icons play a critical role in this dashboard.
-
Green ▲ icon indicates target achieved
-
Red ▼ icon indicates target missed
These icons reduce analysis time and improve decision speed.
Click to Purchases Outsourcing (BPO and KPO) KPI Dashboard in Power BI
2) What Is the KPI Trend Page and Why Is It Important?
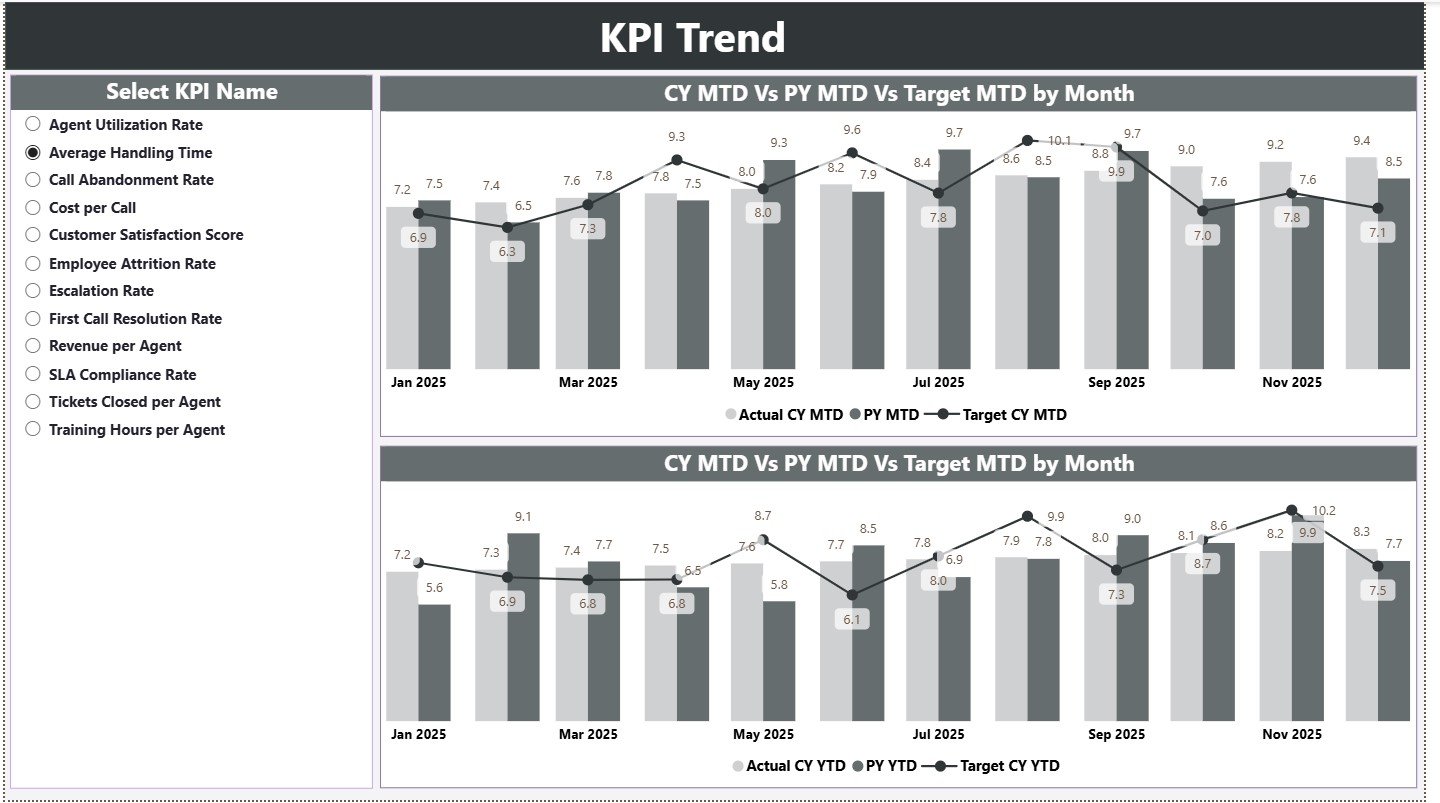
The KPI Trend Page focuses on performance trends over time.
Key Features of the KPI Trend Page
-
KPI Name slicer on the left
-
Two combo charts for trend analysis
Trend Charts Display
MTD Trend Chart
-
Actual Current Year
-
Target Current Year
-
Previous Year
YTD Trend Chart
-
Actual Current Year
-
Target Current Year
-
Previous Year
These charts help managers understand performance patterns rather than isolated numbers.
Why Is Trend Analysis Critical for BPO and KPO Operations?
Trend analysis helps organizations:
-
Identify recurring performance issues
-
Measure improvement initiatives
-
Compare current performance with past trends
-
Predict future outcomes
Therefore, the KPI Trend Page becomes a powerful analytical tool.
3) What Is the KPI Definition Page?
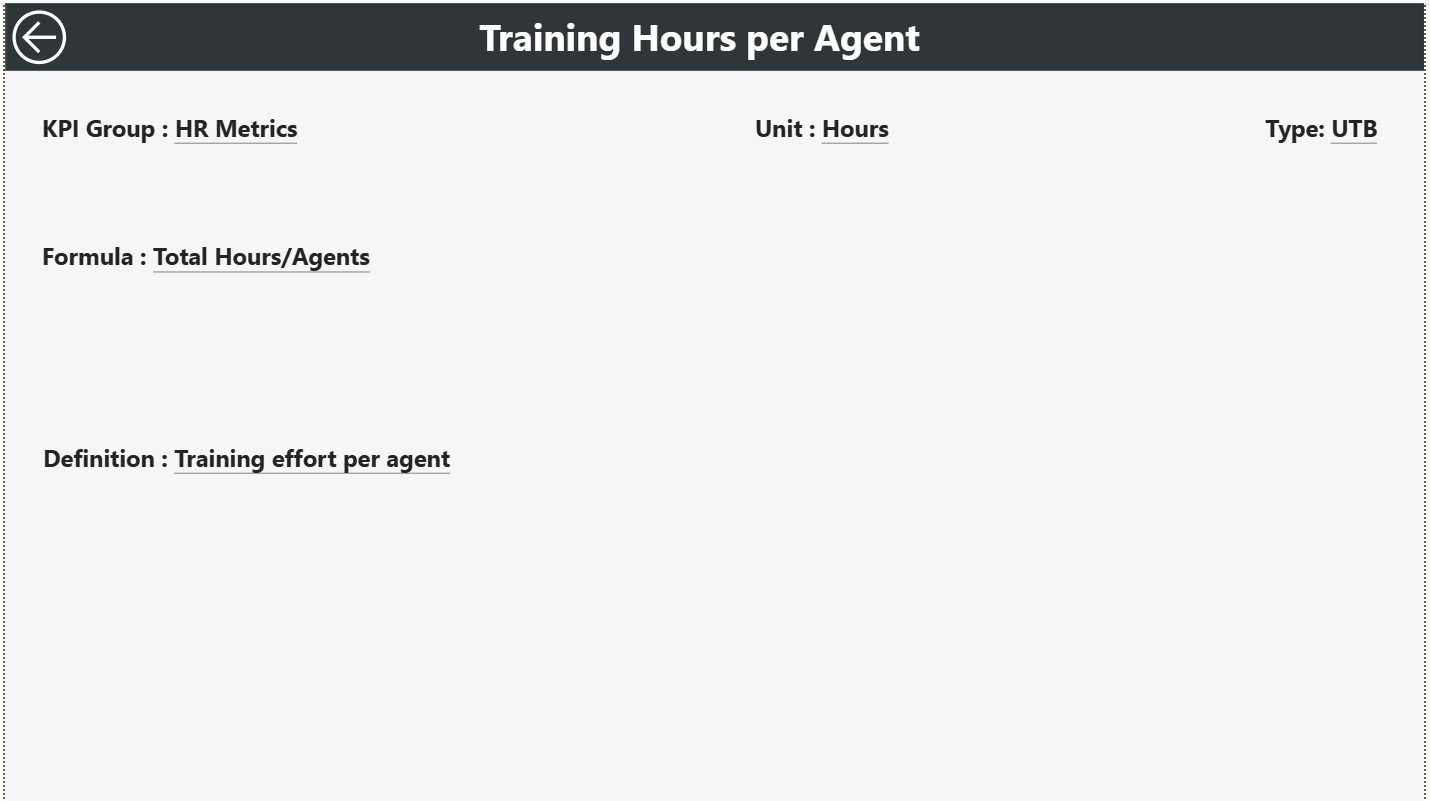
The KPI Definition Page is a drill-through page that provides contextual information.
Key Characteristics
-
Hidden from the main navigation
-
Accessible via drill-through from the Summary Page
-
Includes a back button for easy navigation
Information Available on KPI Definition Page
-
KPI Formula
-
KPI Definition
This page ensures clarity and consistency across teams.
Click to Purchases Outsourcing (BPO and KPO) KPI Dashboard in Power BI
How Does Drill-Through Improve Dashboard Usability?
Drill-through allows users to move from summary-level insights to detailed explanations. As a result, users understand what the KPI means, not just what the number shows.
What Is the Excel Data Structure Used in This Power BI Dashboard?
This dashboard uses an Excel file as its data source, which makes data entry simple and controlled.
The Excel file contains three structured worksheets.
1) Input_Actual Sheet
Purpose
Stores actual performance values.
Columns Included
-
KPI Name
-
Month (use the first date of the month)
-
MTD Number
-
YTD Number
Users update this sheet regularly to keep the dashboard current.
2) Input_Target Sheet
Purpose
Stores target values.
Columns Included
-
KPI Name
-
Month (use the first date of the month)
-
MTD Target
-
YTD Target
Separating targets from actuals ensures clean logic and easier maintenance.
3) KPI Definition Sheet
Purpose
Stores master KPI information.
Columns Included
-
KPI Number
-
KPI Group
-
KPI Name
-
Unit
-
Formula
-
Definition
-
Type (LTB or UTB)
This sheet acts as the backbone of the dashboard.
Click to Purchases Outsourcing (BPO and KPO) KPI Dashboard in Power BI
Advantages of Outsourcing (BPO and KPO) KPI Dashboard in Power BI
Using a Power BI-based KPI dashboard offers significant advantages.
1. Real-Time Interactive Reporting
Users explore data instantly using slicers and visuals.
2. Clear MTD and YTD Tracking
The dashboard simplifies short-term and long-term performance monitoring.
3. Visual Decision Support
Icons, charts, and comparisons improve clarity and speed.
4. Scalable and Flexible
The dashboard supports new KPIs, months, and clients easily.
5. Excel-Friendly Data Entry
Teams continue using Excel while leadership benefits from Power BI insights.
6. Improved SLA Monitoring
Target met and missed indicators highlight risks early.
How Does This Dashboard Support Better Decision-Making?
This dashboard empowers leaders to:
-
Detect performance gaps early
-
Focus on high-impact KPIs
-
Improve accountability
-
Align teams with targets
-
Drive continuous improvement
As a result, organizations move from reactive to proactive management.
Click to Purchases Outsourcing (BPO and KPO) KPI Dashboard in Power BI
Best Practices for the Outsourcing (BPO and KPO) KPI Dashboard in Power BI
To maximize dashboard value, follow these best practices.
Choose Relevant KPIs
Track KPIs aligned with business goals and SLAs.
Maintain Clean Excel Data
Use consistent formats and avoid manual overrides.
Update Data Regularly
Monthly or weekly updates improve reliability.
Review Trends, Not Just Icons
Trends reveal deeper insights than status indicators alone.
Train Users
Ensure teams understand slicers, drill-through, and visuals.
Keep KPI Definitions Updated
Clear definitions avoid confusion and misinterpretation.
Common Mistakes to Avoid While Using Power BI KPI Dashboards
Avoid these pitfalls to ensure success:
-
Tracking too many KPIs
-
Ignoring data validation in Excel
-
Comparing inconsistent time periods
-
Focusing only on MTD results
-
Not reviewing dashboards regularly
Avoiding these mistakes ensures long-term dashboard effectiveness.
Who Can Benefit from This Power BI Dashboard?
This dashboard serves multiple stakeholders:
-
BPO and KPO Operations Managers
-
Delivery and Account Managers
-
Quality and Compliance Teams
-
Finance and Billing Teams
-
Process Excellence Teams
-
Senior Leadership
Each role gains valuable insights from the same report.
Power BI vs Manual Reports: Why Power BI Wins
Compared to manual reporting, Power BI dashboards:
-
Automate calculations
-
Reduce reporting time
-
Improve accuracy
-
Enhance visualization
-
Support interactive analysis
Therefore, Power BI becomes the preferred choice for modern outsourcing analytics.
Click to Purchases Outsourcing (BPO and KPO) KPI Dashboard in Power BI
Conclusion: Why Use an Outsourcing KPI Dashboard in Power BI?
An Outsourcing (BPO and KPO) KPI Dashboard in Power BI transforms operational data into actionable insights. It improves transparency, enhances performance tracking, and supports strategic decision-making.
With interactive slicers, MTD and YTD comparisons, trend analysis, and drill-through definitions, this dashboard delivers everything outsourcing leaders need to manage performance effectively.
If your organization wants clarity, control, and confidence in performance management, this Power BI dashboard becomes an essential tool.
Frequently Asked Questions (FAQs)
What is the main purpose of an Outsourcing KPI Dashboard in Power BI?
It helps track, analyze, and visualize BPO and KPO performance metrics in an interactive environment.
Can this dashboard use Excel as a data source?
Yes, the dashboard connects directly to structured Excel input files.
How often should data be refreshed?
You should refresh data monthly or weekly based on reporting needs.
Does this dashboard support SLA monitoring?
Yes, it clearly highlights target met and target missed KPIs.
Can I add new KPIs easily?
Yes, the Excel-driven structure allows easy KPI expansion.
Is Power BI suitable for enterprise-level outsourcing analytics?
Yes, Power BI scales well from small teams to large enterprises.
Click to Purchases Outsourcing (BPO and KPO) KPI Dashboard in Power BI
Visit our YouTube channel to learn step-by-step video tutorials