Facilities management plays a critical role in keeping organizations productive, safe, and cost-efficient. Offices, factories, hospitals, campuses, malls, and commercial buildings generate a massive amount of operational data every single day. However, raw data alone does not help decision-makers. You must convert that data into clear, timely, and actionable insights.
That is exactly where a Facilities Management KPI Dashboard in Power BI becomes a powerful and practical solution.
In this in-depth article, you will learn what a Facilities Management KPI Dashboard in Power BI is, how it works, why it matters, its complete page-wise structure, advantages, best practices, and frequently asked questions. Moreover, this guide uses simple language, real-world logic, and practical explanations so you can apply everything immediately.
Click to buy Facilities Management KPI Dashboard in Power BI
What Is a Facilities Management KPI Dashboard in Power BI?
A Facilities Management KPI Dashboard in Power BI is a centralized analytics and reporting tool that tracks, measures, and visualizes key performance indicators related to building operations, maintenance, utilities, safety, and service quality.
Instead of checking multiple spreadsheets, emails, or software systems, this dashboard brings all critical KPIs into one interactive Power BI report. As a result, facility managers gain instant visibility into performance trends, efficiency gaps, and improvement opportunities.
Moreover, Power BI dashboards allow you to:
- Filter data dynamically by month and KPI group
- Compare actual performance against targets
- Analyze month-to-date (MTD) and year-to-date (YTD) results
- Compare current year performance with previous year data
- Drill through to detailed KPI definitions
Because of these capabilities, facilities teams can move from reactive problem-solving to proactive decision-making.
Why Do Facilities Teams Need a KPI Dashboard in Power BI?
Facilities operations involve multiple moving parts. Maintenance costs, service response times, energy usage, and compliance metrics constantly change. Therefore, teams need a system that provides clarity instead of confusion.
A Facilities Management KPI Dashboard in Power BI helps because:
- It centralizes performance data in one place
- It reduces manual reporting effort
- It improves accountability across facility functions
- It supports faster and better decisions
- It highlights risks and inefficiencies early
In addition, leadership teams prefer visual insights over raw numbers. Power BI delivers interactive charts, tables, and indicators that make performance easy to understand at a glance.
How Does the Facilities Management KPI Dashboard in Power BI Work?
This ready-to-use dashboard uses Excel as the data source and Power BI Desktop for visualization and analysis. You only need to update the Excel file regularly. Once updated, Power BI refreshes the dashboard instantly.
Data Flow Overview
- You enter actual KPI values in the Excel file
- You enter target KPI values in the Excel file
- You define KPIs with formulas and descriptions
- Power BI reads and models the data
- The dashboard calculates MTD, YTD, and comparisons
- Visuals update automatically based on slicer selections
As a result, the reporting process becomes simple, structured, and reliable.
What Are the Key Pages in the Facilities Management KPI Dashboard?
This dashboard includes three well-designed pages inside the Power BI Desktop file. Each page serves a specific analytical purpose.
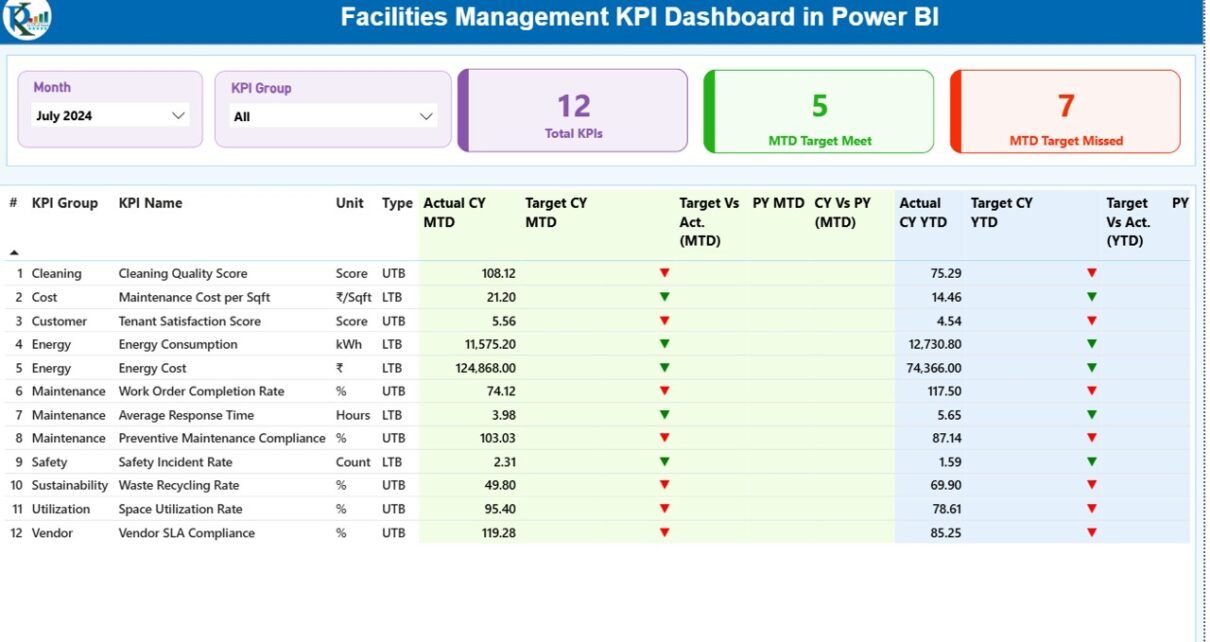
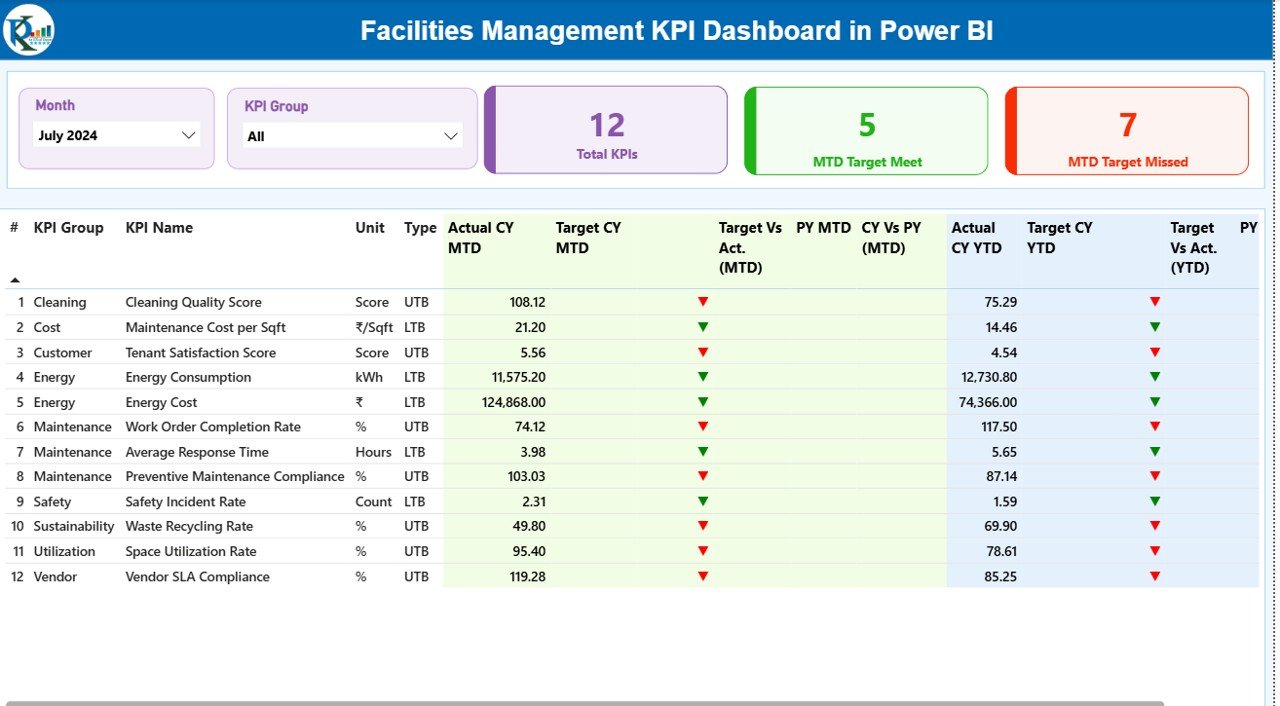
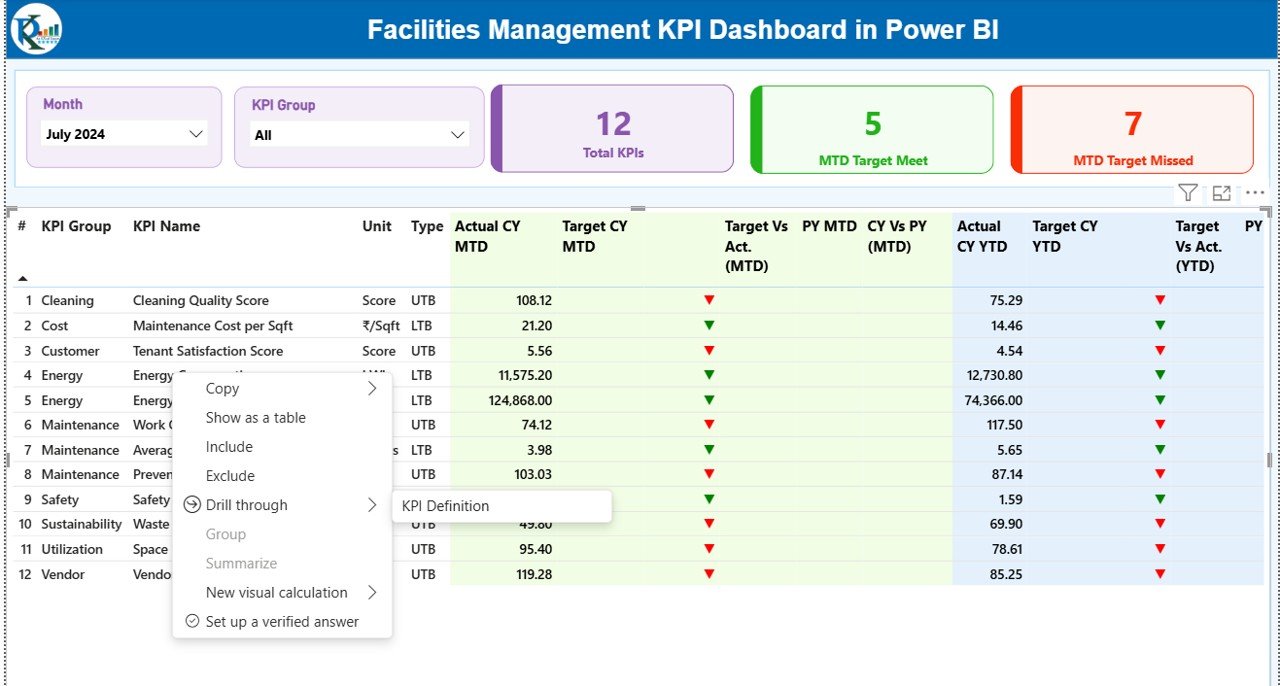
Summary Page: How Does It Help Monitor Overall Performance?
The Summary Page acts as the main control center of the dashboard. From here, users can review overall performance across all facilities KPIs.
Key Elements on the Summary Page
Interactive Slicers
- Month Slicer: Filters data by selected month
- KPI Group Slicer: Filters KPIs by category
These slicers allow users to analyze performance quickly without changing the underlying data.
KPI Cards
At the top, the dashboard displays three key cards:
- Total KPIs Count
- MTD Target Met Count
- MTD Target Missed Count
These cards provide an instant performance snapshot.
Detailed KPI Performance Table
Below the cards, the dashboard shows a detailed KPI table with the following columns:
- KPI Number – Sequential number of each KPI
- KPI Group – Category or functional area
- KPI Name – Name of the KPI
- Unit – Unit of measurement
- Type – KPI type (LTB or UTB)
Month-to-Date (MTD) Metrics
- Actual CY MTD – Current year actual MTD value
- Target CY MTD – Current year target MTD value
- MTD Icon – ▲ or ▼ icons with green/red indicators
- Target vs Actual (MTD) – Actual ÷ Target percentage
- PY MTD – Previous year MTD value
- CY vs PY (MTD) – Current vs previous year comparison
Year-to-Date (YTD) Metrics
- Actual CY YTD
- Target CY YTD
- YTD Icon
- Target vs Actual (YTD)
- PY YTD
- CY vs PY (YTD)
Because of this structure, users can analyze both short-term and long-term performance from one screen.
Click to buy Facilities Management KPI Dashboard in Power BI
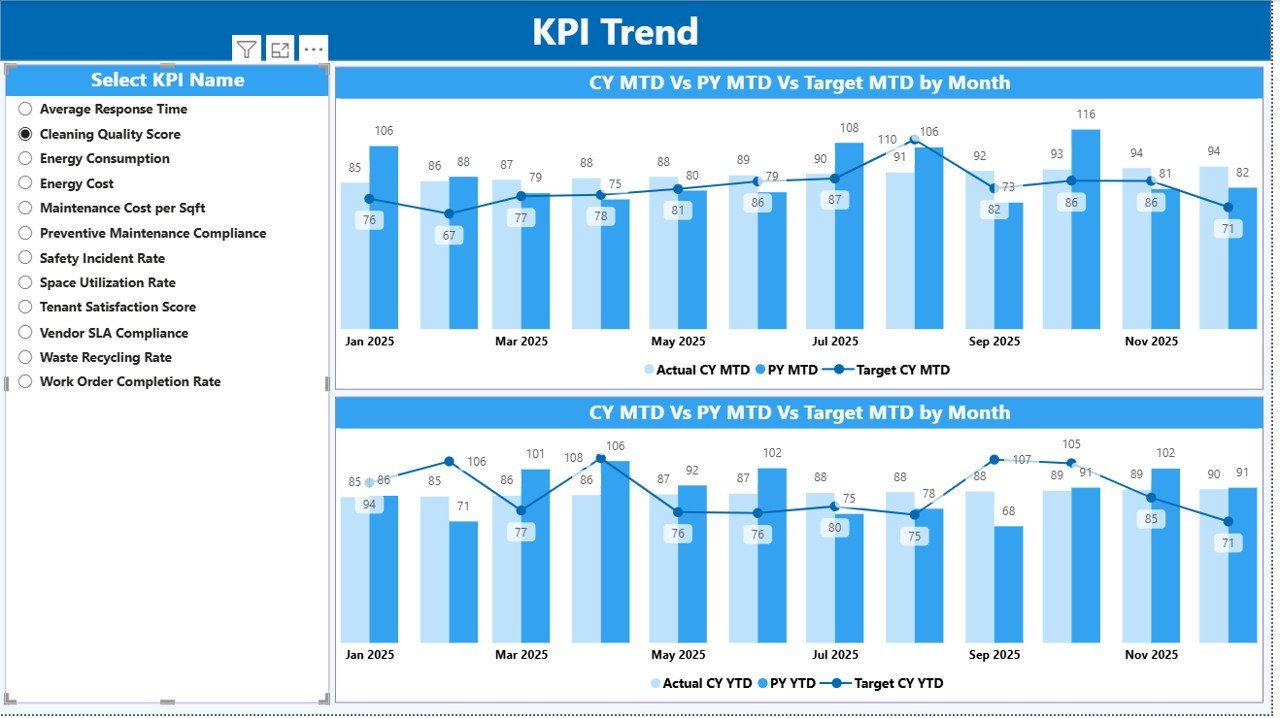
KPI Trend Page: How Can You Analyze Performance Over Time?
The KPI Trend Page focuses on performance trends for individual KPIs.
What Does This Page Show?
- Two combo charts:
MTD trend: Actual vs Target vs Previous Year
YTD trend: Actual vs Target vs Previous Year
A KPI Name slicer on the left side
By selecting a KPI, users can instantly see how performance changes across months. Consequently, trend analysis becomes intuitive and actionable.
Click to buy Facilities Management KPI Dashboard in Power BI
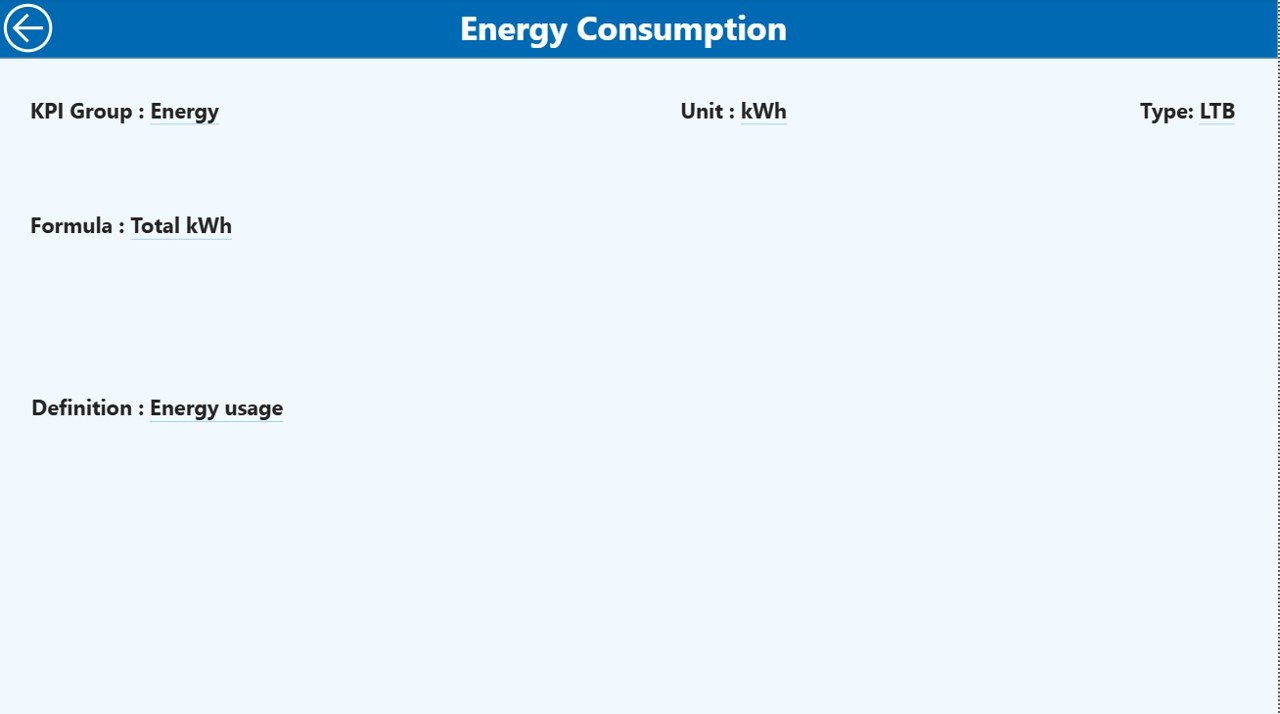
KPI Definition Page: Why Is It Important?
The KPI Definition Page provides clarity and transparency.
Key Characteristics
- This page works as a drill-through page
- It remains hidden from the main navigation
- Users access it by drilling through from the Summary Page
Information Available
- KPI Number
- KPI Group
- KPI Name
- Unit
- Formula
- Definition
- KPI Type (LTB or UTB)
A back button allows users to return easily to the Summary Page.
Because of this design, users never lose context while analyzing data.
Click to buy Facilities Management KPI Dashboard in Power BI
What Excel Data Is Required for This Dashboard?
The dashboard uses an Excel file with three worksheets as its data source. You only need to update these sheets regularly.
Input_Actual Sheet: What Data Should You Enter?
In the Input_Actual sheet, enter:
- KPI Name
- Month (use the first date of the month)
- MTD Actual Value
- YTD Actual Value
This sheet captures actual performance data.
Input_Target Sheet: How Do You Set Targets?
In the Input_Target sheet, enter:
- KPI Name
- Month (use the first date of the month)
- MTD Target Value
- YTD Target Value
This sheet defines expected performance benchmarks.
Click to buy Facilities Management KPI Dashboard in Power BI
KPI Definition Sheet: Why Is It Critical?
In the KPI Definition sheet, enter:
- KPI Number
- KPI Group
- KPI Name
- Unit
- Formula
- Definition
- Type (LTB or UTB)
This sheet ensures consistency and understanding across teams.
Advantages of a Facilities Management KPI Dashboard in Power BI
Using a Facilities Management KPI Dashboard in Power BI delivers several practical advantages.
- Centralized Performance Visibility
All KPIs appear in one interactive dashboard, which reduces reporting silos.
- Faster Decision-Making
Visual indicators and comparisons highlight issues instantly.
- Reduced Manual Effort
Automated calculations eliminate repetitive Excel work.
- Improved Accountability
Clear targets and results improve ownership across teams.
- Scalability and Flexibility
You can add new KPIs or modify existing ones easily.
Who Should Use a Facilities Management KPI Dashboard?
This dashboard suits multiple roles and industries, including:
- Facility Managers
- Operations Managers
- Maintenance Teams
- Energy Managers
- Corporate Real Estate Teams
- Hospital and Campus Administrators
Any organization that manages physical assets can benefit from this solution.
Best Practices for the Facilities Management KPI Dashboard in Power BI
To maximize value, follow these best practices.
- Define KPIs Clearly
Always document formulas and definitions in the KPI Definition sheet.
- Update Data Consistently
Update actual and target data monthly using consistent dates.
- Use LTB and UTB Correctly
Choose KPI types carefully to ensure correct visual indicators.
- Review Trends Regularly
Analyze MTD and YTD trends instead of focusing on single values.
- Train Users
Ensure teams understand slicers, drill-throughs, and charts.
How Does This Dashboard Support Strategic Decision-Making?
This dashboard connects operational data with strategic goals. Leaders can:
- Identify cost overruns early
- Improve service levels proactively
- Optimize maintenance schedules
- Track long-term improvement trends
As a result, facilities management shifts from reactive maintenance to strategic asset optimization.
Conclusion
A Facilities Management KPI Dashboard in Power BI transforms how organizations monitor and manage their facilities. Instead of working with scattered reports and manual calculations, teams gain a single, interactive, and reliable performance view.
Because this dashboard uses Excel as the data source and Power BI for visualization, it remains easy to maintain and highly scalable. With structured KPIs, dynamic slicers, clear indicators, and trend analysis, facilities teams can improve efficiency, reduce costs, and support data-driven decisions.
In today’s competitive environment, this type of dashboard is no longer optional. Instead, it has become an essential operational tool.
Frequently Asked Questions (FAQs)
What is the main purpose of a Facilities Management KPI Dashboard in Power BI?
The main purpose is to track, analyze, and visualize facilities performance KPIs in one centralized, interactive report.
Can beginners use this Power BI dashboard?
Yes. Because the dashboard uses Excel for data entry and Power BI for visuals, even beginners can use it easily after basic training.
How often should the data be updated?
Ideally, teams should update the data monthly to maintain accurate MTD and YTD reporting.
What does LTB and UTB mean?
LTB means “Lower the Better,” while UTB means “Upper the Better.” These types control KPI status indicators.
Can new KPIs be added later?
Yes. You can add new KPIs by updating the Excel sheets and refreshing the Power BI report.
Does this dashboard support trend analysis?
Yes. The KPI Trend page provides MTD and YTD trend analysis with actual, target, and previous year comparisons.
Visit our YouTube channel to learn step-by-step video tutorials
Watch the step-by-step video tutorial:
Click to buy Facilities Management KPI Dashboard in Power BI