Running a language school today involves much more than delivering quality lessons. You must track enrollments, monitor student performance, control costs, improve teacher productivity, and grow revenue—at the same time. However, without a structured system, managing all these areas becomes difficult and time-consuming.
That is exactly why a Language Schools KPI Dashboard in Excel becomes an essential management tool. It helps language schools convert scattered data into clear, visual, and actionable insights. As a result, owners, administrators, and academic managers can make faster and better decisions.
In this detailed guide, you will learn what a Language Schools KPI Dashboard in Excel is, why it matters, how it works, its structure, advantages, best practices, and frequently asked questions. Moreover, this article explains how Excel can become a powerful performance management system for language schools of all sizes.
Click to Purchases Language Schools KPI Dashboard in Excel
What Is a Language Schools KPI Dashboard in Excel?
A Language Schools KPI Dashboard in Excel is a centralized performance tracking tool that monitors key performance indicators (KPIs) related to academic outcomes, operations, finance, and student engagement.
Instead of checking multiple reports, registers, and spreadsheets, you get all critical insights in one interactive Excel dashboard. Therefore, decision-making becomes faster, clearer, and more data-driven.
In addition, this dashboard tracks both MTD (Month-to-Date) and YTD (Year-to-Date) values. As a result, you can measure short-term performance while keeping long-term goals in focus.
Why Do Language Schools Need a KPI Dashboard?
Language schools operate in a competitive and student-driven market. Therefore, relying on intuition alone creates risks. Instead, schools need real-time visibility into performance.
Here is why a KPI dashboard matters:
-
It provides complete visibility into academic and operational performance
-
It reduces manual reporting effort
-
It highlights performance gaps early
-
It supports strategic planning and forecasting
-
It improves accountability across departments
Moreover, Excel-based dashboards remain cost-effective and flexible. Therefore, even small and mid-sized language schools can use them easily.
How Does a Language Schools KPI Dashboard in Excel Work?
A Language Schools KPI Dashboard works by collecting data from structured input sheets and converting it into visual insights.
Here is how the process flows:
-
You enter actual performance data month-wise
-
You define targets for each KPI
-
You enter previous year data for comparison
-
Excel formulas calculate MTD and YTD values
-
Charts and tables visualize trends and comparisons
As a result, the dashboard updates automatically whenever you change data or select a different month.
What Are the Key Features of the Language Schools KPI Dashboard in Excel?
This ready-to-use dashboard comes with thoughtfully designed features that simplify performance tracking. Let us explore them one by one.
How Is the Dashboard Structured? (7 Worksheets Explained)
Click to Purchases Language Schools KPI Dashboard in Excel
The Language Schools KPI Dashboard in Excel consists of 7 structured worksheets, each serving a specific purpose.
1. Home Sheet – How Does Navigation Become Easy?
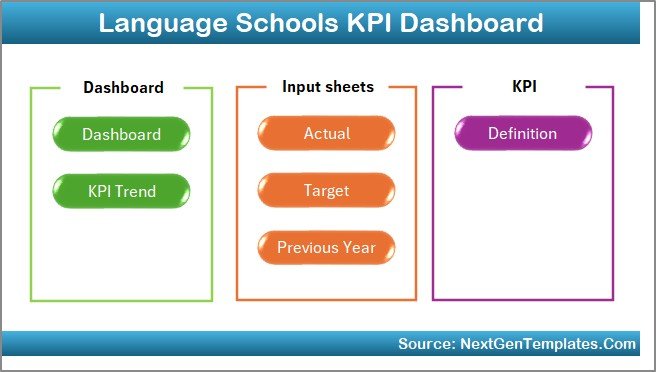
The Home Sheet acts as an index page.
Key highlights:
-
Contains 6 navigation buttons
-
Allows instant jump to any worksheet
-
Improves user experience
-
Reduces time spent searching for sheets
Therefore, even non-technical users can navigate the dashboard smoothly.
2. Dashboard Sheet – How Do You View Overall Performance?
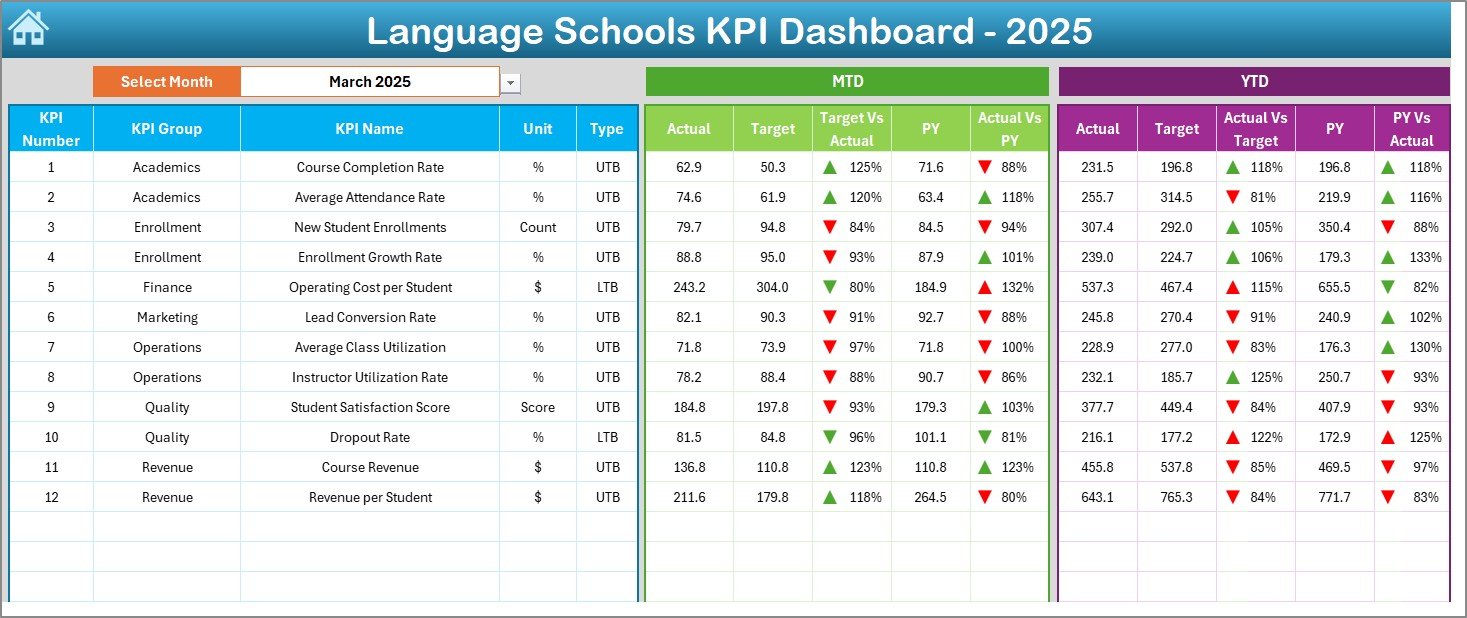
The Dashboard Sheet is the core of the entire system.
Key functionalities:
-
Month selection using a drop-down at cell D3
-
Automatic update of all KPIs based on the selected month
-
Clear comparison of:
-
MTD Actual vs Target
-
MTD Actual vs Previous Year
-
YTD Actual vs Target
-
YTD Actual vs Previous Year
-
Moreover, conditional formatting with up/down arrows instantly shows whether performance improves or declines.
As a result, management can identify issues at a glance.
3. KPI Trend Sheet – How Do You Analyze Individual KPIs?
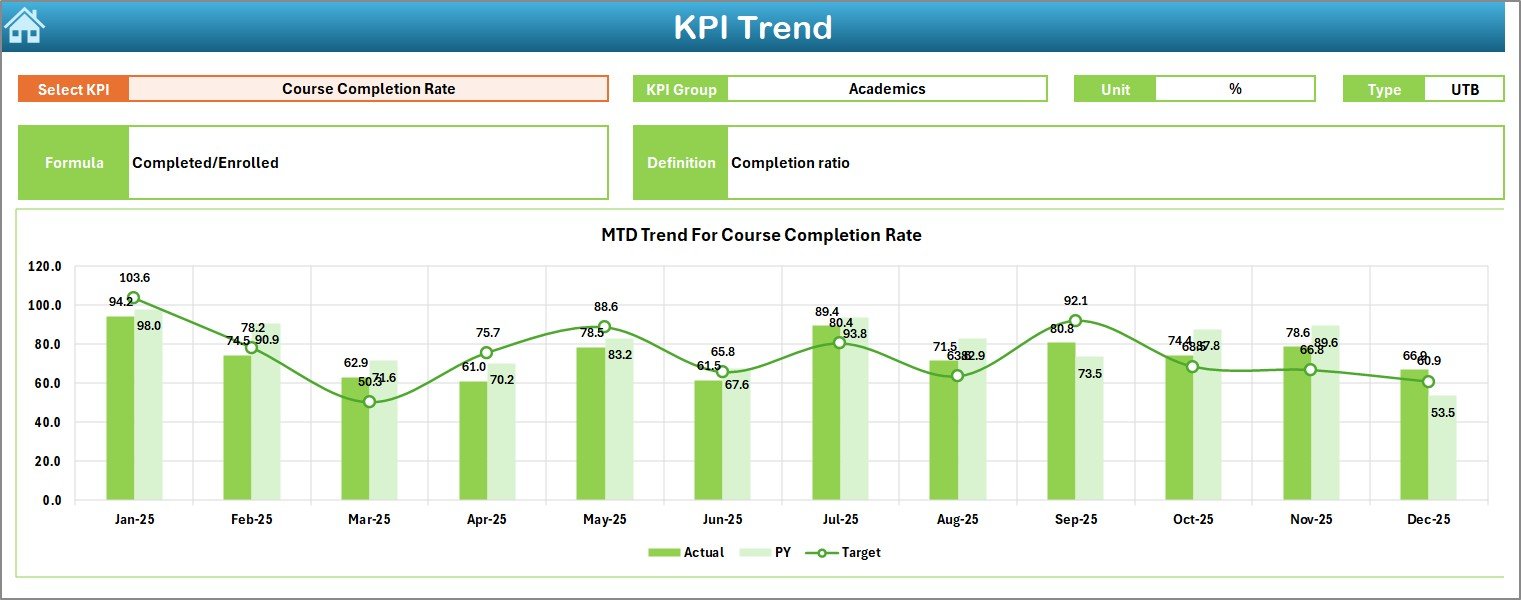
The KPI Trend Sheet focuses on deep KPI-level analysis.
What you can do here:
-
Select KPI from a drop-down in cell C3
-
View KPI details:
-
KPI Group
-
Unit of measurement
-
KPI Type (LTB or UTB)
-
Formula
-
Definition
-
-
Analyze MTD and YTD trends
-
Compare Actual, Target, and Previous Year values
Therefore, this sheet supports data-driven academic and operational reviews.
Click to Purchases Language Schools KPI Dashboard in Excel
4. Actual Numbers Input Sheet – How Is Data Entered?
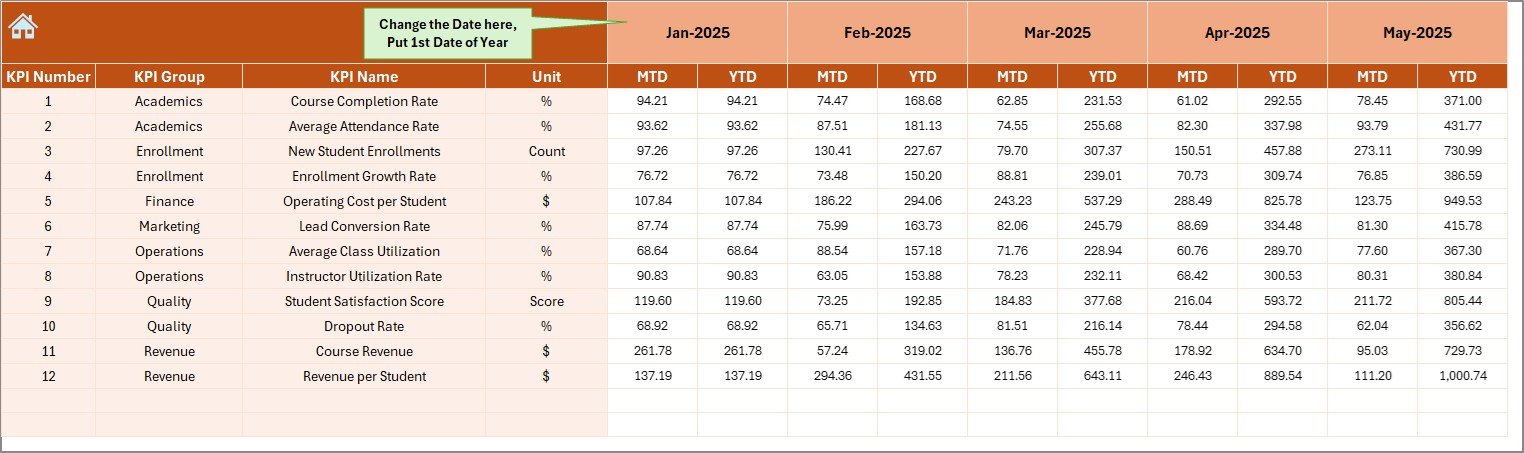
This sheet acts as the primary data input source.
How it works:
-
Enter MTD and YTD actual values
-
Select the first month of the year in cell E1
-
Change the month easily without restructuring data
As a result, data entry remains simple and structured.
5. Target Sheet – How Are Goals Tracked?
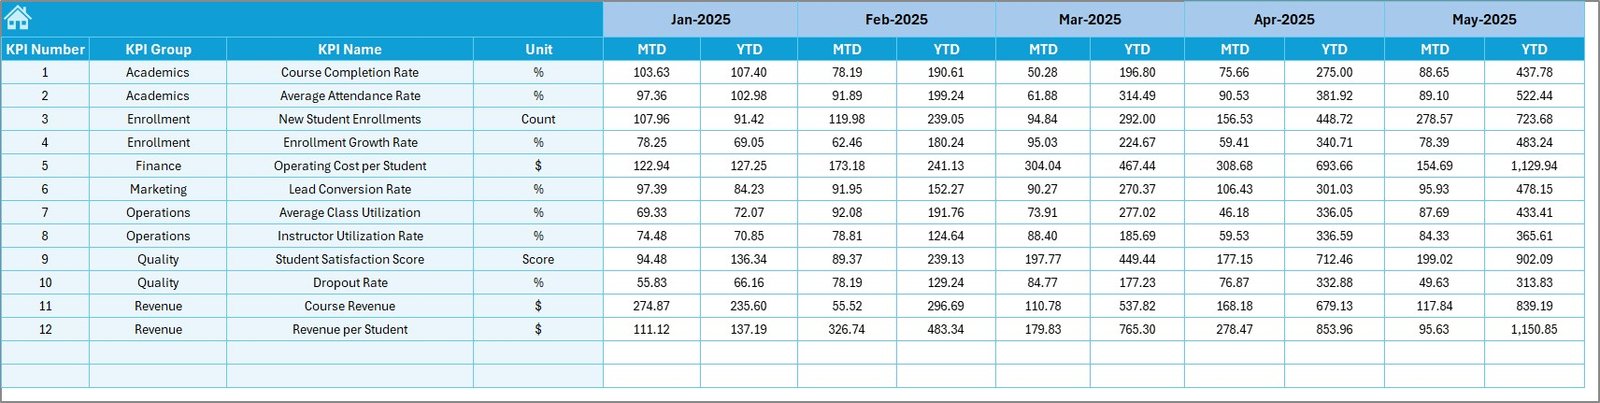
The Target Sheet defines performance expectations.
Key features:
-
Monthly target entry for each KPI
-
Separate MTD and YTD targets
-
Supports performance benchmarking
Therefore, schools can track whether they meet goals consistently.
6. Previous Year Numbers Sheet – Why Is Historical Comparison Important?
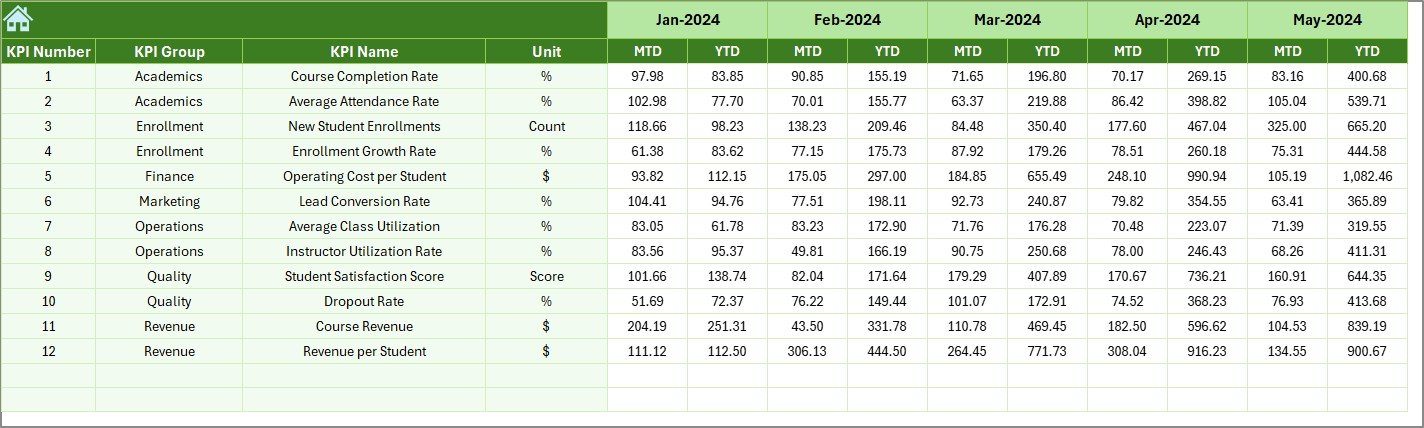
This sheet stores previous year data.
Benefits:
-
Enables year-over-year comparison
-
Highlights growth or decline
-
Supports strategic planning
Moreover, comparing current performance with historical data adds valuable context.
7. KPI Definition Sheet – How Are KPIs Standardized?
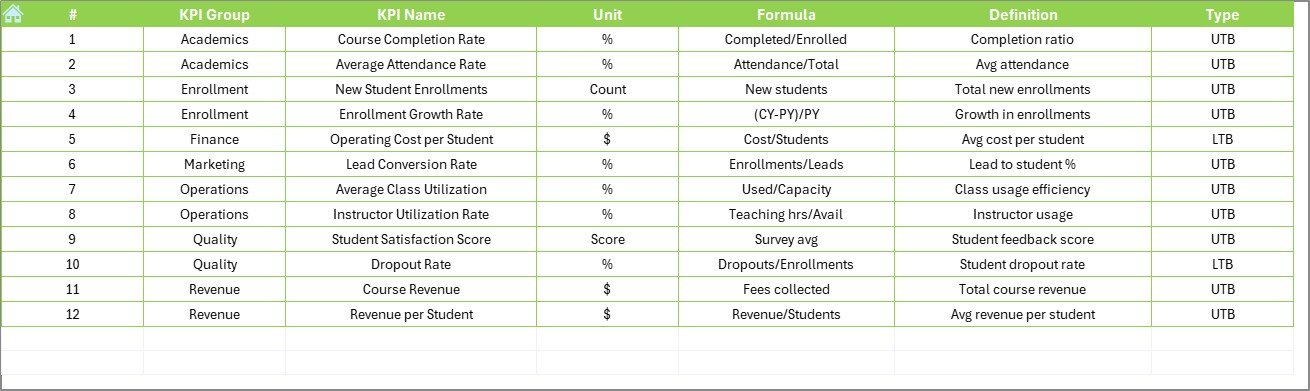
The KPI Definition Sheet acts as the KPI dictionary.
Includes:
-
KPI Name
-
KPI Group
-
Unit
-
Formula
-
Definition
As a result, everyone in the organization understands KPIs clearly and consistently.
What KPIs Can Language Schools Track Using This Dashboard?
Language schools can track KPIs across multiple areas.
Academic KPIs
-
Student attendance rate
-
Course completion rate
-
Student performance improvement
-
Certification success rate
Operational KPIs
-
Class utilization rate
-
Teacher productivity
-
Schedule adherence
Financial KPIs
-
Revenue per student
-
Cost per course
-
Profit margin
Marketing & Enrollment KPIs
-
New student enrollment
-
Conversion rate
-
Dropout rate
Therefore, the dashboard covers both academic and business performance.
Advantages of Language Schools KPI Dashboard in Excel
Using this dashboard brings several powerful benefits.
1. Centralized Performance Monitoring
You track all KPIs in one place. Therefore, decision-making becomes faster.
2. Improved Accountability
Clear targets and results increase ownership across teams.
3. Data-Driven Decisions
You replace assumptions with facts. As a result, strategies become more effective.
4. Time-Saving Reporting
Automated calculations reduce manual work significantly.
5. Cost-Effective Solution
Excel eliminates the need for expensive software tools.
How Does This Dashboard Improve Decision-Making?
Click to Purchases Language Schools KPI Dashboard in Excel
This dashboard supports decision-making in several ways:
-
Identifies underperforming courses early
-
Highlights revenue leakage
-
Improves teacher allocation
-
Supports student retention strategies
Therefore, leadership can act before problems grow.
Best Practices for the Language Schools KPI Dashboard in Excel
To maximize results, follow these best practices.
1. Define Clear KPIs
Select KPIs aligned with academic and business goals.
2. Update Data Regularly
Ensure monthly updates for accuracy.
3. Set Realistic Targets
Avoid unrealistic goals that demotivate teams.
4. Review Trends, Not Just Numbers
Focus on patterns and growth, not single-month results.
5. Train Users Properly
Ensure staff understands how to use and interpret the dashboard.
How Can Language Schools Customize This Dashboard?
This Excel dashboard allows easy customization:
-
Add new KPIs
-
Modify formulas
-
Adjust visual formatting
-
Expand time periods
Therefore, it grows with your institution.
Is Excel Still Relevant for KPI Dashboards in Language Schools?
Yes, Excel remains highly relevant.
Reasons include:
-
Familiar interface
-
High flexibility
-
Easy sharing
-
Low cost
Moreover, Excel dashboards integrate easily with other systems.
Who Can Use the Language Schools KPI Dashboard?
This dashboard suits:
-
Language school owners
-
Academic directors
-
Operations managers
-
Finance teams
-
Marketing managers
Therefore, it supports cross-functional collaboration.
Conclusion: Why Should Language Schools Use a KPI Dashboard in Excel?
A Language Schools KPI Dashboard in Excel transforms raw data into actionable insights. It simplifies performance tracking, improves accountability, and supports smarter decisions.
Moreover, with its structured worksheets, automated calculations, and interactive visuals, this dashboard becomes a powerful management tool. Whether you run a small institute or a large language academy, this dashboard helps you stay competitive, efficient, and student-focused.
In short, if you want clarity, control, and growth, this Excel KPI dashboard becomes a must-have solution.
Frequently Asked Questions (FAQs)
What is a Language Schools KPI Dashboard in Excel?
It is an Excel-based tool that tracks academic, operational, and financial KPIs in one centralized dashboard.
Can small language schools use this dashboard?
Yes, the dashboard suits schools of all sizes due to its flexibility and low cost.
Does the dashboard support MTD and YTD analysis?
Click to Purchases Language Schools KPI Dashboard in Excel
Yes, it tracks both MTD and YTD performance for better insights.
Can KPIs be customized?
Yes, you can add, remove, or modify KPIs easily.
Is technical expertise required to use the dashboard?
No, basic Excel knowledge is sufficient.
How often should data be updated?
Ideally, update data monthly for accurate tracking.
Visit our YouTube channel to learn step-by-step video tutorials