Recruitment agencies operate in a fast-paced, target-driven environment. Every day, teams track candidates, clients, interviews, offers, and revenue. However, without structured performance tracking, agencies lose clarity. As a result, decision-making slows down. Therefore, a Recruitment Agencies KPI Dashboard in Power BI becomes a powerful solution.
In this detailed guide, you will learn what a Recruitment Agencies KPI Dashboard in Power BI is, why it matters, how it works, its structure, advantages, best practices, and common questions. Moreover, this article explains how recruitment agencies can transform raw Excel data into actionable insights using Power BI.
Click to buy Recruitment Agencies KPI Dashboard in Power BI
What Is a Recruitment Agencies KPI Dashboard in Power BI?
A Recruitment Agencies KPI Dashboard in Power BI is an interactive reporting and performance management tool. It tracks key recruitment metrics such as placements, revenue, targets, and efficiency. Instead of reviewing multiple spreadsheets, users see all KPIs in one centralized dashboard.
Moreover, this dashboard focuses on both MTD (Month-to-Date) and YTD (Year-to-Date) performance. As a result, recruitment leaders gain visibility into short-term execution and long-term progress at the same time.
In addition, Power BI dashboards allow dynamic filtering, visual comparisons, and instant trend analysis. Therefore, agencies respond faster to performance gaps and opportunities.
Why Do Recruitment Agencies Need a KPI Dashboard in Power BI?
Recruitment agencies manage multiple KPIs daily. However, manual reporting wastes time and increases errors. That is why Power BI dashboards play a crucial role.
Key Reasons Recruitment Agencies Need KPI Dashboards
- They provide real-time performance visibility
- They reduce manual reporting effort
- They improve data-driven decision-making
- They align recruiters, managers, and leadership
- They highlight target gaps instantly
Furthermore, Power BI dashboards scale easily as agencies grow. Therefore, small firms and large staffing organizations benefit equally.
How Does a Recruitment Agencies KPI Dashboard in Power BI Work?
The dashboard works by connecting Power BI to an Excel data source. Users update KPI data in Excel, and Power BI automatically refreshes visuals.
Data Flow Overview
- Recruiters or analysts update Excel input sheets
- Power BI reads and processes the data
- KPIs calculate MTD and YTD values
- Visuals update automatically
- Users analyze results using slicers and charts
As a result, agencies save time and improve reporting accuracy.
Structure of the Recruitment Agencies KPI Dashboard in Power BI
This ready-to-use dashboard contains three structured pages, each designed for a specific purpose.
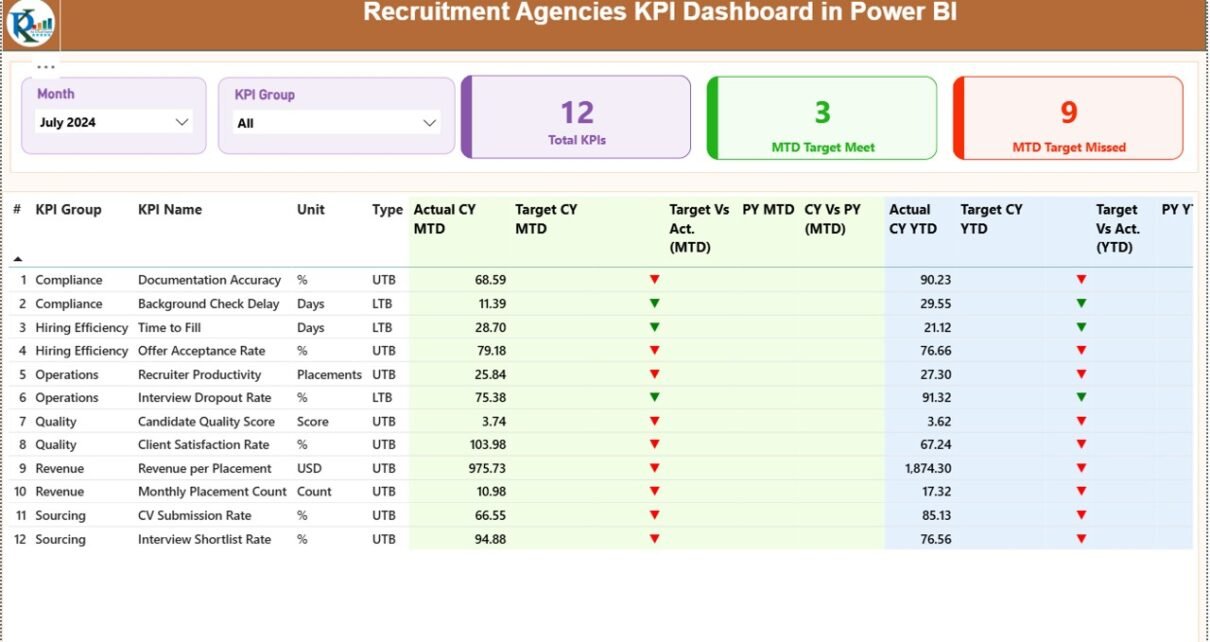
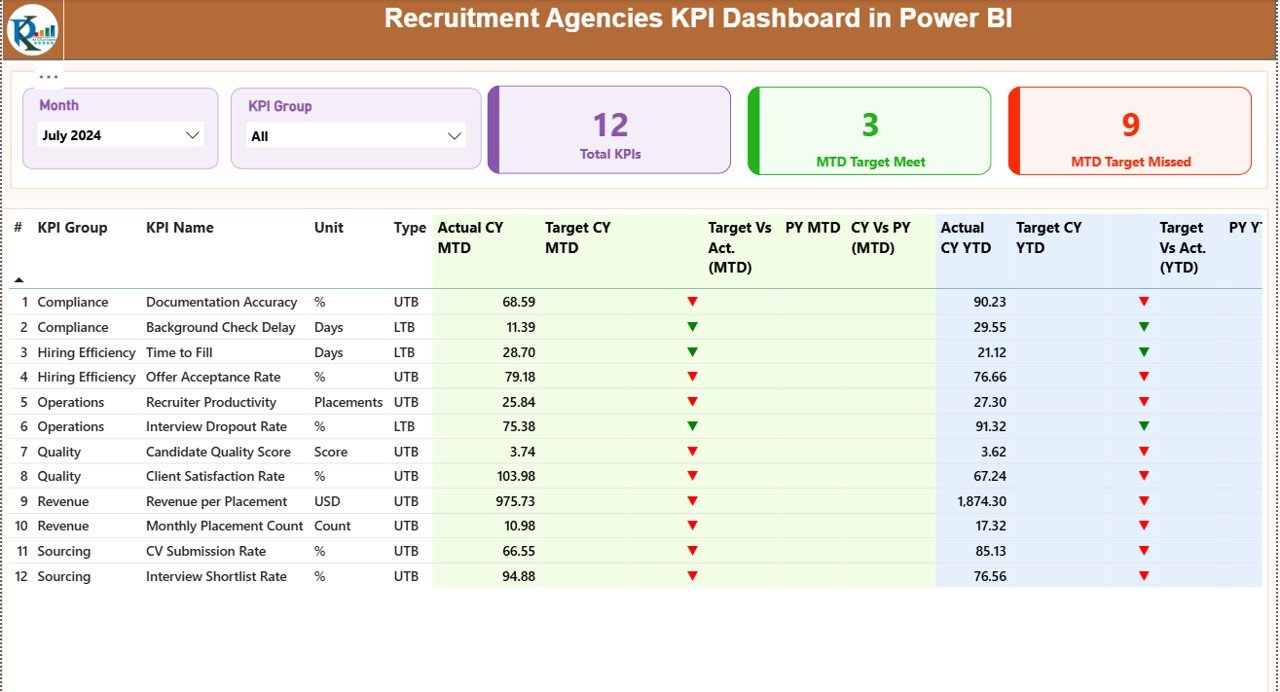
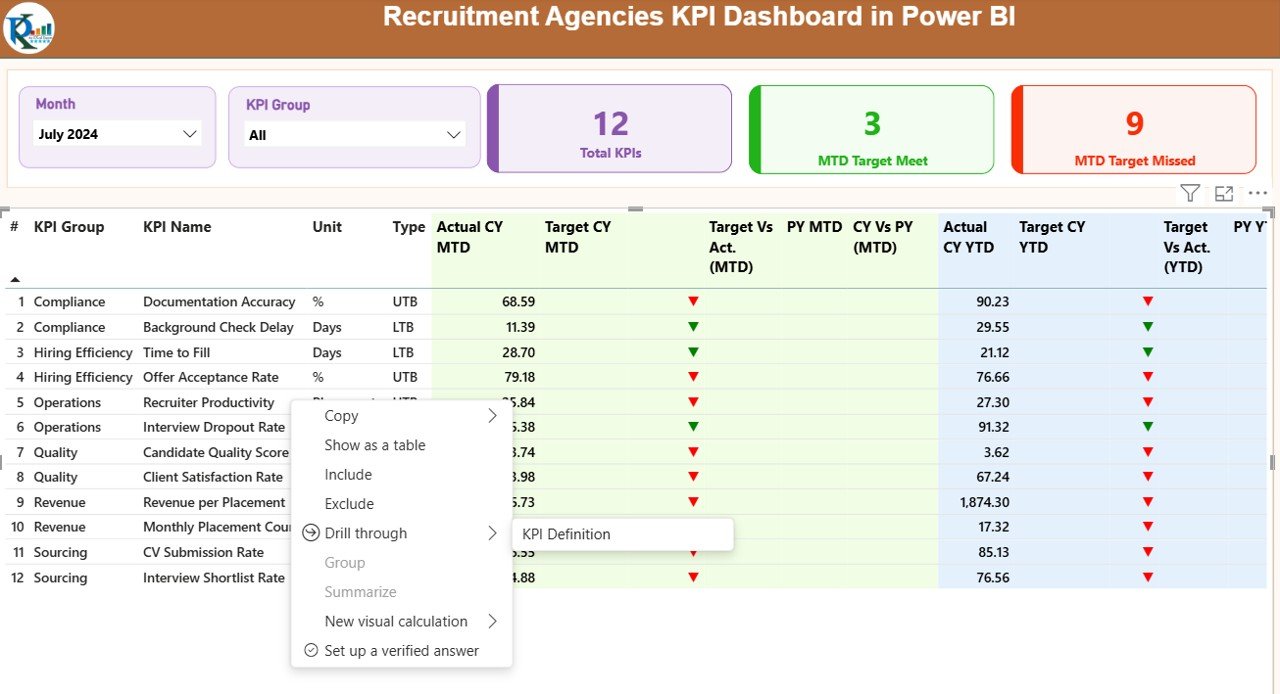
Summary Page
The Summary Page acts as the main control center of the dashboard. It provides a complete KPI snapshot at a glance.
Top-Level Slicers
- Month Slicer – Select a specific month
- KPI Group Slicer – Filter KPIs by category
These slicers dynamically update all visuals on the page.
KPI Cards on the Summary Page
At the top, the dashboard displays three key cards:
- Total KPIs Count
- MTD Target Met Count
- MTD Target Missed Count
These cards quickly show overall performance health.
Detailed KPI Table Explained
Below the cards, a detailed table displays complete KPI information.
KPI Table Columns
- KPI Number – Sequential KPI ID
- KPI Group – Category of KPI
- KPI Name – Metric name
- Unit – Measurement unit
- Type – UTB (Upper the Better) or LTB (Lower the Better)
MTD Performance Columns
- Actual CY MTD – Current year actual MTD value
- Target CY MTD – Current year target MTD value
- MTD Icon – ▲ or ▼ icon with green/red color
- Target vs Actual (MTD) – Actual ÷ Target
- PY MTD – Previous year MTD value
- CY vs PY (MTD) – CY MTD ÷ PY MTD
YTD Performance Columns
- Actual CY YTD – Current year actual YTD value
- Target CY YTD – Current year target YTD value
- YTD Icon – ▲ or ▼ icon with color logic
- Target vs Actual (YTD) – Actual ÷ Target
- PY YTD – Previous year YTD value
- CY vs PY (YTD) – CY YTD ÷ PY YTD
Because of this structure, users identify performance gaps instantly.
Click to buy Recruitment Agencies KPI Dashboard in Power BI
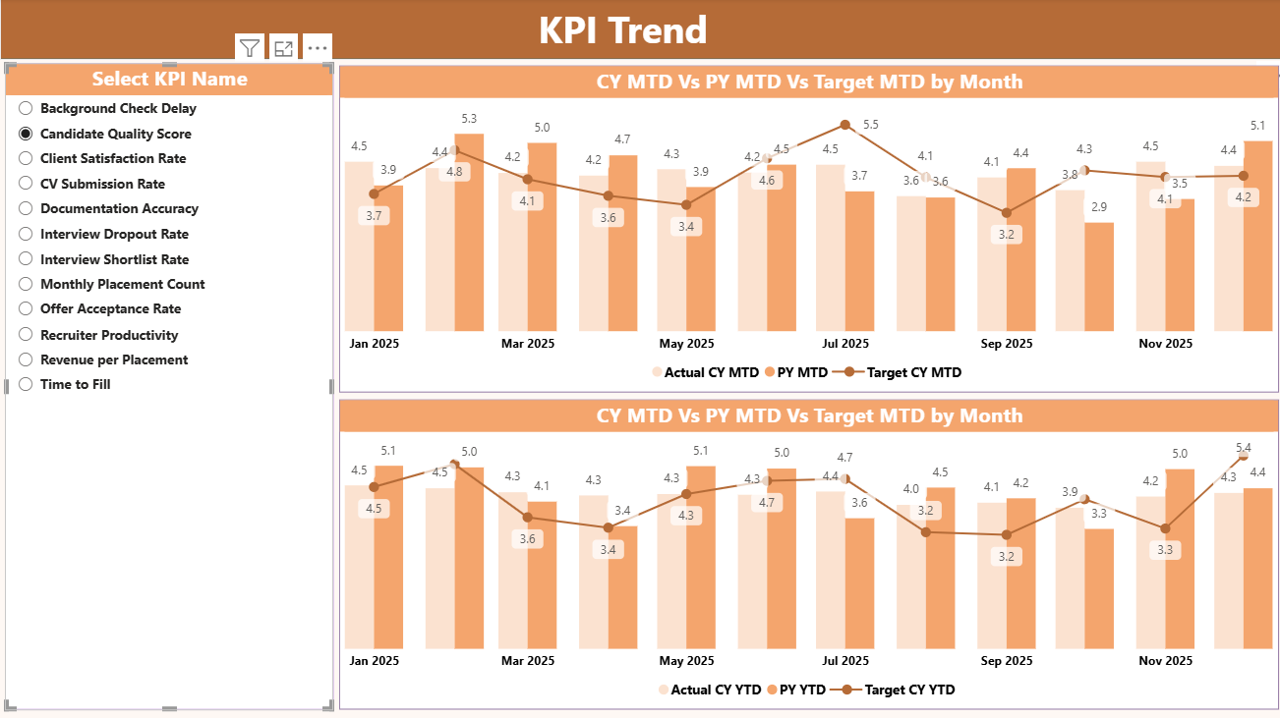
KPI Trend Page
The KPI Trend Page focuses on performance movement over time.
Key Features of the KPI Trend Page
- KPI Name Slicer on the left
- Two Combo Charts for MTD and YTD
Charts Display
- Current Year Actual
- Previous Year Actual
- Target Values
As a result, users compare trends visually and detect patterns early.
Click to buy Recruitment Agencies KPI Dashboard in Power BI
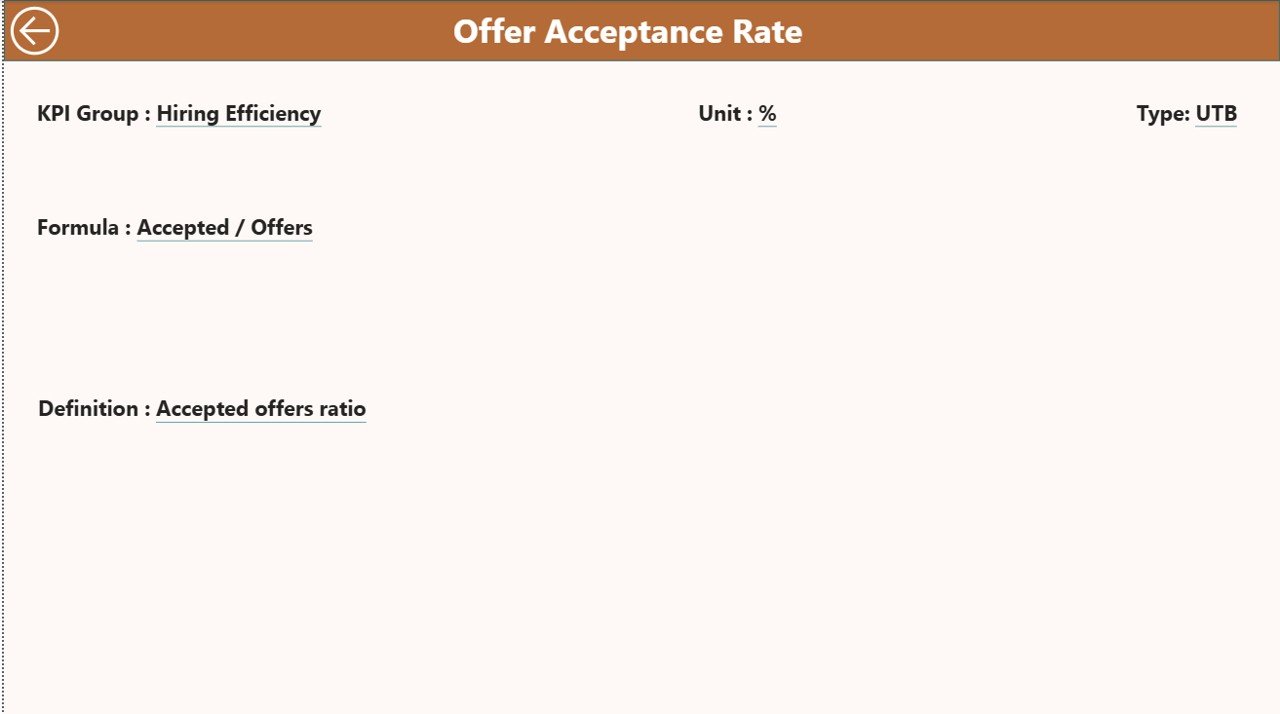
KPI Definition Page
The KPI Definition Page acts as a drill-through reference page.
Purpose of This Page
- Shows KPI Formula
- Explains KPI Definition
- Clarifies measurement logic
This page stays hidden by default. However, users can drill through from the Summary Page.
Navigation Tip
Click the Back Button on the top-left corner to return to the main page.
Click to buy Recruitment Agencies KPI Dashboard in Power BI
What Excel Data Is Required for the Dashboard?
The dashboard uses Excel as its data source. Users only need to update three worksheets.
Input_Actual Sheet
This sheet stores actual KPI values.
Columns to Fill
- KPI Name
- Month (use the first date of the month)
- MTD Actual Value
- YTD Actual Value
Input_Target Sheet
This sheet stores target KPI values.
Columns to Fill
- KPI Name
- Month (use the first date of the month)
- MTD Target Value
- YTD Target Value
Click to buy Recruitment Agencies KPI Dashboard in Power BI
KPI Definition Sheet
This sheet defines KPI logic and metadata.
Columns Included
- KPI Number
- KPI Group
- KPI Name
- Unit
- Formula
- Definition
- Type (UTB or LTB)
Once users update these sheets, Power BI refreshes automatically.
What KPIs Can Recruitment Agencies Track?
Recruitment agencies track a wide range of KPIs using this dashboard.
Common Recruitment KPIs
- Number of placements
- Time to fill positions
- Offer acceptance rate
- Revenue per recruiter
- Client acquisition rate
- Candidate pipeline strength
- Interview-to-hire ratio
- Attrition rate
Because the dashboard supports flexible KPI definitions, agencies customize it easily.
Advantages of Recruitment Agencies KPI Dashboard in Power BI
A KPI dashboard offers both operational and strategic benefits.
Key Advantages
- Faster decision-making
- Centralized performance view
- Reduced manual reporting
- Clear target tracking
- Easy trend analysis
- Improved recruiter productivity
Moreover, leadership teams gain confidence in data accuracy.
How Does This Dashboard Improve Decision-Making?
This dashboard highlights performance gaps immediately. Therefore, managers take corrective actions faster.
Decision-Making Improvements
- Identify underperforming KPIs early
- Compare current and previous year performance
- Adjust targets proactively
- Optimize recruiter workloads
- Improve client and candidate outcomes
As a result, agencies improve profitability and efficiency.
Who Can Use a Recruitment Agencies KPI Dashboard?
This dashboard suits multiple roles.
Ideal Users
- Recruitment Managers
- Staffing Agency Owners
- HR Analytics Teams
- Operations Leaders
- Business Analysts
Since Power BI supports role-based access, data security remains strong.
Best Practices for the Recruitment Agencies KPI Dashboard in Power BI
To get maximum value, follow these best practices.
Best Practices List
- Keep KPI definitions consistent
- Update Excel data regularly
- Use UTB and LTB types correctly
- Review MTD and YTD trends weekly
- Limit KPIs to actionable metrics
- Train teams on dashboard usage
By following these practices, agencies maintain reliable insights.
How to Maintain Data Accuracy in the Dashboard?
Accurate data ensures trustworthy decisions.
Data Accuracy Tips
- Use standardized KPI names
- Avoid manual calculation outside Excel
- Validate month dates carefully
- Lock formula columns
- Review data monthly
As a result, dashboard reliability improves significantly.
How Does This Dashboard Support Growth and Scaling?
As agencies grow, complexity increases. However, this dashboard scales smoothly.
Growth Support Benefits
- Handles increasing KPI volume
- Supports new KPI groups
- Enables long-term trend analysis
- Improves leadership reporting
- Supports multi-team visibility
Therefore, agencies stay in control during expansion.
Conclusion
A Recruitment Agencies KPI Dashboard in Power BI transforms performance tracking from manual reporting into strategic intelligence. By combining Excel data with interactive Power BI visuals, recruitment agencies gain clarity, speed, and control.
This dashboard tracks MTD and YTD performance, compares targets and previous years, and highlights trends instantly. As a result, managers make faster decisions, recruiters stay aligned, and leadership drives growth with confidence.
If recruitment agencies want efficiency, accuracy, and insight, this dashboard becomes an essential business tool.
Frequently Asked Questions (FAQs)
What Is a Recruitment Agencies KPI Dashboard in Power BI?
It is an interactive Power BI dashboard that tracks recruitment KPIs using Excel data sources.
Can I Customize KPIs in This Dashboard?
Yes. You can add, modify, or remove KPIs by updating the Excel KPI Definition sheet.
Does the Dashboard Support MTD and YTD Tracking?
Yes. The dashboard calculates and displays both MTD and YTD values.
Do I Need Advanced Power BI Skills to Use This Dashboard?
No. Basic Power BI knowledge and Excel updates are enough.
Can This Dashboard Compare Previous Year Performance?
Yes. It includes CY vs PY comparisons for both MTD and YTD.
Is Excel Mandatory as a Data Source?
Yes. This dashboard currently uses Excel input sheets for data capture.
Who Benefits Most from This Dashboard?
Recruitment managers, staffing agency owners, and leadership teams benefit the most.
How Often Should Data Be Updated?
You should update data monthly or more frequently for accurate insights.
Visit our YouTube channel to learn step-by-step video tutorials
Watch the step-by-step video tutorial:
Click to buy Recruitment Agencies KPI Dashboard in Power BI