In today’s highly regulated and cost-sensitive chemical industry, data-driven decision-making is no longer optional. Chemical manufacturers deal with massive volumes of operational, financial, environmental, and quality data every single day. However, when this data remains scattered across raw Excel sheets or isolated systems, managers struggle to extract clear insights.
That is exactly where a Chemical Manufacturing Dashboard in Excel becomes a powerful solution.
In this detailed guide, you will learn what a Chemical Manufacturing Dashboard in Excel is, why it matters, how it works, and how each analytical page supports smarter manufacturing decisions. Moreover, this article explains all KPIs, charts, advantages, best practices, and frequently asked questions—using simple language and practical examples.
Click to buy Chemical Manufacturing Dashboard in Excel
What Is a Chemical Manufacturing Dashboard in Excel?
A Chemical Manufacturing Dashboard in Excel is a ready-to-use, interactive analytical tool designed to convert raw chemical plant data into clear KPIs, visual trends, and actionable insights.
Instead of checking multiple reports, production managers, finance teams, and compliance officers can monitor revenue, costs, margins, emissions, quality, safety, and resource consumption from one centralized Excel file.
Because the dashboard runs entirely in Excel, it remains:
- Easy to use
- Cost-effective
- Customizable
- Familiar to operational teams
As a result, organizations gain clarity without investing in complex BI systems.
Why Do Chemical Manufacturers Need a Dashboard in Excel?
Chemical manufacturing operations involve tight margins, high safety risks, and strict environmental regulations. Therefore, companies must track performance continuously and accurately.
However, traditional Excel reports create several challenges:
- Data remains static and hard to interpret
- Trends stay hidden across rows and columns
- KPI tracking becomes time-consuming
- Decision-making slows down
A Chemical Manufacturing Dashboard in Excel solves these issues by visualizing performance instantly. Moreover, it enables leaders to act faster and with confidence.
What Makes This Chemical Manufacturing Dashboard Ready to Use?
This dashboard comes with multiple structured sheet tabs, each focused on a specific business area. Additionally, it follows a clean and logical flow, making navigation easy even for non-technical users.
Let us now explore each dashboard sheet in detail.
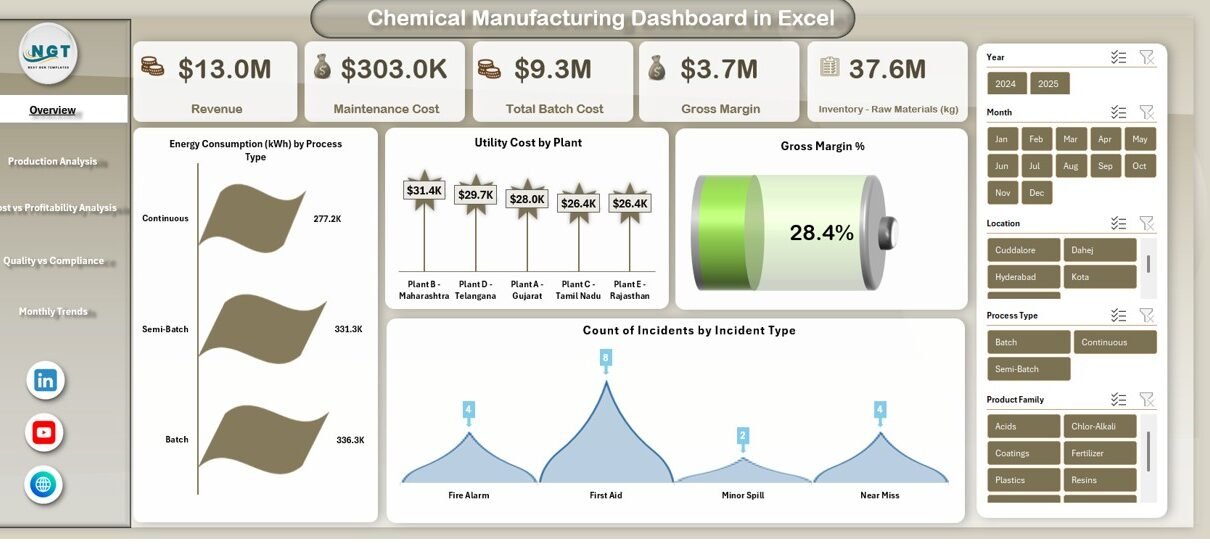
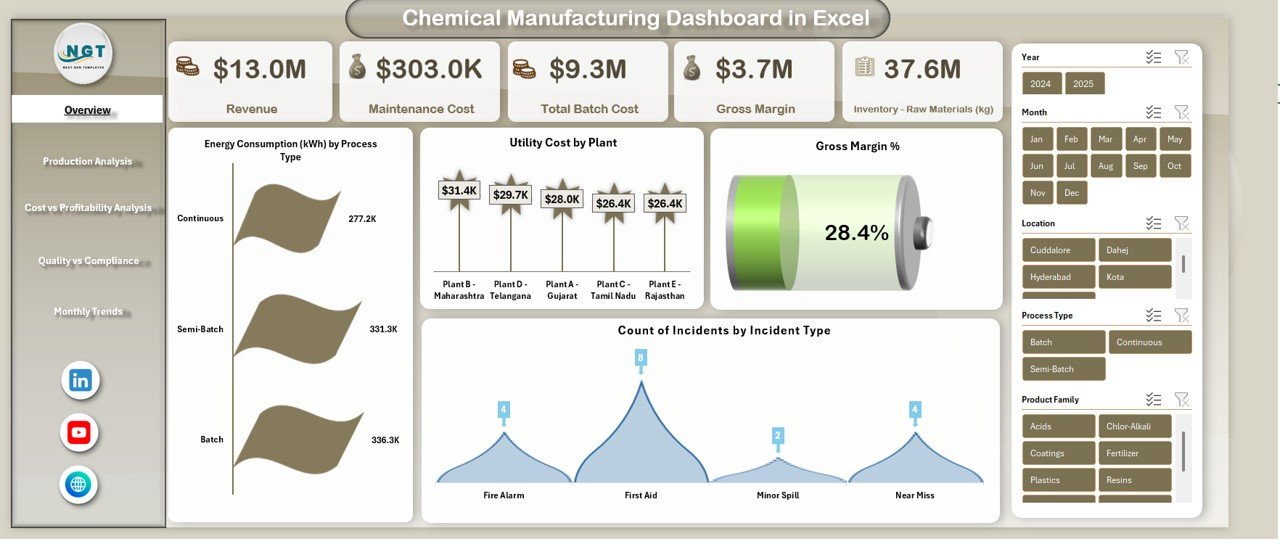
Overview Sheet
The Overview sheet tab works as the executive summary of the entire chemical manufacturing operation. It highlights critical KPIs at a glance, allowing leadership teams to understand overall performance instantly.
Key KPIs Available in the Overview Sheet
- Revenue
Shows total sales generated from chemical products over the selected period. - Maintenance Cost
Tracks expenses related to machinery upkeep and plant maintenance. - Total Batch Cost
Displays the combined cost of raw materials, labor, utilities, and overhead per batch. - Gross Margin
Measures profitability by subtracting costs from revenue. - Gross Margin %
Shows profitability efficiency in percentage terms. - Count of Incidents by Incident Type
Highlights safety performance by categorizing workplace incidents.
Why the Overview Sheet Matters
Because this sheet summarizes performance, decision-makers quickly identify:
- Profitability trends
- Cost pressure areas
- Safety risk patterns
Therefore, leaders can prioritize corrective actions without deep data digging.
Click to buy Chemical Manufacturing Dashboard in Excel
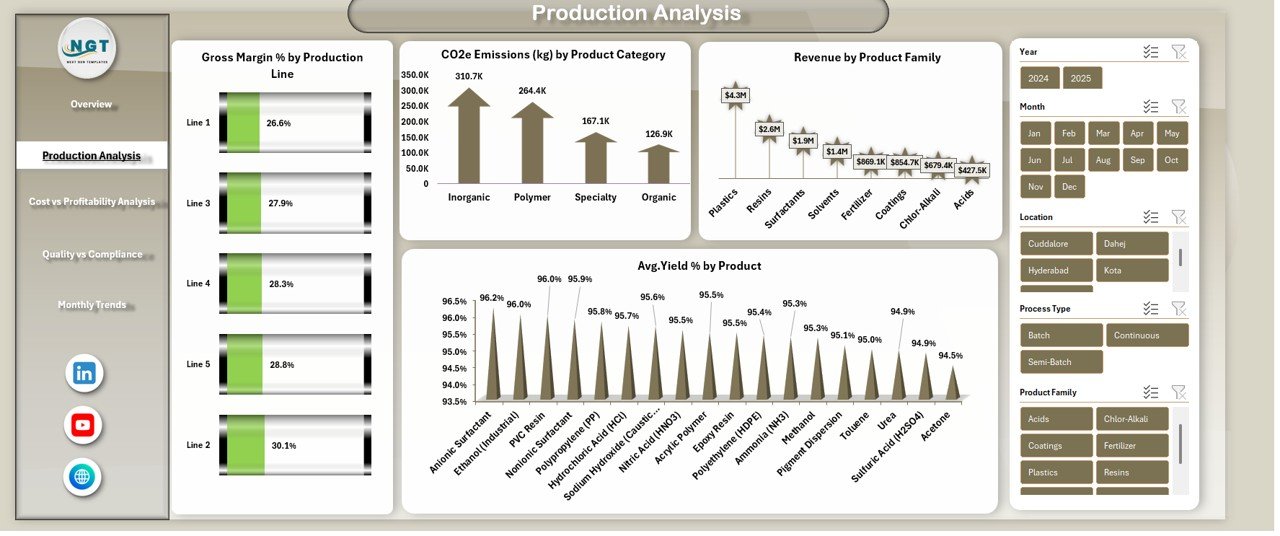
Production Analysis Sheet
The Production Analysis sheet focuses on process efficiency, yield quality, emissions, and product-level performance. As a result, production managers gain clarity on operational strengths and weaknesses.
KPIs and Charts in Production Analysis
- Gross Margin % by Production Line
Helps compare profitability across different production lines. - CO₂e Emissions (kg) by Product Category
Tracks environmental impact at the product level. - Revenue by Product Family
Identifies high-performing and low-performing product groups. - Average Yield % by Product
Measures process efficiency and output quality.
Click to buy Chemical Manufacturing Dashboard in Excel
Why Production Analysis Is Critical
Because chemical processes consume expensive raw materials and energy, even small inefficiencies reduce margins significantly. Therefore, this sheet supports:
- Yield optimization
- Emission reduction planning
- Product profitability improvement
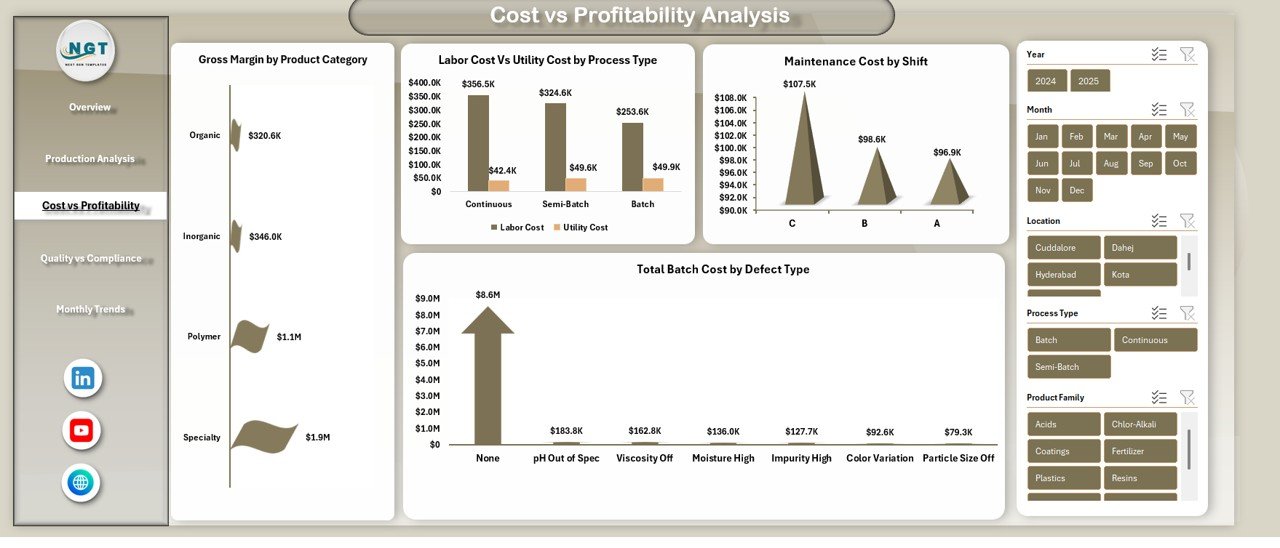
Cost vs Profitability Analysis
Cost control remains one of the biggest challenges in chemical manufacturing. Therefore, the Cost vs Profitability Analysis sheet breaks down expenses in detail and compares them against margins.
Key Insights from This Sheet
- Gross Margin by Product Category
Shows which product categories deliver the highest profits. - Labor Cost vs Utility Cost by Process Type
Compares human resource expenses against energy and utilities. - Maintenance Cost by Shift
Identifies which shifts generate higher maintenance expenses. - Total Batch Cost by Defect Type
Reveals how defects increase batch costs.
Business Value of Cost vs Profitability Analysis
Because cost drivers vary across processes and shifts, this sheet helps managers:
- Reduce avoidable expenses
- Optimize workforce allocation
- Improve batch-level profitability
Click to buy Chemical Manufacturing Dashboard in Excel
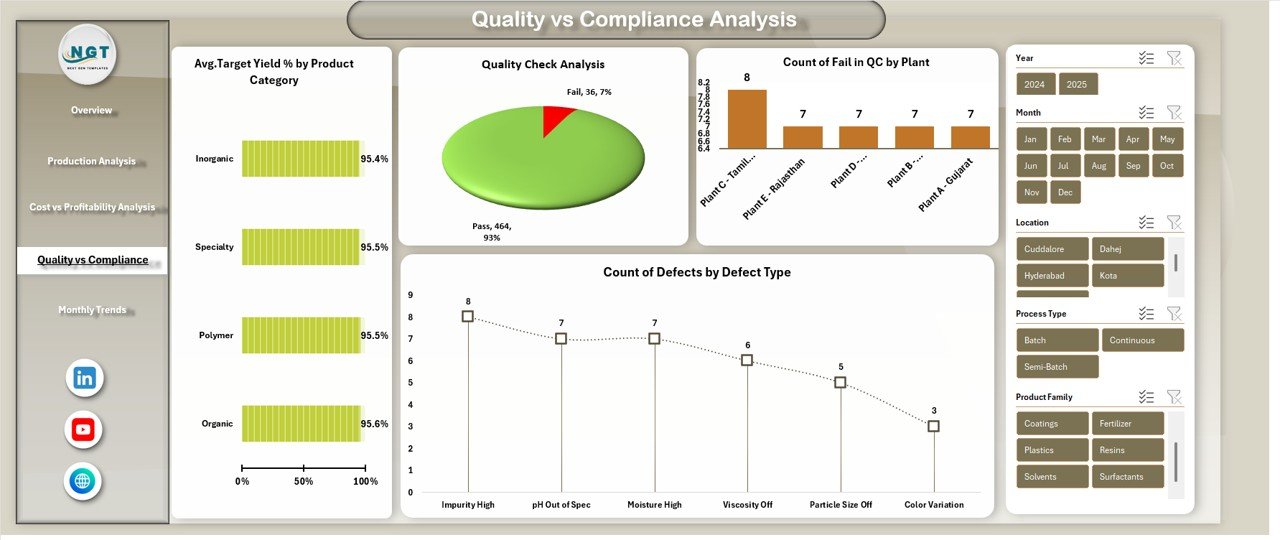
Quality vs Compliance Analysis
Quality failures and compliance issues can damage brand reputation and lead to regulatory penalties. Therefore, the Quality vs Compliance Analysis sheet plays a critical role.
KPIs and Metrics Included
- Average Target Yield % by Product Category
Measures whether production meets defined quality standards. - Total CO₂e Emissions by Region
Tracks regional environmental performance. - Quality Check Analysis
Shows pass and fail rates from quality inspections. - Count of Defects by Defect Type
Identifies recurring quality problems.
Why This Sheet Is Essential
Because regulators closely monitor chemical plants, this analysis:
- Improves audit readiness
- Supports ESG reporting
- Reduces compliance risks
Click to buy Chemical Manufacturing Dashboard in Excel
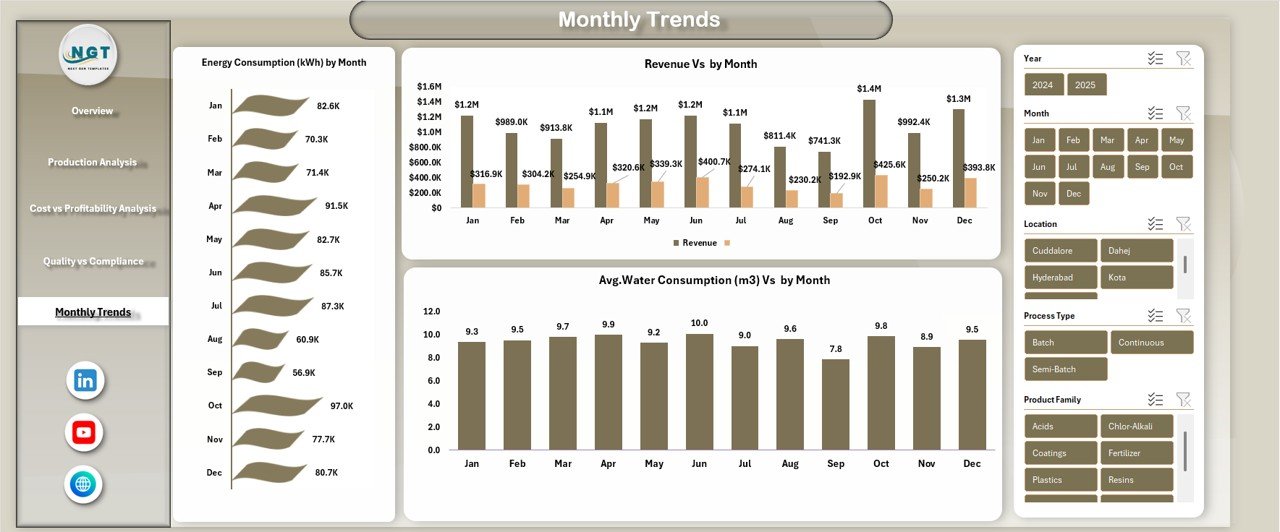
Monthly Trends
Short-term performance snapshots do not tell the full story. Therefore, the Monthly Trends sheet focuses on long-term behavior and seasonal patterns.
Monthly Trend KPIs
- Energy Consumption (kWh) by Month
Highlights energy usage patterns over time. - Revenue vs Month
Shows sales growth or decline trends. - Average Water Consumption (m³) vs Month
Tracks water efficiency improvements or issues.
Click to buy Chemical Manufacturing Dashboard in Excel
Strategic Benefits of Monthly Trend Analysis
Because trends reveal patterns, this sheet helps:
- Forecast energy costs
- Plan production schedules
- Improve sustainability initiatives
Advantages of Chemical Manufacturing Dashboard in Excel
Why Should Chemical Companies Use This Dashboard?
A Chemical Manufacturing Dashboard in Excel delivers multiple advantages across departments.
Key Advantages
- Centralized performance monitoring
- Improved production efficiency tracking
- Better cost and margin control
- Enhanced environmental compliance visibility
- Stronger quality and defect analysis
- Faster decision-making
- No advanced technical skills required
Because Excel remains widely used, adoption becomes easy and fast.
Opportunities for Improvement in Chemical Manufacturing Dashboards
Even though this dashboard provides strong insights, continuous improvement always adds value.
Areas Where Companies Can Improve Further
- Integrate real-time data feeds from ERP systems
- Add predictive trend forecasting models
- Include downtime and OEE analysis
- Enhance drill-down reporting for root cause analysis
- Automate monthly data refresh processes
By evolving the dashboard gradually, organizations unlock even deeper insights.
Best Practices for the Chemical Manufacturing Dashboard in Excel
To maximize value, companies should follow proven best practices.
Recommended Best Practices
- Maintain clean and standardized data inputs
- Update production and cost data regularly
- Use consistent KPI definitions across plants
- Review dashboards in weekly performance meetings
- Combine dashboard insights with operational audits
- Train teams on interpretation, not just navigation
When teams follow these practices, dashboards turn into decision engines instead of static reports.
How Can Managers Use This Dashboard for Decision-Making?
Because the dashboard connects finance, production, quality, and compliance, it supports multiple decision layers:
- Executives use it for profitability and risk oversight
- Plant Managers use it for efficiency and yield control
- Finance Teams track margins and cost drivers
- Quality Teams monitor defects and compliance
- Sustainability Teams analyze emissions and resource use
As a result, every stakeholder operates with aligned information.
Conclusion: Why Is a Chemical Manufacturing Dashboard in Excel a Smart Investment?
A Chemical Manufacturing Dashboard in Excel transforms raw operational data into clear, visual, and actionable insights. Instead of reacting to problems late, organizations identify risks early and act confidently.
Because it combines financial performance, production efficiency, cost control, quality assurance, and sustainability tracking, this dashboard supports smarter manufacturing decisions at every level.
Moreover, since it runs in Excel, companies achieve high impact without high investment.
Frequently Asked Questions (FAQs)
What Is a Chemical Manufacturing Dashboard in Excel Used For?
It helps monitor revenue, costs, margins, production efficiency, emissions, quality, and compliance in one Excel-based system.
Can Small and Mid-Sized Chemical Companies Use This Dashboard?
Yes. Because it runs in Excel, even small plants can implement it without advanced IT infrastructure.
Does This Dashboard Support Environmental Compliance Tracking?
Yes. It includes CO₂e emissions, energy usage, and water consumption analysis.
Can I Customize the KPIs and Charts?
Absolutely. Since it is built in Excel, users can modify KPIs, add charts, and adjust layouts easily.
How Often Should the Dashboard Be Updated?
Ideally, companies should update data monthly or weekly, depending on reporting requirements.
Does This Dashboard Replace ERP or MES Systems?
No. Instead, it complements those systems by turning raw data into clear insights.
Visit our YouTube channel to learn step-by-step video tutorials
Watch the step-by-step video tutorial:
Click to buy Chemical Manufacturing Dashboard in Excel