Managing a veterinary clinic involves much more than treating animals. Every day, clinics handle appointments, services, medications, billing, customer satisfaction, and operational costs. However, when this information stays scattered across multiple Excel sheets or manual registers, tracking performance becomes difficult and time-consuming.
That is exactly where a Veterinary Services Dashboard in Excel becomes an essential business tool.
In this detailed article, you will learn what a Veterinary Services Dashboard in Excel is, why veterinary clinics need it, how it works, and how each analytical page helps clinics improve service quality, revenue, and customer satisfaction. Additionally, this guide explains key charts, advantages, best practices, and frequently asked questions using simple and practical examples.
What Is a Veterinary Services Dashboard in Excel?
Click to Purchases Veterinary Services Dashboard in Excel
A Veterinary Services Dashboard in Excel is a ready-to-use, interactive reporting tool designed to convert raw veterinary clinic data into clear insights and visual performance metrics.
Instead of reviewing long tables of appointment data, service costs, or medication expenses, veterinary managers can instantly see:
-
Service costs by category
-
Medication expenses by visit or pet type
-
Customer satisfaction scores by location or service
-
Monthly performance trends
Because the dashboard works entirely in Microsoft Excel, it remains easy to use, cost-effective, and highly customizable.
Why Do Veterinary Clinics Need a Dashboard in Excel?
Veterinary clinics deal with increasing operational complexity. At the same time, pet owners expect faster service, transparent billing, and better care. Therefore, clinics must track both financial and service-quality metrics closely.
A Veterinary Services Dashboard in Excel helps clinics:
-
Monitor service and medication costs in real time
-
Identify high-revenue and high-cost services
-
Understand customer satisfaction across clinics
-
Compare performance by pet type, service type, and month
-
Improve decision-making using visual data
Moreover, Excel dashboards eliminate the need for expensive BI tools while still delivering professional-level insights.
How Does a Veterinary Services Dashboard in Excel Work?
The dashboard uses structured data stored in Excel tables, such as:
-
Appointment details
-
Service names and categories
-
Pet types
-
Medication costs
-
Bill amounts
-
Customer satisfaction scores
-
Appointment duration
After that, Pivot Tables and Pivot Charts summarize the data dynamically. Slicers allow users to filter information instantly by month, service, pet type, or clinic location. As a result, every chart updates automatically.
Key Features of the Veterinary Services Dashboard in Excel
This Veterinary Services Dashboard in Excel comes as a ready-to-use Excel file with a clean layout, interactive filters, and five analytical pages.
Page Navigator for Easy Navigation
The dashboard includes a Page Navigator on the left side, allowing users to move smoothly between analysis pages. This feature improves usability and saves time during reviews and presentations.
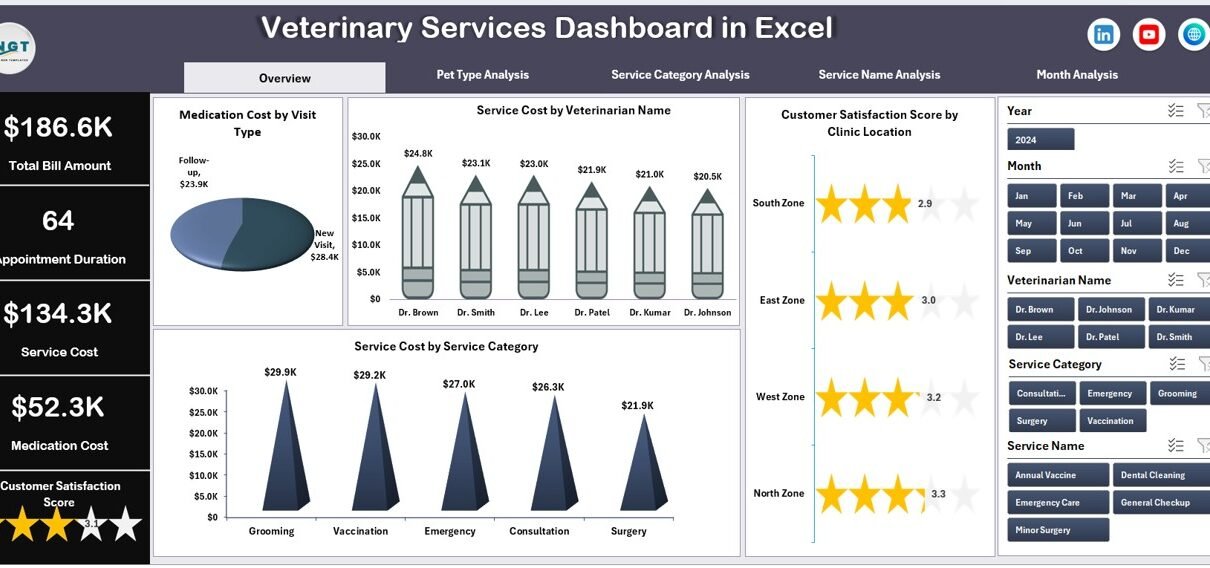
Overview Page: How Does the Veterinary Clinic Perform Overall?
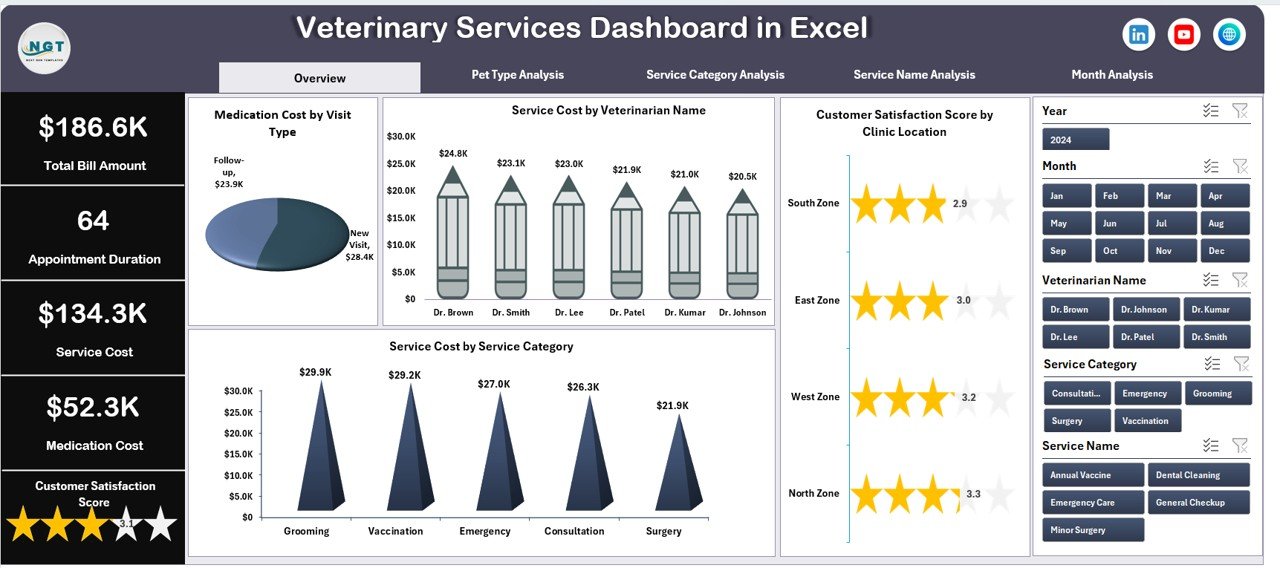
The Overview Page acts as the executive summary of the dashboard. It provides a high-level snapshot of clinic performance using visual charts and KPIs.
Key Highlights of the Overview Page
-
Right-side slicer for dynamic filtering
-
Four key charts for instant insights
Charts Included on the Overview Page
-
Medication Cost by Visit
This chart helps identify visits that incur higher medication expenses. -
Service Cost by Veterinarian Name
This view compares service costs across veterinarians and supports performance evaluation. -
Customer Satisfaction Score by Clinic Location
This chart highlights how customer experience varies by location. -
Service Cost by Service Category
This analysis shows which service categories drive the highest costs.
Together, these visuals help management quickly understand cost drivers and service quality.
Pet Type Analysis Page: How Do Different Pet Types Impact Revenue and Costs?
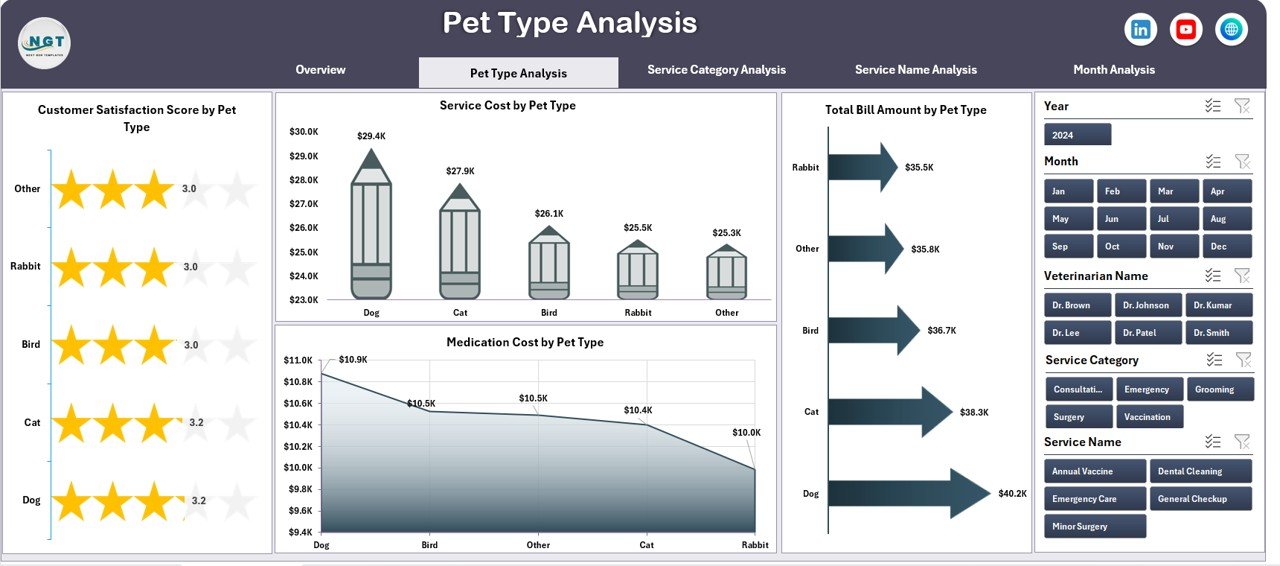
The Pet Type Analysis Page focuses on performance differences across pet categories such as dogs, cats, birds, or exotic animals.
Key Features of Pet Type Analysis
-
Right-side slicer for interactive filtering
-
Four focused charts for pet-wise insights
Charts Included in Pet Type Analysis
-
Customer Satisfaction Score by Pet Type
This chart helps clinics understand which pet owners feel most satisfied. -
Service Cost by Pet Type
This view highlights cost differences between pet categories. -
Total Bill Amount by Pet Type
This chart identifies which pet types generate higher revenue. -
Medication Cost by Pet Type
This analysis supports inventory and medication planning.
As a result, clinics can adjust pricing, staffing, and service strategies based on pet demand.
Service Category Analysis Page: Which Services Perform Best?
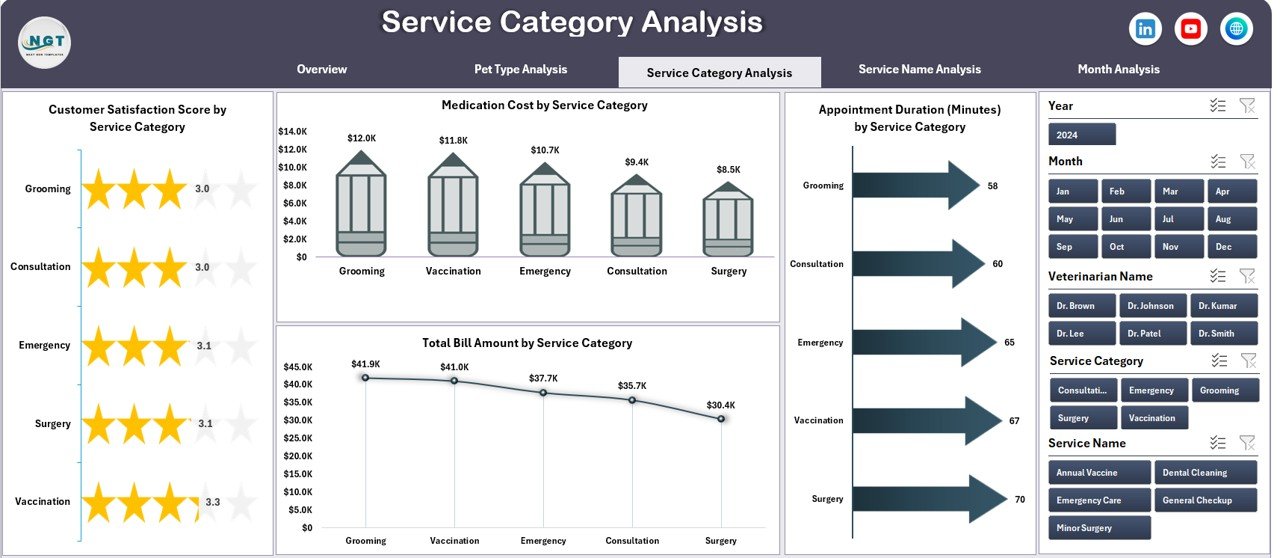
The Service Category Analysis Page breaks down performance by service categories such as consultation, surgery, vaccination, grooming, or diagnostics.
Why Is Service Category Analysis Important?
Different services carry different cost structures, time requirements, and customer expectations. Therefore, analyzing them separately improves profitability and efficiency.
Charts Included in Service Category Analysis
-
Customer Satisfaction Score by Service Category
This chart reveals which services delight customers most. -
Total Bill Amount by Service Category
This view highlights revenue-generating services. -
Medication Cost by Service Category
This chart supports cost control and procurement planning. -
Appointment Duration (Minutes) by Service Category
This analysis helps clinics manage time and staff workload.
Using this page, clinics can optimize pricing, staffing, and service offerings.
Service Name Analysis Page: How Do Individual Services Perform?
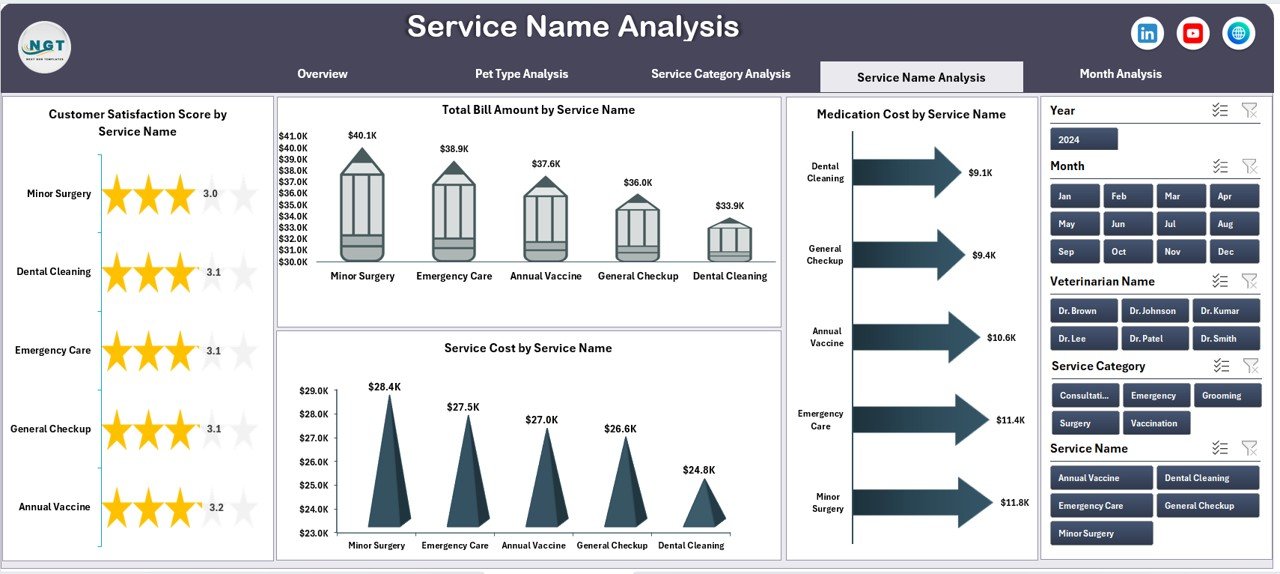
The Service Name Analysis Page dives deeper into individual service performance instead of grouped categories.
Benefits of Service Name Analysis
-
Identifies high-performing and low-performing services
-
Highlights services with high medication or service costs
-
Supports service-level decision-making
Charts Included in Service Name Analysis
-
Customer Satisfaction Score by Service Name
This chart helps identify services that need quality improvement. -
Total Bill Amount by Service Name
This view shows which services contribute most to revenue. -
Medication Cost by Service Name
This chart highlights cost-heavy services. -
Service Cost by Service Name
This analysis helps control operational expenses.
As a result, clinics can refine service pricing and improve service delivery.
Click to Purchases Veterinary Services Dashboard in Excel
Month Analysis Page: How Does Performance Change Over Time?
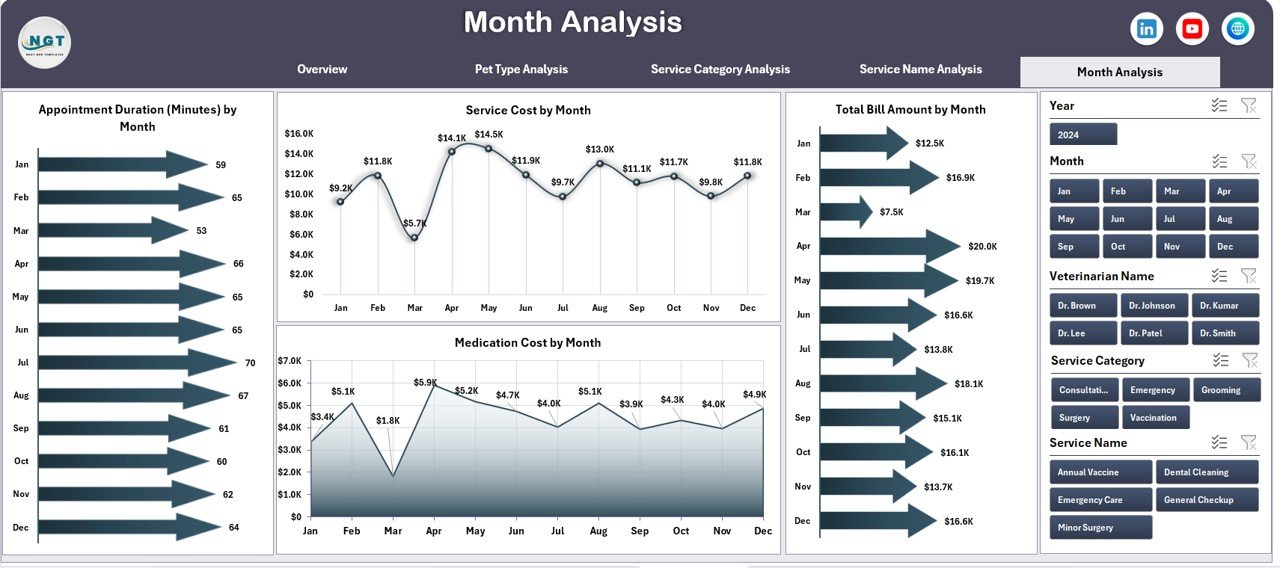
The Month Analysis Page focuses on time-based trends, helping clinics track seasonal patterns and performance changes.
Why Is Monthly Analysis Essential?
Veterinary clinics often experience seasonal demand fluctuations. Therefore, month-wise analysis helps with planning and forecasting.
Key Benefits of Month Analysis
-
Identifies peak and low demand months
-
Tracks cost and revenue trends
-
Supports staffing and inventory planning
Using this page, clinics can prepare better for busy seasons and control costs during slow periods.
Advantages of Veterinary Services Dashboard in Excel
Using a Veterinary Services Dashboard in Excel offers multiple business and operational advantages.
Key Advantages
-
Centralized Data View
All critical metrics appear in one place, reducing manual work. -
Improved Decision-Making
Visual insights support faster and better decisions. -
Cost Control
Clear visibility into medication and service costs helps reduce wastage. -
Better Customer Experience
Tracking satisfaction scores improves service quality. -
Time Savings
Automated charts eliminate repetitive reporting tasks. -
No Advanced Tools Required
Excel familiarity ensures easy adoption.
Opportunities for Improvement Using the Dashboard
Although the dashboard provides strong insights, clinics can further enhance performance by acting on the data.
Improvement Opportunities
-
Optimize high-cost services with low satisfaction scores
-
Improve training for services with longer appointment durations
-
Adjust pricing for high-demand pet types
-
Enhance customer experience at low-scoring clinic locations
By reviewing the dashboard regularly, clinics can implement continuous improvement.
Best Practices for the Veterinary Services Dashboard in Excel
Following best practices ensures long-term value from the dashboard.
Data Management Best Practices
-
Enter data consistently and accurately
-
Use standardized service and pet names
-
Update data regularly
Dashboard Usage Best Practices
-
Review dashboards weekly or monthly
-
Use slicers to focus on specific insights
-
Share dashboards with management teams
Operational Best Practices
-
Combine dashboard insights with staff feedback
-
Track trends instead of isolated values
-
Use data for planning, not just reporting
-
Click to Purchases Veterinary Services Dashboard in Excel
Who Can Benefit from a Veterinary Services Dashboard in Excel?
This dashboard serves multiple roles within veterinary organizations.
Beneficiaries
-
Veterinary clinic owners
-
Practice managers
-
Operations teams
-
Finance and billing teams
-
Quality and customer service teams
Because Excel remains widely used, the dashboard fits both small clinics and multi-location practices.
Conclusion: Why Should You Use a Veterinary Services Dashboard in Excel?
A Veterinary Services Dashboard in Excel transforms raw clinic data into meaningful insights. It helps clinics control costs, improve service quality, enhance customer satisfaction, and make data-driven decisions without complex tools.
Moreover, its interactive design, structured analysis pages, and clear visuals make it an ideal solution for modern veterinary practices seeking efficiency and growth.
Frequently Asked Questions (FAQs)
What data do I need for a Veterinary Services Dashboard in Excel?
You need appointment details, service names and categories, pet types, bill amounts, medication costs, appointment duration, and customer satisfaction scores.
Can small veterinary clinics use this dashboard?
Yes, small clinics can easily use this dashboard because it works entirely in Excel and does not require advanced technical skills.
Does the dashboard support monthly analysis?
Yes, the Month Analysis page tracks trends over time and supports seasonal planning.
Can I customize the dashboard?
Yes, you can modify charts, add KPIs, and adjust layouts based on your clinic’s needs.
Do I need Power BI or advanced tools?
No, the dashboard works fully in Microsoft Excel using Pivot Tables and Pivot Charts.
Visit our YouTube channel to learn step-by-step video tutorials