Agriculture is changing rapidly. Farmers and agribusinesses now rely on data, sensors, and smart technologies to improve productivity, reduce waste, and manage resources efficiently. However, when performance data stays scattered across registers, apps, or unstructured spreadsheets, decision-making becomes slow and unclear.
That is exactly where a Smart Agriculture KPI Scorecard in Excel becomes a powerful solution.
In this detailed article, you will learn what a Smart Agriculture KPI Scorecard in Excel is, how it works, its key features, advantages, best practices, and how agriculture teams can use it effectively to monitor performance using MTD and YTD KPIs.
Click to Purchases Smart Agriculture KPI Scorecard in Excel
What Is a Smart Agriculture KPI Scorecard in Excel?
A Smart Agriculture KPI Scorecard in Excel is a ready-to-use Excel template designed to track, analyze, and monitor key performance indicators related to modern agricultural operations.
Instead of reviewing raw data manually, this scorecard converts agricultural data into clear KPIs, trends, and comparisons. As a result, farmers, farm managers, and agribusiness leaders can make informed decisions faster.
Because it works in Excel, teams can use it without investing in expensive analytics tools.
Why Are KPIs Important in Smart Agriculture?
Smart agriculture depends on measurable performance. Therefore, without KPIs, it becomes difficult to evaluate efficiency and improvement.
A KPI scorecard helps agriculture teams:
-
Monitor crop productivity and efficiency
-
Compare actual performance with targets
-
Identify improvement areas early
-
Track performance over time
-
Support data-driven farming decisions
When KPIs remain visible and structured, farming operations become more predictable and sustainable.
How Does a Smart Agriculture KPI Scorecard in Excel Work?
This scorecard works through four interconnected worksheets, each serving a specific purpose. Together, they create a complete KPI monitoring system.
Let us explore each worksheet in detail.
Click to Purchases Smart Agriculture KPI Scorecard in Excel
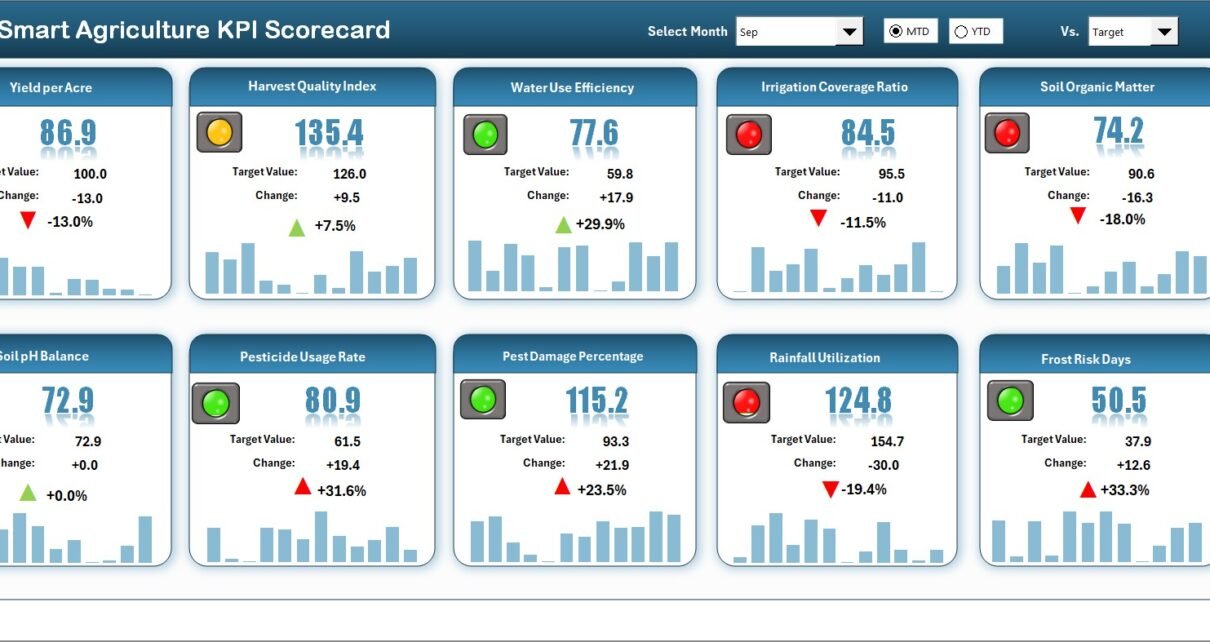
Scorecard Sheet: Main KPI Performance View
The Scorecard sheet is the main interface of the Smart Agriculture KPI Scorecard in Excel. This sheet provides a complete overview of KPI performance at a glance.
Dropdown Menus for Flexible Analysis
At the top of the Scorecard sheet, users can select:
-
Month
-
MTD (Month-to-Date)
-
YTD (Year-to-Date)
Based on these selections, the entire scorecard updates automatically. Therefore, users can analyze short-term and long-term performance easily.
Actual vs Target KPI Comparison
The scorecard clearly displays:
-
Actual values
-
Target values
By comparing these two values, users can immediately identify whether performance meets expectations.
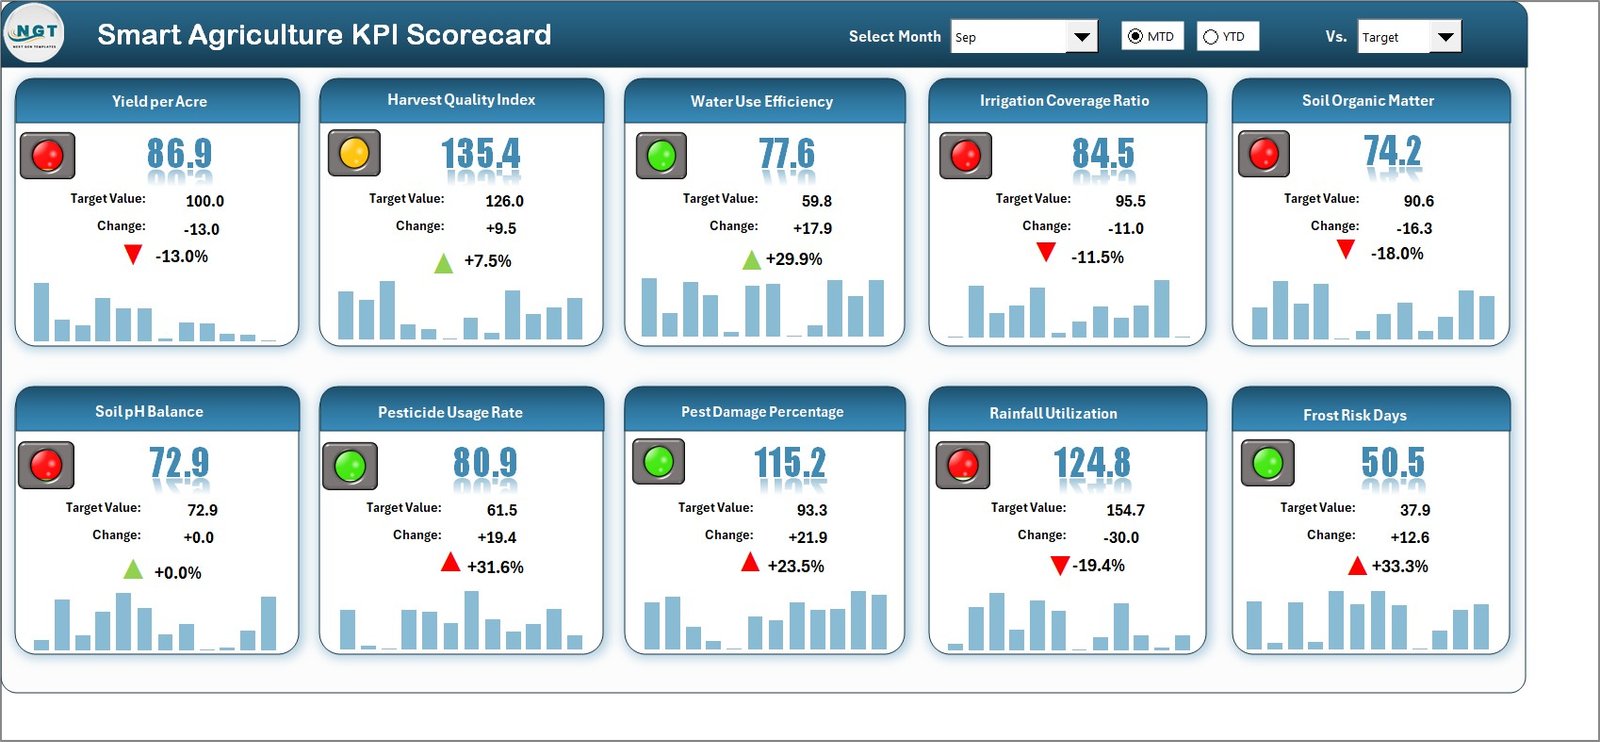
Visual Indicators for Quick Insights
The scorecard uses color-coded visuals and conditional formatting to highlight performance status.
For example:
-
Green indicates good performance
-
Amber shows attention required
-
Red highlights underperformance
Because of these visuals, users do not need to read numbers deeply to understand performance.
Comprehensive KPI Overview
The Scorecard sheet shows:
-
KPI Name
-
KPI Group
-
MTD Actual vs Target
-
YTD Actual vs Target
As a result, decision-makers get a clear and consolidated view of agricultural KPIs.
Click to Purchases Smart Agriculture KPI Scorecard in Excel
KPI Trend Sheet: Analyze KPI Behavior Over Time
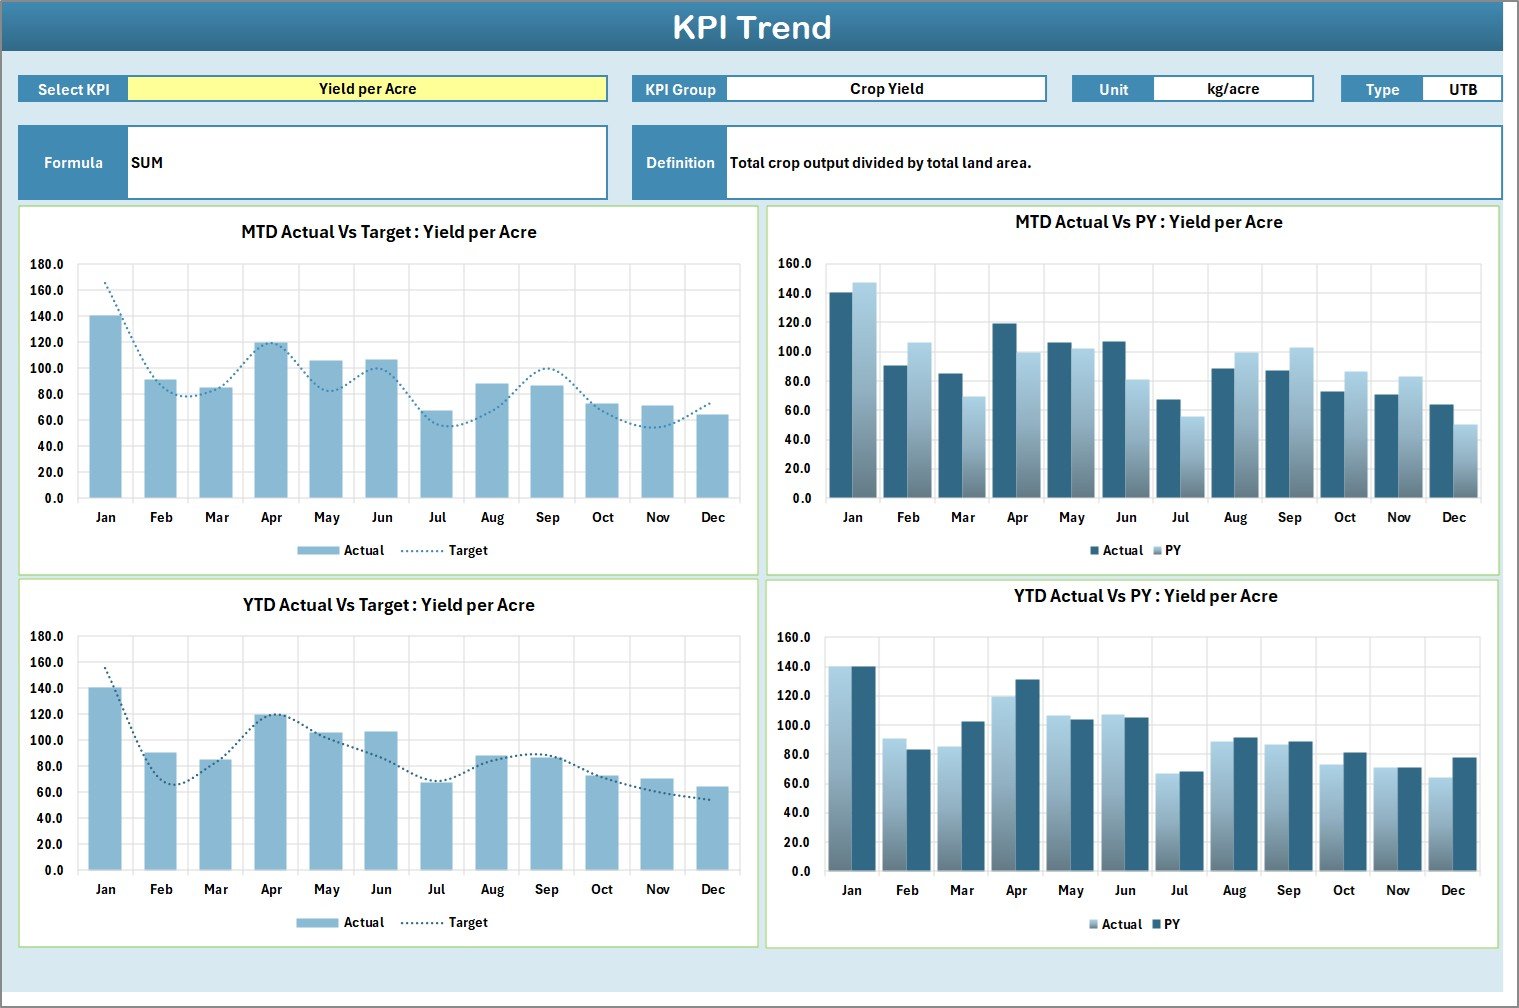
While the Scorecard sheet provides a snapshot, the KPI Trend sheet focuses on deeper analysis.
KPI Selection Dropdown
On the KPI Trend sheet, users can select a KPI name from the dropdown available in cell C3.
Once selected, the sheet updates automatically.
KPI Details Displayed
For the selected KPI, the sheet displays:
-
KPI Group
-
Unit of KPI
-
Type of KPI (Lower the Better or Upper the Better)
-
KPI Formula
-
KPI Definition
Because of this setup, users always understand what each KPI measures.
MTD and YTD Trend Charts
The KPI Trend sheet also displays trend charts for:
-
Actual values
-
Target values
-
Previous Year (PY) values
These trends appear for both MTD and YTD, which helps users understand performance movement over time.
Why Trend Analysis Matters in Agriculture
Agriculture performance changes due to weather, seasonality, and resource availability. Therefore, trend analysis helps:
-
Identify patterns early
-
Detect declining performance
-
Compare current results with previous years
As a result, planning becomes more accurate.
Input Data Sheet: Central Data Entry Area
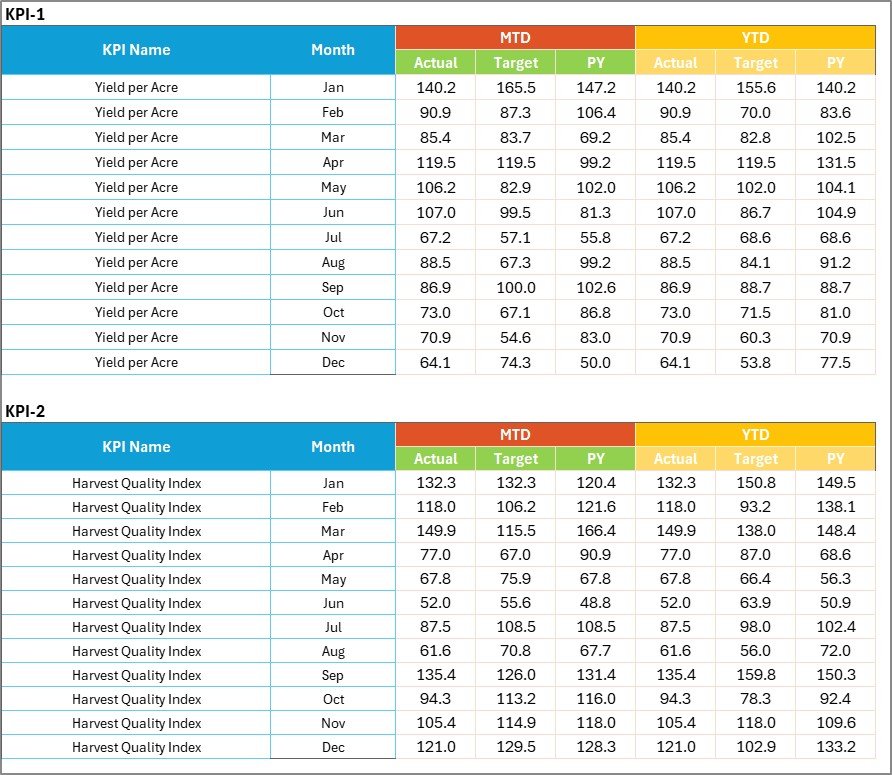
The Input Data sheet is where users enter all KPI-related data.
Data Entry Simplicity
In this sheet, users can record:
-
Actual KPI values
-
Target values
-
Monthly or periodic data
Because the structure stays simple, data entry remains fast and error-free.
Flexibility and Easy Updates
As new data becomes available, users can update the Input Data sheet easily. Consequently, the entire scorecard refreshes automatically.
This flexibility ensures that the scorecard always reflects the latest performance.
Click to Purchases Smart Agriculture KPI Scorecard in Excel
KPI Definition Sheet: Standardize KPI Understanding
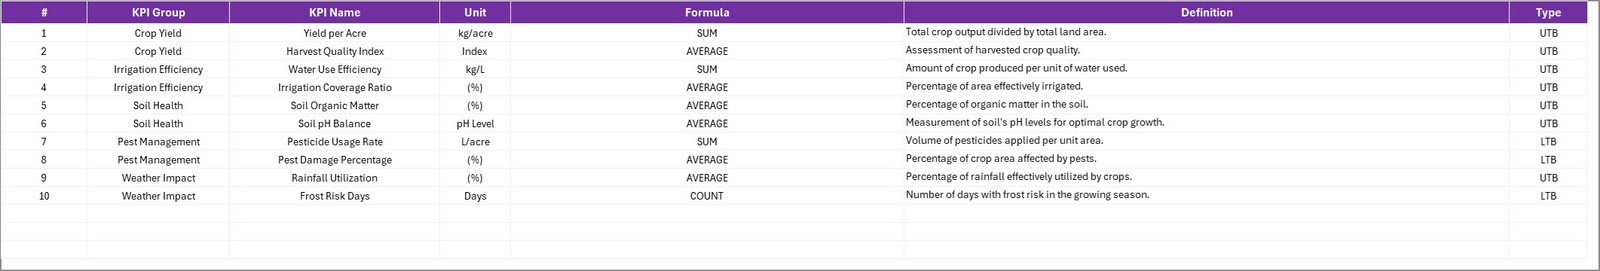
The KPI Definition sheet ensures clarity and consistency across all KPIs.
What Information Does This Sheet Capture?
In this sheet, users define:
-
KPI Name
-
KPI Group
-
Unit
-
Formula
-
KPI Definition
Because of this documentation, all stakeholders interpret KPIs in the same way.
Why KPI Definitions Are Important
Clear KPI definitions help:
-
Avoid confusion
-
Maintain consistency
-
Improve reporting accuracy
-
Support training and onboarding
As agriculture teams grow, this sheet becomes extremely valuable.
How Smart Agriculture KPI Scorecard Improves Decision-Making
This scorecard improves decision-making by turning raw data into structured insights.
First, it highlights performance gaps clearly.
Second, it tracks progress using MTD and YTD views.
Third, it visualizes trends for better understanding.
Finally, it supports timely corrective actions.
Because all insights appear in one Excel file, decisions become faster and more confident.
Click to Purchases Smart Agriculture KPI Scorecard in Excel
Advantages of Smart Agriculture KPI Scorecard in Excel
Using this KPI scorecard provides several practical benefits.
Centralized KPI Monitoring
All agriculture KPIs stay in one structured scorecard, which improves visibility and control.
Easy to Use and Maintain
Since the template runs in Excel, users do not need advanced technical skills.
Visual Performance Tracking
Color-coded indicators and trend charts make performance interpretation simple.
Better Target Management
Actual vs target comparisons help teams stay aligned with farming goals.
Historical Performance Comparison
MTD, YTD, and PY trends support long-term analysis and planning.
Cost-Effective Analytics Solution
This Excel-based scorecard eliminates the need for expensive BI tools.
Click to Purchases Smart Agriculture KPI Scorecard in Excel
Best Practices for Smart Agriculture KPI Scorecard in Excel
To get maximum value from this scorecard, agriculture teams should follow these best practices.
Define KPIs Clearly
Always maintain clear KPI names, units, and definitions in the KPI Definition sheet.
Update Input Data Regularly
Frequent data updates ensure accurate and reliable performance tracking.
Review KPIs Monthly
Monthly reviews help identify issues early and improve responsiveness.
Use Trend Analysis for Planning
Analyze trends instead of relying only on current values.
Align Targets with Farming Goals
Ensure that KPI targets reflect realistic and strategic objectives.
Who Should Use a Smart Agriculture KPI Scorecard in Excel?
This scorecard suits many agriculture-related roles, including:
-
Farm owners
-
Smart farming teams
-
Agribusiness managers
-
Agriculture consultants
-
Research institutions
-
Government agriculture departments
Because of its flexible design, it adapts easily to different farming models.
Common Use Cases of Smart Agriculture KPI Scorecard
Organizations can use this scorecard for:
-
Crop performance monitoring
-
Resource efficiency tracking
-
Yield analysis
-
Sustainability reporting
-
Seasonal performance comparison
How Does This Scorecard Support Sustainable Agriculture?
Sustainable agriculture requires consistent monitoring. This scorecard supports sustainability by:
-
Tracking efficiency KPIs
-
Highlighting waste or underperformance
-
Supporting data-driven improvements
-
Encouraging long-term planning
As a result, farms operate more responsibly and profitably.
Click to Purchases Smart Agriculture KPI Scorecard in Excel
Conclusion: Why Use a Smart Agriculture KPI Scorecard in Excel?
A Smart Agriculture KPI Scorecard in Excel provides a structured, visual, and data-driven approach to monitoring agricultural performance. Instead of relying on assumptions, teams can track actual vs target, analyze MTD and YTD trends, and make informed decisions.
With features like interactive scorecards, KPI trend analysis, centralized input data, and clear KPI definitions, this Excel template becomes an essential tool for modern agriculture management.
If you want to improve productivity, efficiency, and planning in smart farming, this KPI scorecard is a practical and powerful solution.
Frequently Asked Questions (FAQs)
What is a Smart Agriculture KPI Scorecard in Excel?
It is an Excel-based template used to track and analyze smart agriculture KPIs using MTD, YTD, and trend analysis.
Can I customize the KPIs?
Yes, you can easily add, modify, or remove KPIs based on your agriculture needs.
Does the scorecard update automatically?
Yes, the scorecard updates automatically when you change the input data or dropdown selections.
Do I need advanced Excel knowledge to use it?
No, basic Excel knowledge is sufficient to use this KPI scorecard.
Can I track historical performance?
Yes, the scorecard supports MTD, YTD, and previous year trend analysis.
Is this scorecard suitable for small farms?
Yes, both small farms and large agribusinesses can use this template effectively.
Can multiple users work on this scorecard?
Yes, teams can collaborate by sharing the Excel file with proper access control.
Click to Purchases Smart Agriculture KPI Scorecard in Excel
Visit our YouTube channel to learn step-by-step video tutorials

