Destination Management Companies (DMCs) play a vital role in the travel, tourism, and events industry. They handle logistics, vendor coordination, client experiences, budgeting, and service delivery across multiple destinations. Because operations stay complex and fast-moving, DMCs must track performance carefully and consistently.
However, many destination management companies still rely on scattered Excel files, emails, or manual reports. As a result, decision-makers lose visibility, miss trends, and struggle to improve performance.
That is exactly where a Destination Management Companies KPI Dashboard in Excel delivers powerful value.
Click to Purchases Destination Management Companies KPI Dashboard in Excel
In this detailed article, you will learn what a Destination Management Companies KPI Dashboard in Excel is, why it matters, how it works, its structure, key features, advantages, best practices, and frequently asked questions. By the end, you will clearly understand how this dashboard helps DMCs manage operations, control costs, and improve client satisfaction using Excel.
What Is a Destination Management Companies KPI Dashboard in Excel?
A Destination Management Companies KPI Dashboard in Excel is a structured, interactive reporting tool designed to track, analyze, and monitor key performance indicators related to destination management operations.
Instead of reviewing multiple spreadsheets or static reports, users analyze all KPIs in one centralized Excel dashboard. Consequently, management teams gain instant insights into operational performance, financial efficiency, service quality, and client outcomes.
Because Excel supports formulas, charts, drop-downs, and conditional formatting, this dashboard transforms raw data into meaningful visual insights. Moreover, it allows DMCs to make faster and smarter decisions without relying on complex software.
Why Do Destination Management Companies Need a KPI Dashboard in Excel?
Destination management involves many moving parts. Therefore, tracking performance without a structured system creates confusion and inefficiency.
Here is why DMCs need a KPI Dashboard in Excel:
-
They manage multiple destinations, vendors, and clients
-
They track event execution, logistics, and service delivery
-
They monitor costs, margins, and revenue performance
-
They measure client satisfaction and service quality
-
They need monthly and yearly performance comparison
Because a KPI dashboard centralizes all metrics, it helps teams stay aligned, proactive, and data-driven.
How Does a Destination Management Companies KPI Dashboard in Excel Work?
The dashboard works by connecting structured data inputs with automated calculations and visuals.
Here is how the workflow typically looks:
-
You enter actual KPI values month by month
-
You define target values for each KPI
-
You enter previous year numbers for comparison
-
Excel formulas calculate MTD, YTD, variances, and trends
-
The dashboard updates visuals automatically
As a result, users see real-time performance insights without manual recalculation.
What Are the Key Features of the Destination Management Companies KPI Dashboard in Excel?
This ready-to-use Excel dashboard includes well-designed worksheets that work together seamlessly.
Let us explore each worksheet in detail.
What Is the Home Sheet in the KPI Dashboard?
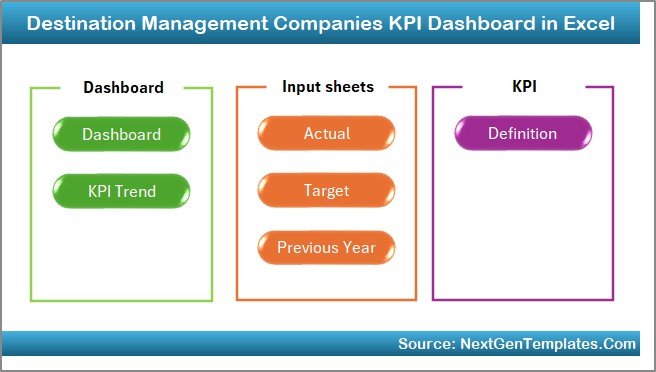
The Home Sheet acts as the index page of the dashboard.
Key Highlights of the Home Sheet
-
Provides 6 navigation buttons
-
Allows users to jump directly to specific sheets
-
Improves usability and navigation
-
Creates a professional dashboard experience
Because users do not need to search manually, they save time and reduce errors.
What Information Does the Dashboard Sheet Show?
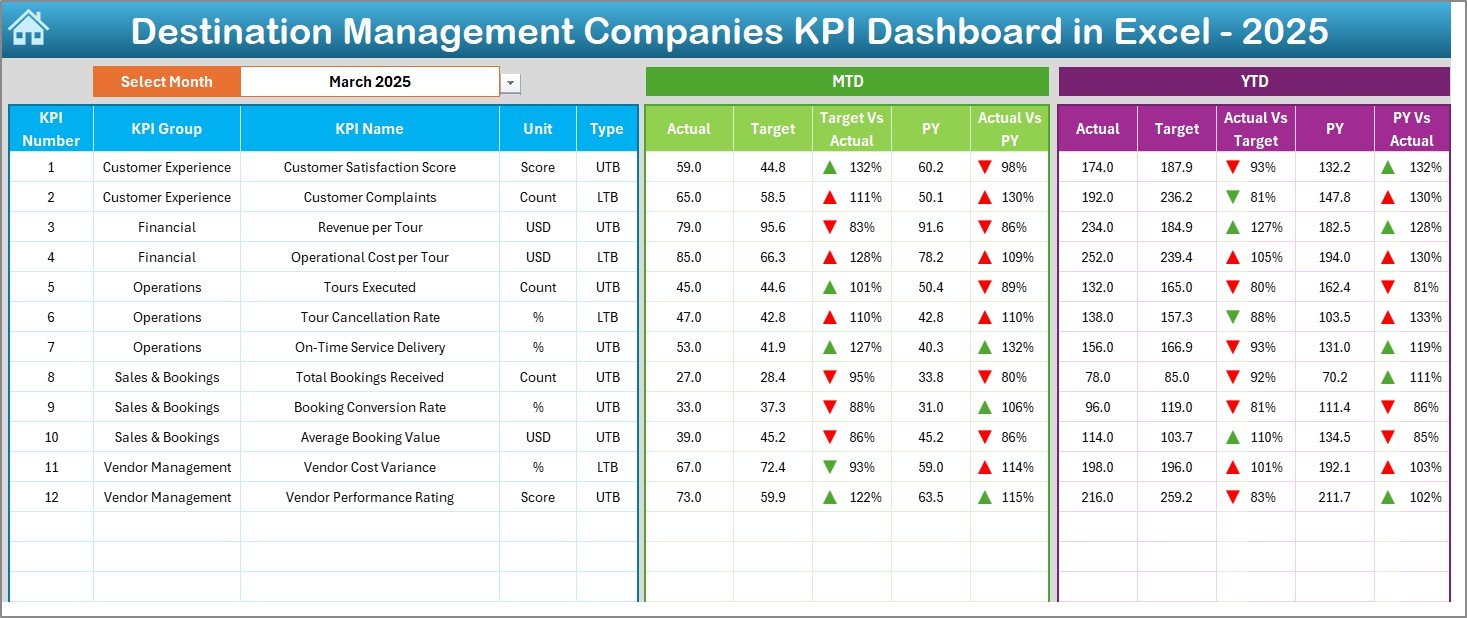
The Dashboard Sheet is the core of the KPI Dashboard.
Key Features of the Dashboard Sheet
-
Month selection drop-down at cell D3
-
Automatic update of all KPIs based on selected month
-
Displays MTD (Month-to-Date) metrics
-
Displays YTD (Year-to-Date) metrics
-
Shows Target vs Actual comparison
-
Shows Previous Year vs Actual comparison
-
Uses conditional formatting with up/down arrows
Because of these features, users instantly understand whether performance improves or declines.
Click to Purchases Destination Management Companies KPI Dashboard in Excel
What KPIs Are Displayed on the Dashboard Sheet?
The dashboard typically shows:
-
KPI Name
-
MTD Actual
-
MTD Target
-
MTD Previous Year
-
Target vs Actual variance
-
Previous Year vs Actual variance
-
YTD Actual
-
YTD Target
-
YTD Previous Year
Since everything appears on one screen, decision-makers do not waste time switching between sheets.
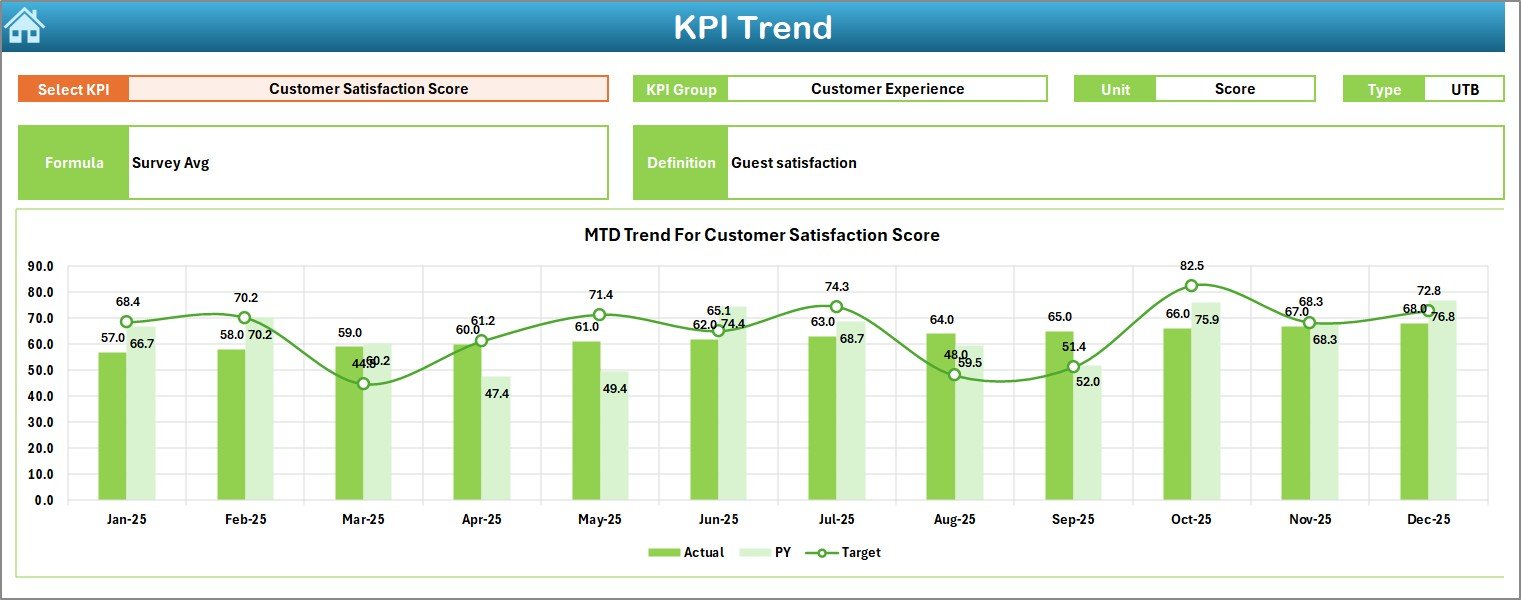
What Is the KPI Trend Sheet and Why Is It Important?
The KPI Trend Sheet helps users analyze performance over time.
Features of the KPI Trend Sheet
-
KPI selection drop-down at cell C3
-
Displays selected KPI details:
-
KPI Group
-
Unit of Measurement
-
KPI Type (Lower the Better / Upper the Better)
-
KPI Formula
-
KPI Definition
-
-
Shows MTD trend chart
-
Shows YTD trend chart
-
Compares Actual, Target, and Previous Year
Because trends tell stories, this sheet supports deeper performance analysis.
How Does the Actual Numbers Input Sheet Work?
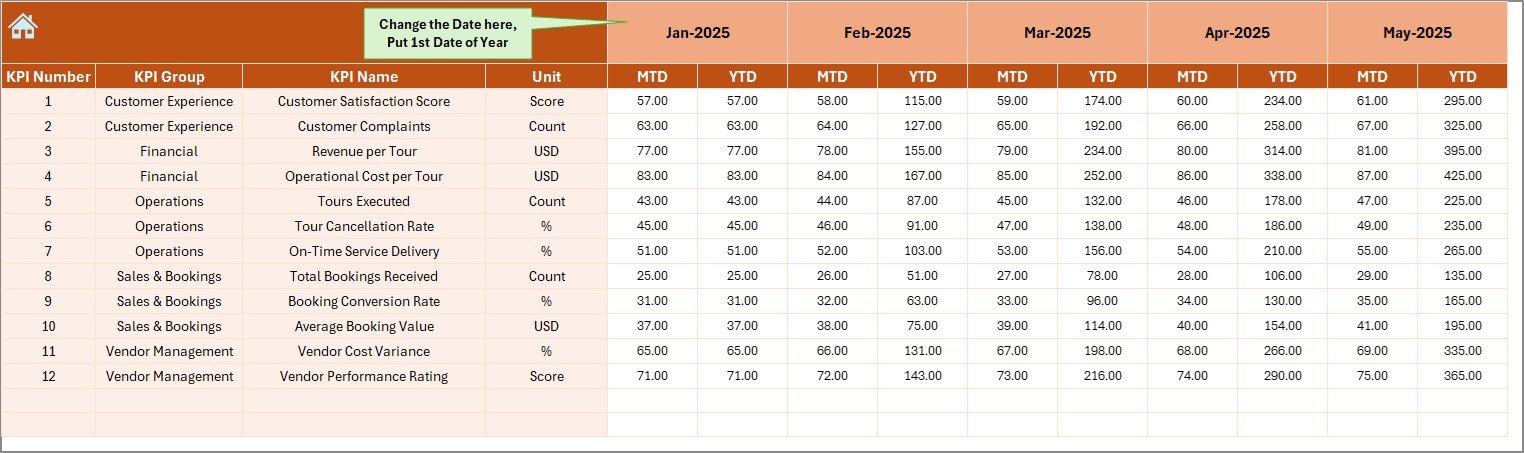
The Actual Numbers Input Sheet captures real performance data.
Key Characteristics
-
Users enter MTD and YTD actual values
-
Month selection available at cell E1
-
Users input the first month of the year at E1
-
The dashboard automatically adjusts calculations
Since users control data input, the dashboard stays flexible and scalable.
What Is the Purpose of the Target Sheet?
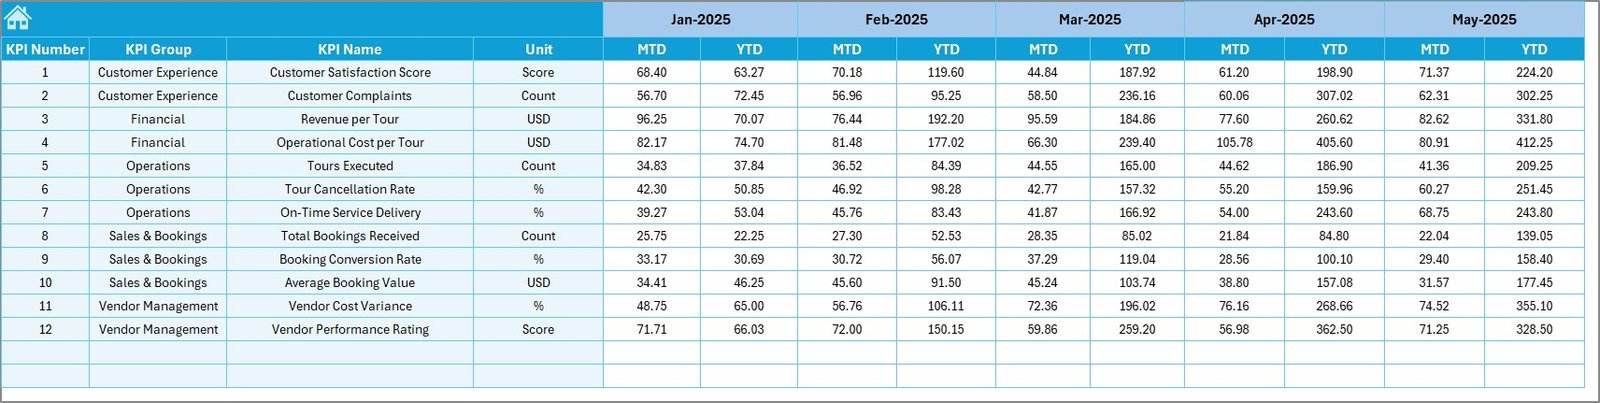
The Target Sheet defines performance goals.
Click to Purchases Destination Management Companies KPI Dashboard in Excel
Key Uses of the Target Sheet
-
Enter monthly MTD targets
-
Enter YTD targets for each KPI
-
Set realistic performance benchmarks
-
Enable variance analysis
Because targets guide performance, this sheet supports accountability.
Why Is the Previous Year Number Sheet Important?
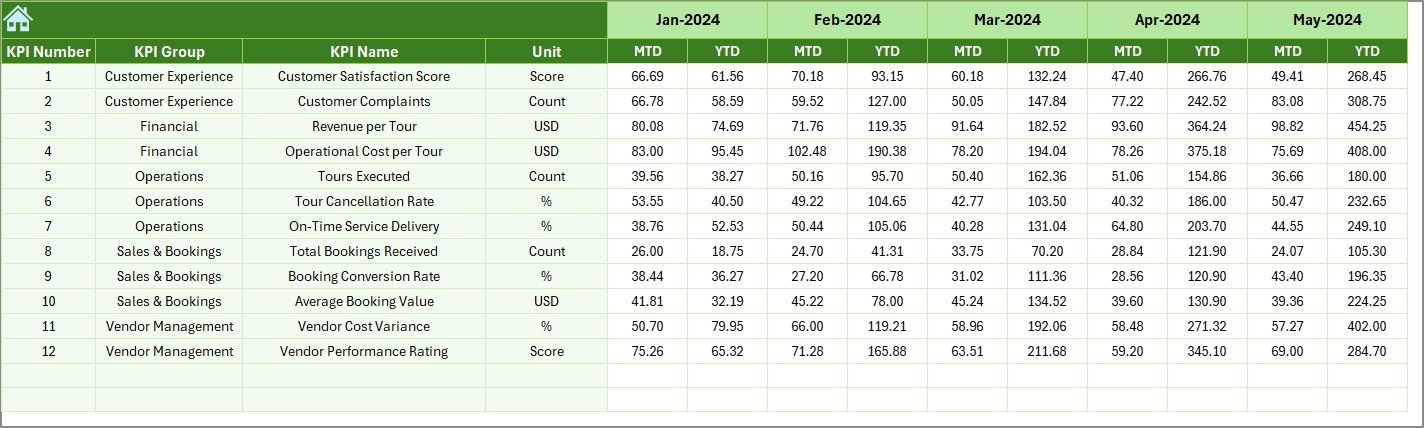
The Previous Year Number Sheet allows historical comparison.
Benefits of the Previous Year Sheet
-
Enter last year’s KPI values
-
Compare current performance with past performance
-
Identify growth, decline, or stability
-
Support trend-based decision-making
As a result, management gains long-term visibility.
What Is the KPI Definition Sheet Used For?
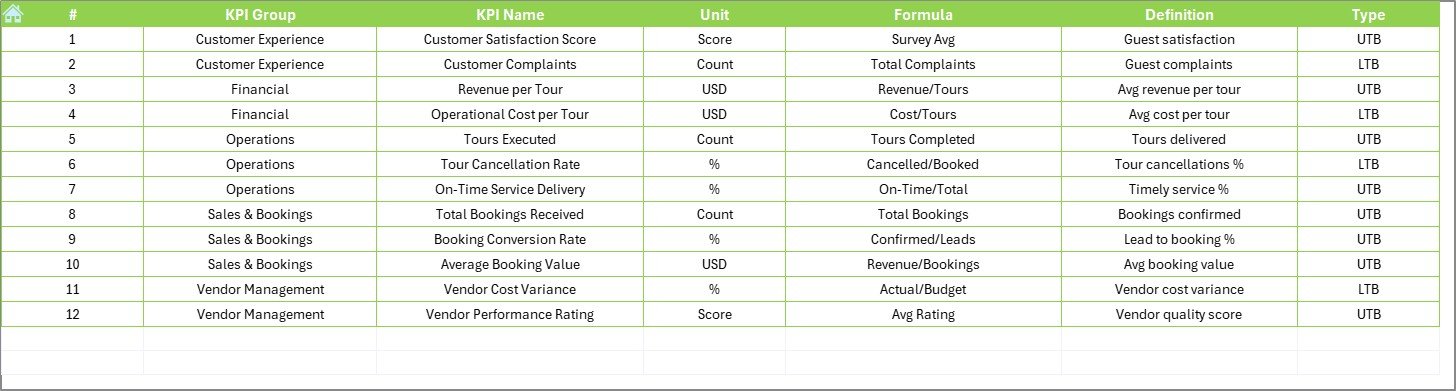
The KPI Definition Sheet acts as a reference table.
Information Stored in the KPI Definition Sheet
-
KPI Name
-
KPI Group
-
Unit of Measurement
-
KPI Formula
-
KPI Definition
-
KPI Type (LTB or UTB)
Because definitions remain centralized, teams avoid confusion and misinterpretation.
What Are Common KPIs Tracked by Destination Management Companies?
Although KPIs vary by business model, common DMC KPIs include:
-
Client Satisfaction Score
-
Event Execution Rate
-
Vendor Fulfillment Rate
-
Cost Variance
-
Revenue per Client
-
Booking Conversion Rate
-
On-Time Delivery Percentage
-
Average Response Time
-
Budget Utilization Rate
-
Repeat Client Percentage
By tracking these KPIs, DMCs improve service delivery and profitability.
Advantages of Destination Management Companies KPI Dashboard in Excel
A KPI dashboard in Excel offers several strong advantages.
1. Centralized Performance Tracking
The dashboard consolidates all KPIs in one file. As a result, teams avoid scattered reports and inconsistent data.
2. Improved Decision-Making
Because data updates automatically, management reacts faster to performance changes.
3. Cost-Effective Solution
Excel dashboards eliminate the need for expensive software or licenses.
4. User-Friendly Interface
Drop-downs, buttons, and visuals make the dashboard easy to use for non-technical users.
5. Time Savings
Automated calculations reduce manual reporting work.
6. Customizable Structure
Teams modify KPIs, targets, and formats based on business needs.
7. Better Accountability
Clear targets and variances encourage ownership and performance improvement.
Click to Purchases Destination Management Companies KPI Dashboard in Excel
How Does This Dashboard Improve Operational Efficiency?
This KPI dashboard improves efficiency by:
-
Reducing manual reporting effort
-
Highlighting performance gaps early
-
Supporting proactive decision-making
-
Improving communication between teams
-
Aligning operations with business goals
Because efficiency increases, profitability also improves.
Best Practices for Destination Management Companies KPI Dashboard in Excel
To get maximum value, follow these best practices.
1. Define KPIs Clearly
Always define KPIs with clear formulas and definitions to avoid confusion.
2. Use Consistent Units
Ensure consistent units across actual, target, and previous year data.
3. Update Data Regularly
Update actual numbers monthly to keep insights accurate.
4. Set Realistic Targets
Set achievable targets that align with business strategy.
5. Review Trends, Not Just Numbers
Use the trend sheet to understand patterns over time.
6. Limit KPI Overload
Track only meaningful KPIs that drive decisions.
7. Train Users Properly
Educate users on how to enter data and interpret results.
Who Can Use a Destination Management Companies KPI Dashboard in Excel?
This dashboard suits:
-
Destination Management Companies
-
Event management firms
-
Travel and tourism agencies
-
Corporate travel planners
-
Operations managers
-
Finance and reporting teams
Because Excel remains widely used, adoption stays easy.
How Does This Dashboard Support Strategic Planning?
The dashboard supports strategy by:
-
Highlighting high-performing destinations
-
Identifying cost overruns early
-
Measuring service quality consistently
-
Supporting annual planning and forecasting
-
Enabling data-driven goal setting
Therefore, leadership gains confidence in decision-making.
Conclusion
A Destination Management Companies KPI Dashboard in Excel provides a powerful, practical, and cost-effective way to monitor performance across destinations, services, and clients.
By centralizing KPIs, automating calculations, and visualizing trends, this dashboard helps destination management companies move from reactive reporting to proactive management.
When teams track the right KPIs consistently, they improve service quality, control costs, and drive sustainable growth. Therefore, implementing this dashboard becomes a smart investment for any destination management company seeking clarity, control, and performance excellence.
Frequently Asked Questions (FAQs)
What is a Destination Management Companies KPI Dashboard in Excel?
It is an Excel-based reporting tool that tracks and visualizes KPIs related to destination management operations.
Can I customize the KPIs in the dashboard?
Yes, you can easily add, remove, or modify KPIs based on your business needs.
Do I need advanced Excel skills to use this dashboard?
No, basic Excel knowledge is sufficient to use and maintain the dashboard.
How often should I update the data?
You should update actual data monthly for accurate MTD and YTD insights.
Can this dashboard handle multiple destinations?
Yes, you can structure KPIs to track performance across multiple destinations.
Does the dashboard support year-over-year comparison?
Yes, the Previous Year Number sheet enables easy year-over-year analysis.
Is this dashboard suitable for small DMCs?
Absolutely. Small and large destination management companies can both benefit.
Visit our YouTube channel to learn step-by-step video tutorials